| Param | Original file | Final file |
|---|---|---|
| Filename | modeM0/AS1C07_001T03_9000006456_51394cztM0_level2.fits | modeM0/AS1C07_001T03_9000006456_51394cztM0_level2_quad_clean.evt |
| Size (bytes) | 359,994,240 | 53,994,240 |
| Size | 343.3 MB | 51.5 MB |
| Events in quadrant A | 4,325,806 | 352,050 |
| Events in quadrant B | 2,252,506 | 401,474 |
| Events in quadrant C | 4,402,719 | 288,147 |
| Events in quadrant D | 2,060,131 | 334,577 |
| Mode SS | |||
|---|---|---|---|
| Quadrant | BADHDUFLAG | Total packets | Discarded packets |
| A | 0 | 83 | 11 |
| B | 0 | 84 | 12 |
| C | 0 | 81 | 7 |
| D | 0 | 81 | 7 |
| Mode M0 | |||
|---|---|---|---|
| Quadrant | BADHDUFLAG | Total packets | Discarded packets |
| A | 0 | 17255 | 1767 |
| B | 0 | 10310 | 1149 |
| C | 0 | 17215 | 1720 |
| D | 0 | 9659 | 1036 |
| Mode M9 | |||
|---|---|---|---|
| Quadrant | BADHDUFLAG | Total packets | Discarded packets |
| A | 0 | 9 | 9 |
| B | 0 | 9 | 8 |
| C | 0 | 4 | 4 |
| D | 0 | 8 | 8 |
| Quadrant | Total seconds | Saturated seconds | Saturation percentage |
|---|---|---|---|
| A | 3666 | 260 | 7.092199% |
| B | 3657 | 66 | 1.804758% |
| C | 3642 | 887 | 24.354750% |
| D | 3665 | 41 | 1.118690% |
Noise dominated data is calculated using 1-second bins in cleaned event files. If a bin has >2000 counts, and if more than 50% of those come from <1% of pixels, then it is considered to be noise-dominated and hence unusable.
| Quadrant | # 1 sec bins | Bins with >0 counts | Bins with >2000 counts | High rate bins dominated by noise | Noise dominated (total time) | Noise dominated (detector-on time) | Marked lightcurve |
|---|---|---|---|---|---|---|---|
| A | 7441 | 3689 | 234 | 234 | 3.14% | 6.34% | 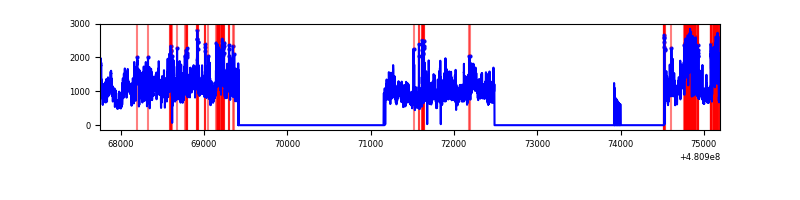 |
| B | 7441 | 3679 | 34 | 34 | 0.46% | 0.92% | 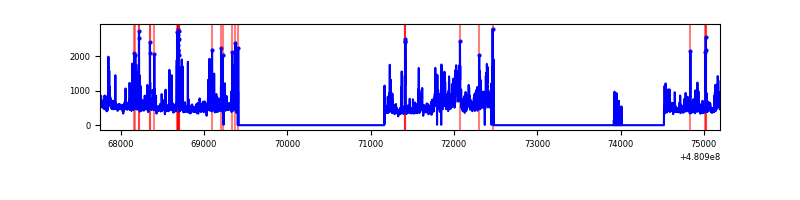 |
| C | 7441 | 3658 | 907 | 907 | 12.19% | 24.79% | 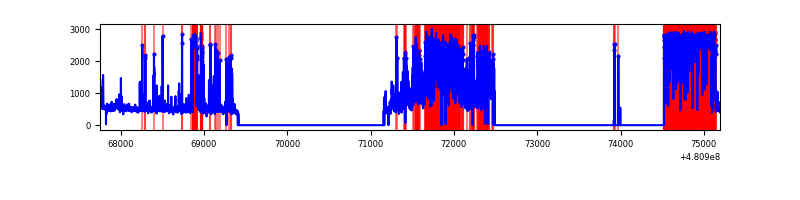 |
| D | 7441 | 3693 | 47 | 47 | 0.63% | 1.27% | 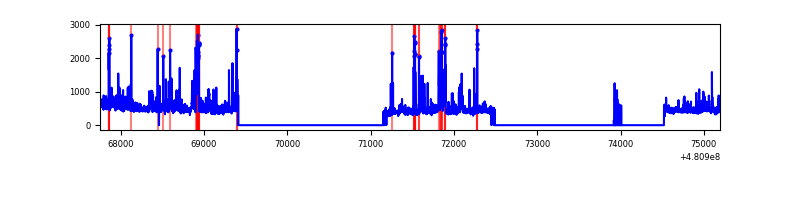 |
Top three noisy pixels from each quadrant. If the there are fewer than three noisy pixels in the level2.evt file, extra rows are filled as -1
| Pixel properties | Quadrant properties | ||||||
|---|---|---|---|---|---|---|---|
| Quadrant | DetID | PixID | Counts | Sigma | Mean | Median | Sigma |
| A | 12 | 3 | 1887334 | 19232.24 | 394 | 385 | 98.1 |
| A | 15 | 174 | 366819 | 3734.78 | 394 | 385 | 98.1 |
| A | 12 | 194 | 217689 | 2214.81 | 394 | 385 | 98.1 |
| B | 5 | 185 | 244389 | 2826.48 | 401 | 387 | 86.3 |
| B | 0 | 216 | 129403 | 1494.5 | 401 | 387 | 86.3 |
| B | 4 | 81 | 65506 | 754.33 | 401 | 387 | 86.3 |
| C | 4 | 12 | 1722203 | 17962.29 | 343 | 340 | 95.9 |
| C | 15 | 179 | 707250 | 7374.41 | 343 | 340 | 95.9 |
| C | 15 | 206 | 166435 | 1732.69 | 343 | 340 | 95.9 |
| D | 3 | 12 | 158136 | 1435.39 | 393 | 379 | 109.9 |
| D | 6 | 42 | 113275 | 1027.21 | 393 | 379 | 109.9 |
| D | 11 | 176 | 93275 | 845.24 | 393 | 379 | 109.9 |
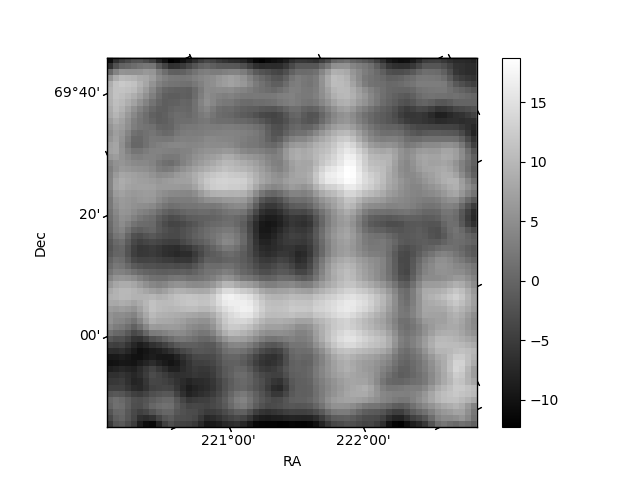
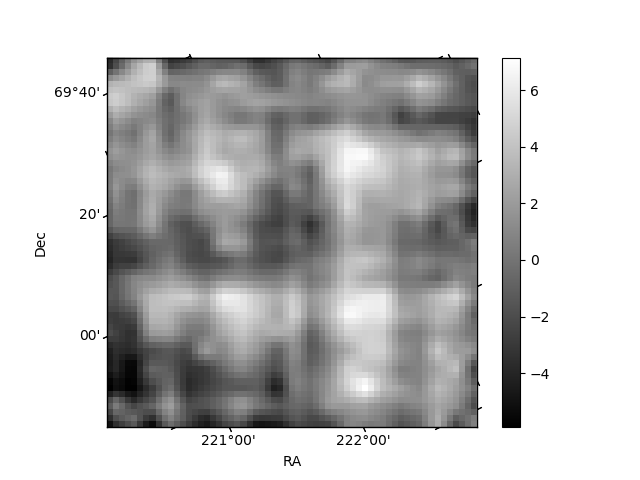
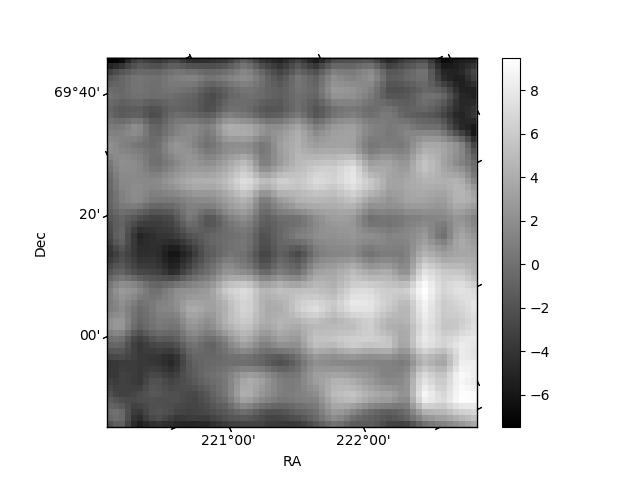
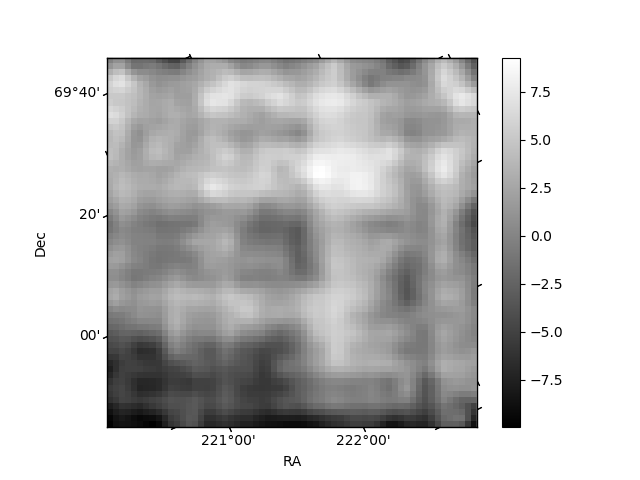
Histogram calculated using DETX and DETY for each event in the final _common_clean file
| Quadrant A | 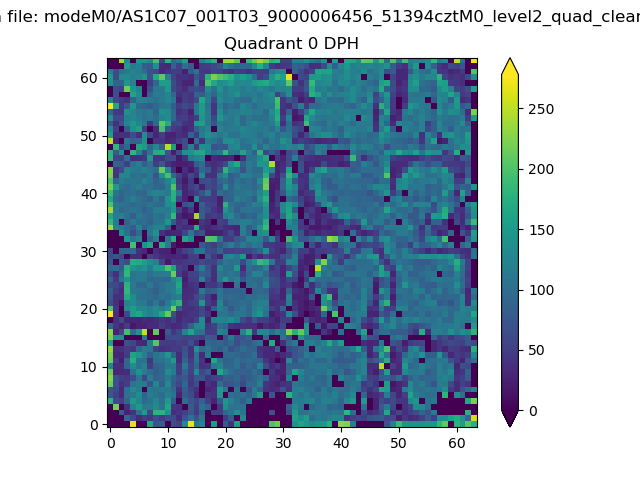 |
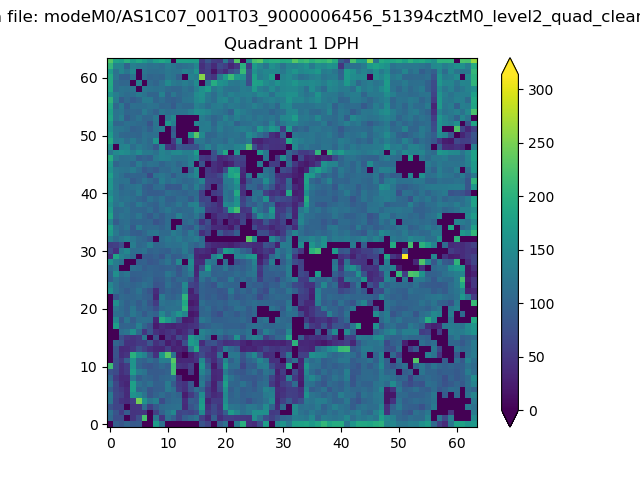 |
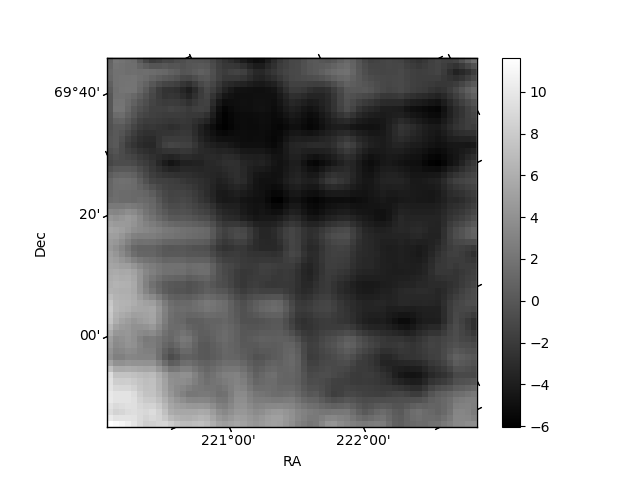
Quadrant B |
|---|---|---|---|
| Quadrant D | 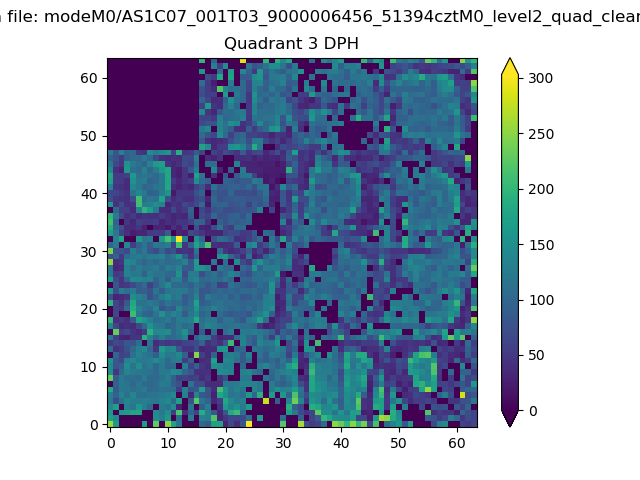 |
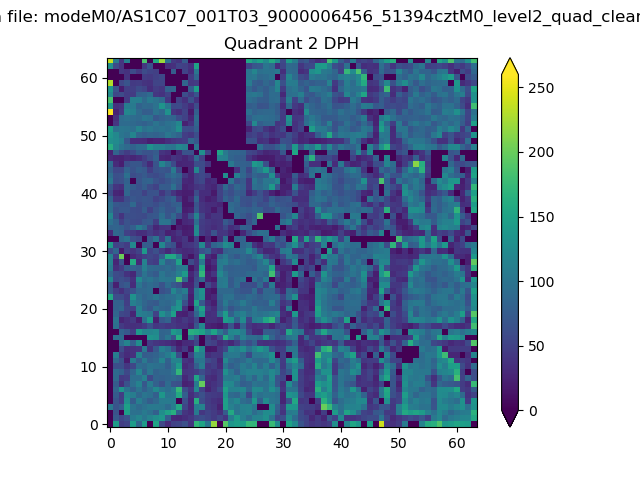 |
Quadrant C |
| Plot type | Count rate plots | Images |
|---|---|---|
| Comparison with Poisson distribution Blue bars denote a histogram of data divided into 1 sec bins. Red curve is a Poisson curve with rate = median count rate of data. |
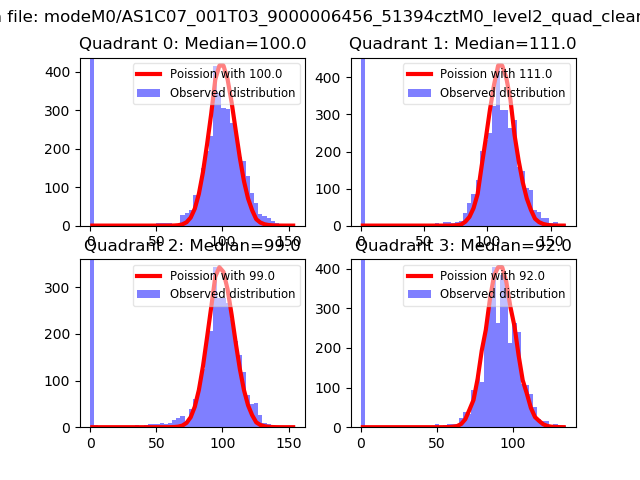 |
 |
| Quadrant-wise count rates Data is divided into 100 sec bins |
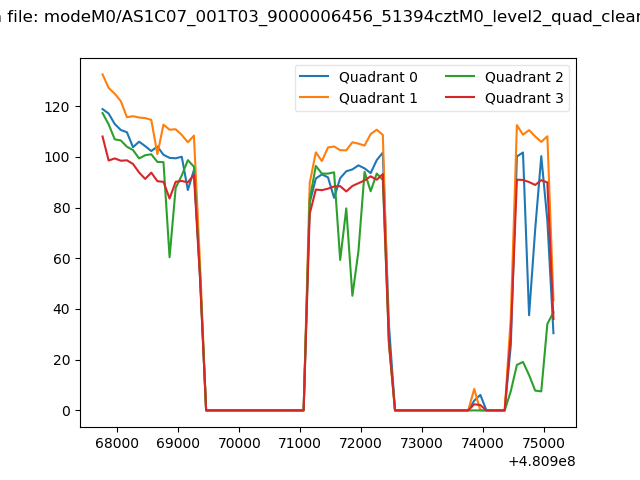 |
|
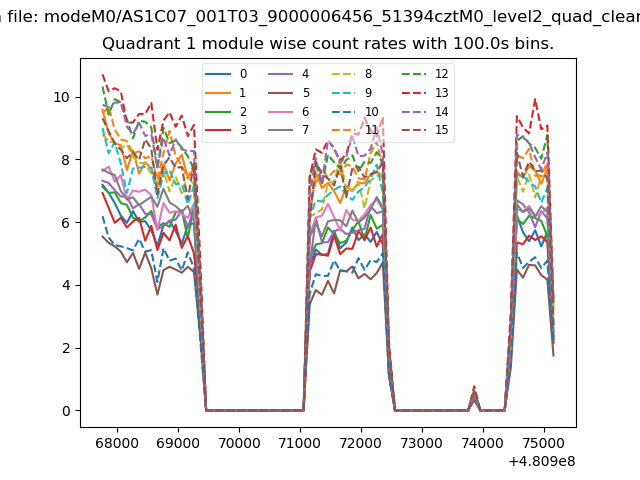
| Module-wise count rates for Quadrant A Data is divided into 100 sec bins |
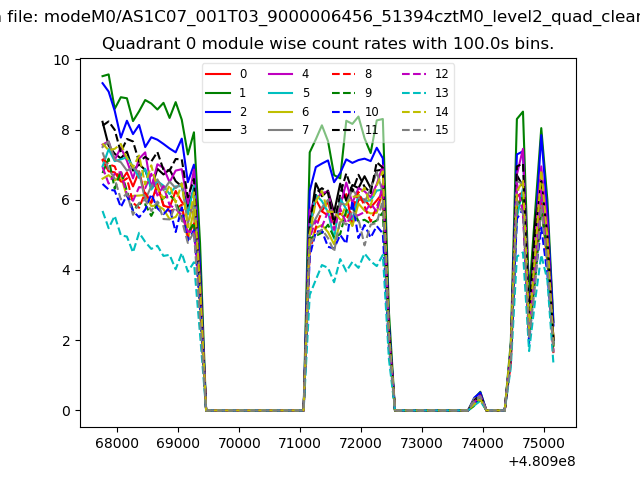 |
 |
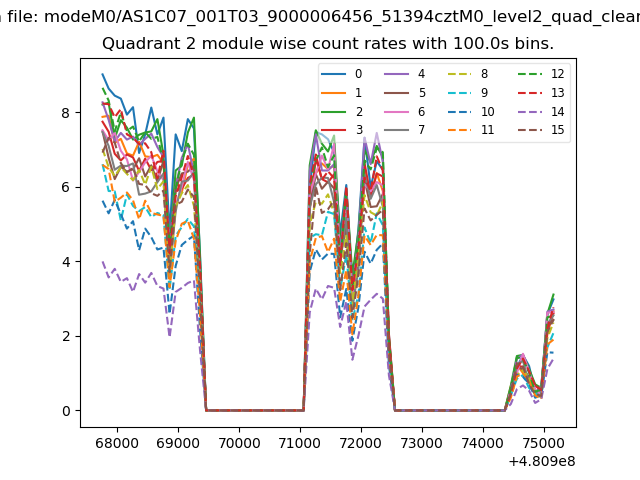
| Module-wise count rates for Quadrant B Data is divided into 100 sec bins |
 |
 |
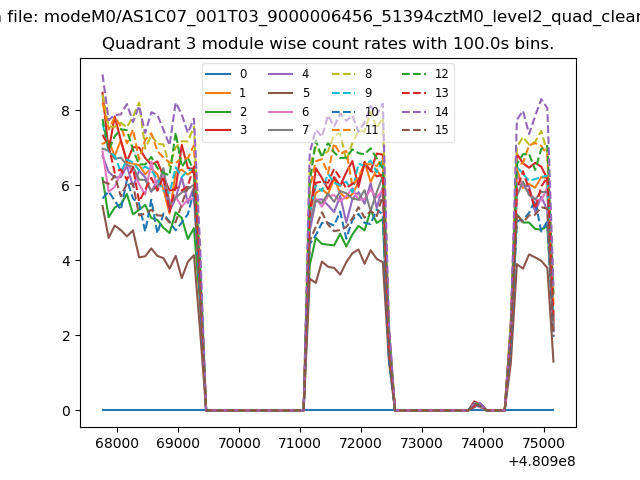
| Module-wise count rates for Quadrant C Data is divided into 100 sec bins |
 |
 |
| Module-wise count rates for Quadrant D Data is divided into 100 sec bins |
 |
 |
| Parameter | Plot |
|---|---|
| CZT HV Monitor | 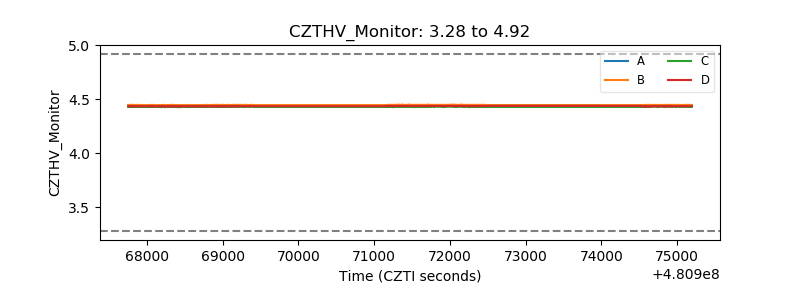 |
| D_VDD | 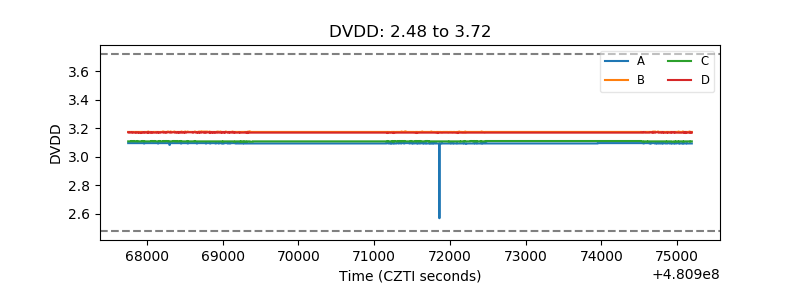 |
| Temperature 1 | 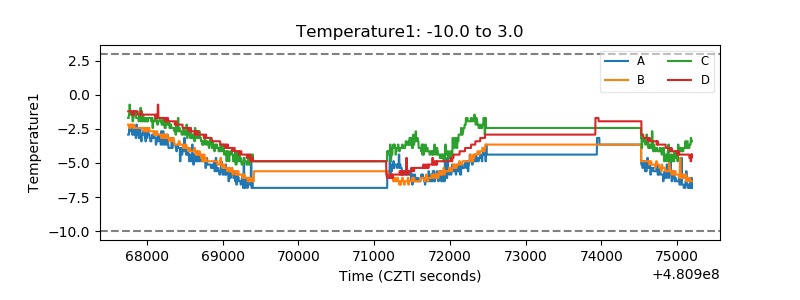 |
| Veto HV Monitor | 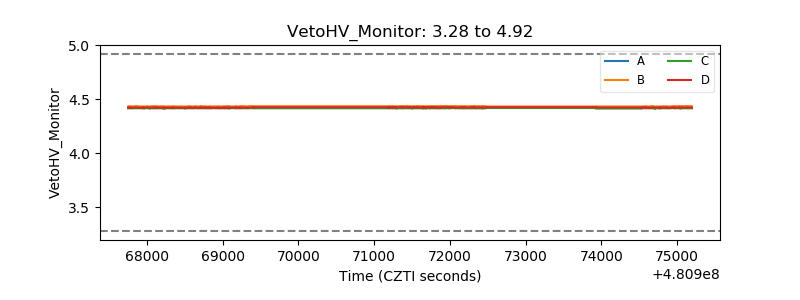 |
| Veto LLD | 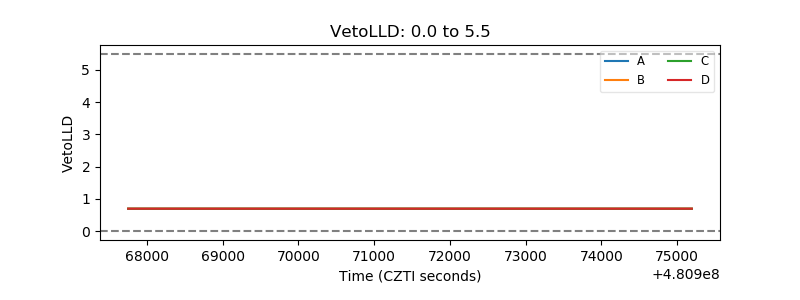 |
| Alpha Counter | 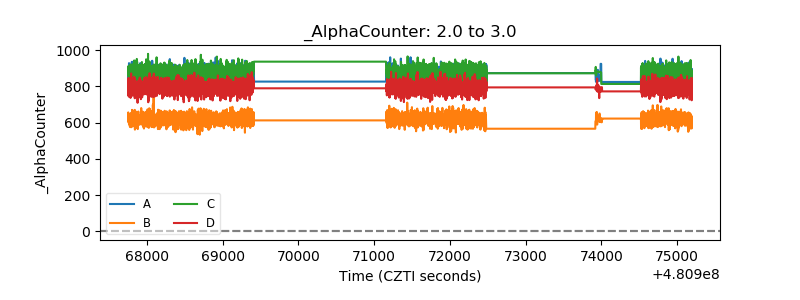 |
| _CPM_Rate | 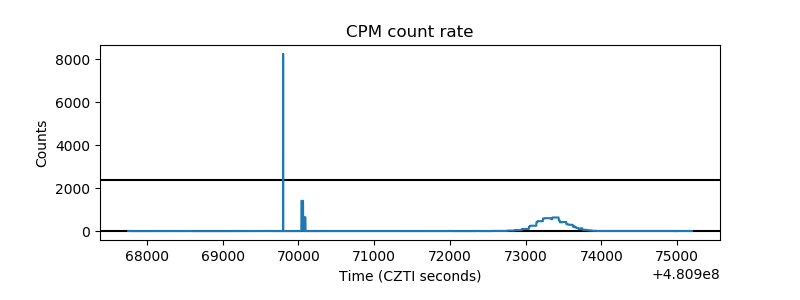 |
| CZT Counter | 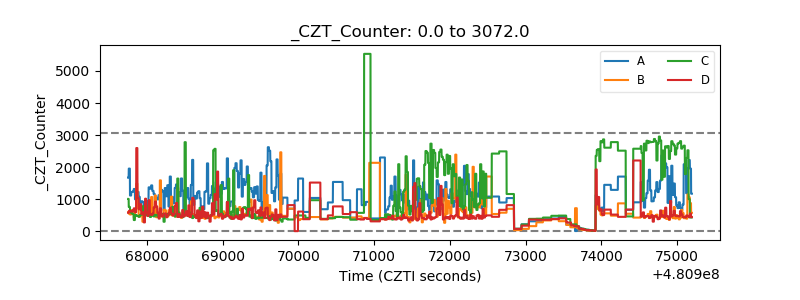 |
| +2.5 Volts monitor | 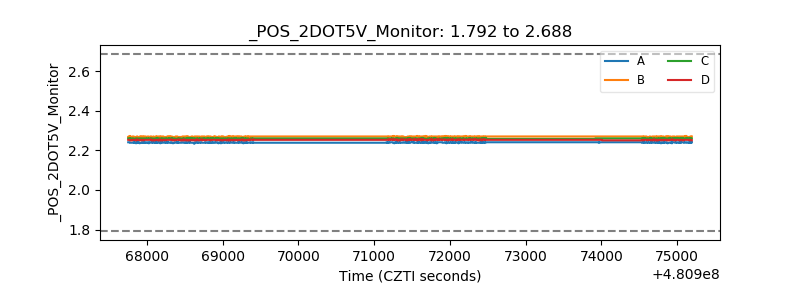 |
| +5 Volts monitor | 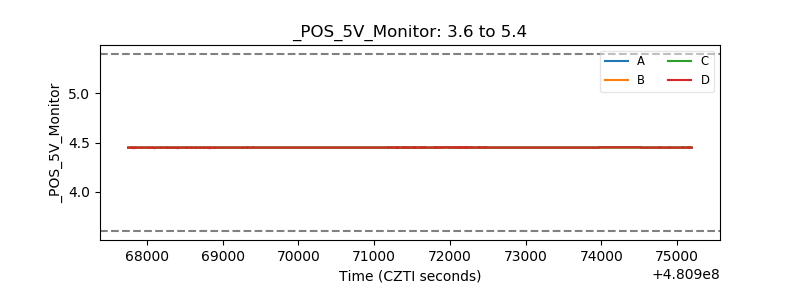 |
| _ROLL_ROT | 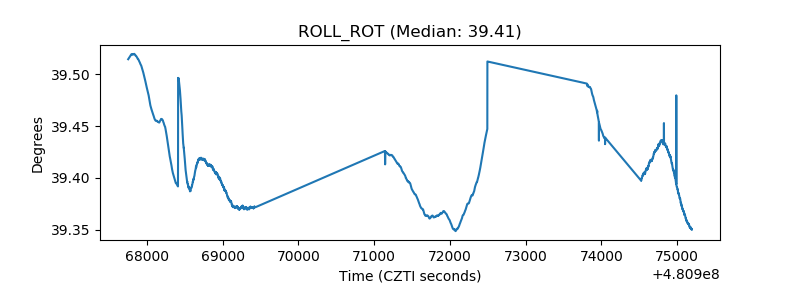 |
| _Roll_DEC | 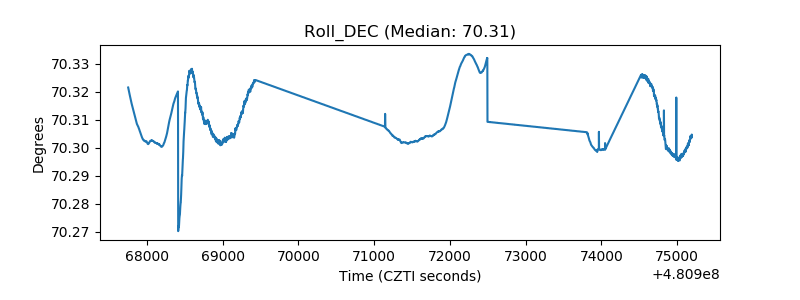 |
| _Roll_RA | 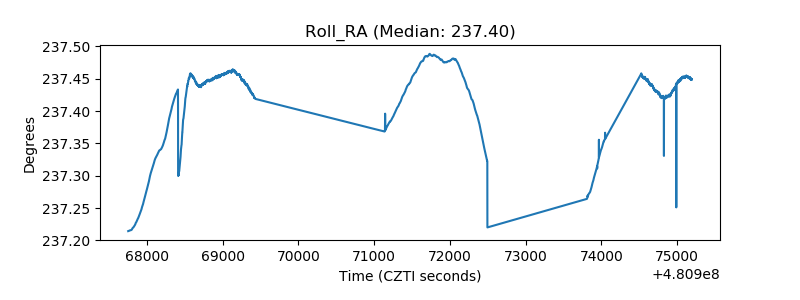 |
| Veto Counter | 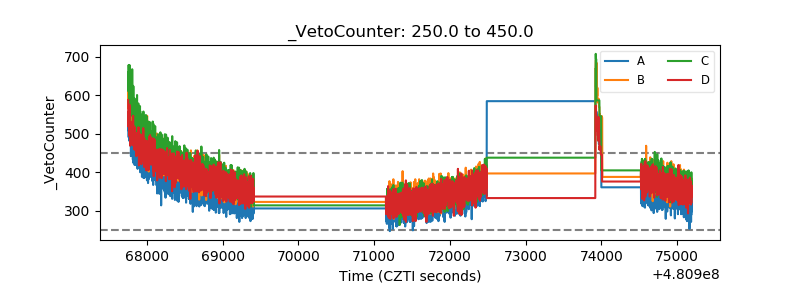 |