| Param | Original file | Final file |
|---|---|---|
| Filename | modeM0/AS1C07_001T03_9000006456_51395cztM0_level2.fits | modeM0/AS1C07_001T03_9000006456_51395cztM0_level2_quad_clean.evt |
| Size (bytes) | 415,751,040 | 44,104,320 |
| Size | 396.5 MB | 42.1 MB |
| Events in quadrant A | 4,477,794 | 283,173 |
| Events in quadrant B | 2,705,480 | 324,608 |
| Events in quadrant C | 5,943,079 | 179,454 |
| Events in quadrant D | 1,996,425 | 304,532 |
| Mode SS | |||
|---|---|---|---|
| Quadrant | BADHDUFLAG | Total packets | Discarded packets |
| A | 0 | 84 | 8 |
| B | 0 | 77 | 2 |
| C | 0 | 80 | 4 |
| D | 0 | 82 | 6 |
| Mode M0 | |||
|---|---|---|---|
| Quadrant | BADHDUFLAG | Total packets | Discarded packets |
| A | 0 | 17125 | 1363 |
| B | 0 | 11195 | 812 |
| C | 0 | 21411 | 1405 |
| D | 0 | 9061 | 641 |
| Mode M9 | |||
|---|---|---|---|
| Quadrant | BADHDUFLAG | Total packets | Discarded packets |
| A | 0 | 23 | 2 |
| B | 0 | 25 | 4 |
| C | 0 | 30 | 9 |
| D | 0 | 22 | 1 |
| Quadrant | Total seconds | Saturated seconds | Saturation percentage |
|---|---|---|---|
| A | 3420 | 710 | 20.760234% |
| B | 3429 | 488 | 14.231554% |
| C | 3421 | 1766 | 51.622333% |
| D | 3436 | 117 | 3.405122% |
Noise dominated data is calculated using 1-second bins in cleaned event files. If a bin has >2000 counts, and if more than 50% of those come from <1% of pixels, then it is considered to be noise-dominated and hence unusable.
| Quadrant | # 1 sec bins | Bins with >0 counts | Bins with >2000 counts | High rate bins dominated by noise | Noise dominated (total time) | Noise dominated (detector-on time) | Marked lightcurve |
|---|---|---|---|---|---|---|---|
| A | 7874 | 3430 | 483 | 483 | 6.13% | 14.08% | 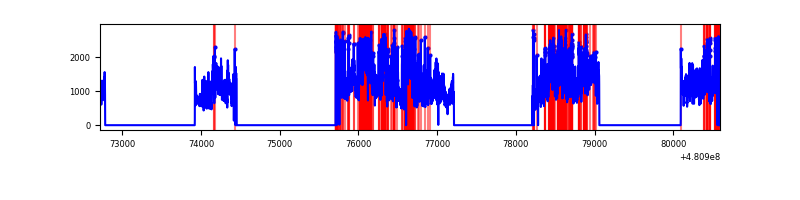 |
| B | 7867 | 3437 | 276 | 276 | 3.51% | 8.03% | 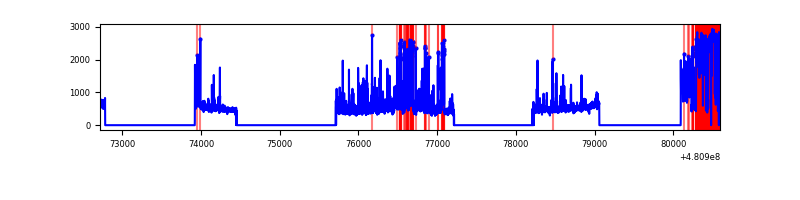 |
| C | 7872 | 3427 | 1554 | 1554 | 19.74% | 45.35% | 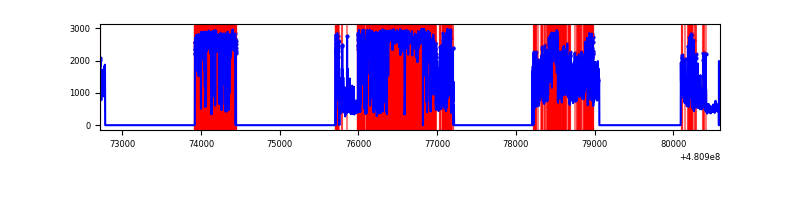 |
| D | 7878 | 3450 | 42 | 42 | 0.53% | 1.22% | 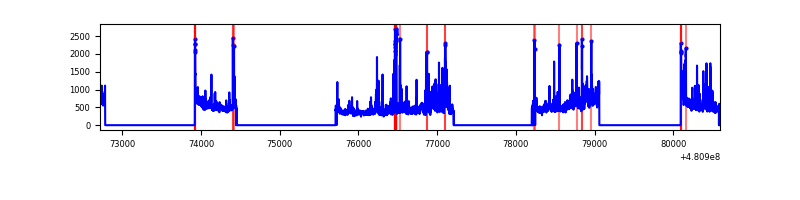 |
Top three noisy pixels from each quadrant. If the there are fewer than three noisy pixels in the level2.evt file, extra rows are filled as -1
| Pixel properties | Quadrant properties | ||||||
|---|---|---|---|---|---|---|---|
| Quadrant | DetID | PixID | Counts | Sigma | Mean | Median | Sigma |
| A | 12 | 3 | 1370146 | 15498.74 | 357 | 348 | 88.4 |
| A | 15 | 174 | 946012 | 10699.82 | 357 | 348 | 88.4 |
| A | 4 | 175 | 238204 | 2691.25 | 357 | 348 | 88.4 |
| B | 5 | 172 | 729370 | 9690.09 | 354 | 342 | 75.2 |
| B | 5 | 185 | 185110 | 2455.9 | 354 | 342 | 75.2 |
| B | 6 | 51 | 114781 | 1521.1 | 354 | 342 | 75.2 |
| C | 4 | 12 | 3878547 | 53917.15 | 261 | 259 | 71.9 |
| C | 15 | 179 | 824823 | 11463.34 | 261 | 259 | 71.9 |
| C | 13 | 3 | 75185 | 1041.64 | 261 | 259 | 71.9 |
| D | 11 | 176 | 265641 | 2567.29 | 369 | 356 | 103.3 |
| D | 2 | 153 | 89535 | 863.03 | 369 | 356 | 103.3 |
| D | 2 | 120 | 25707 | 245.33 | 369 | 356 | 103.3 |
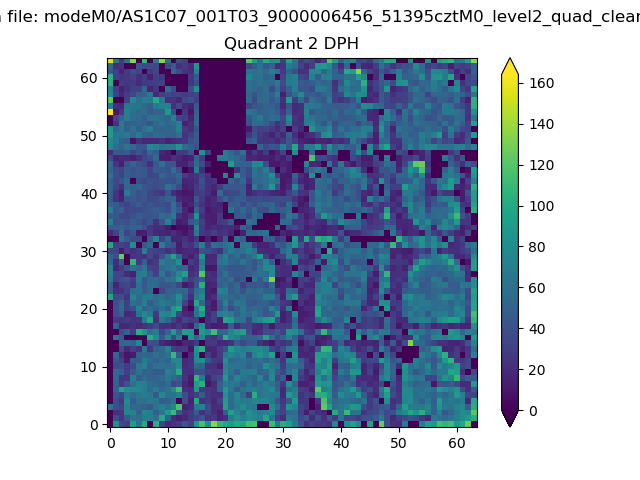
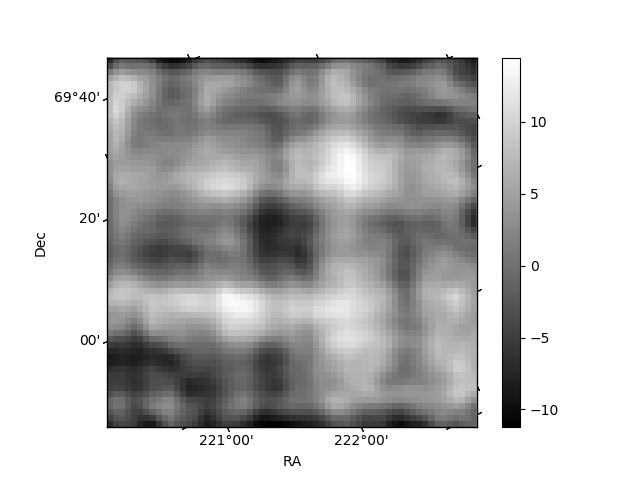
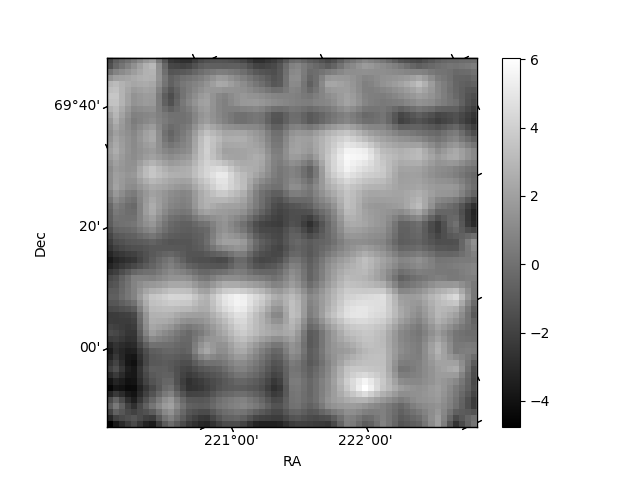
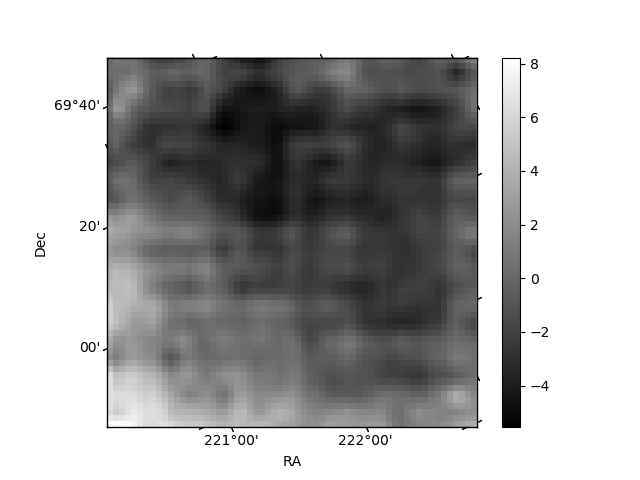
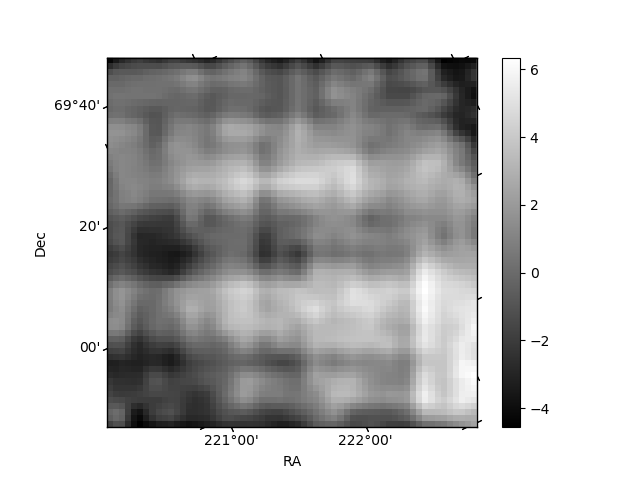
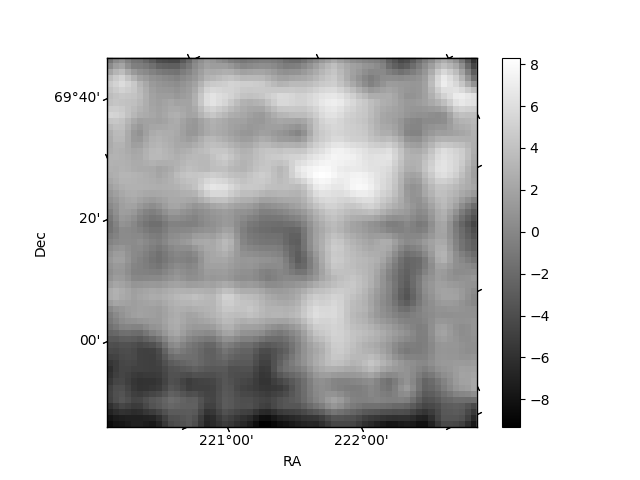
Histogram calculated using DETX and DETY for each event in the final _common_clean file
| Quadrant A | 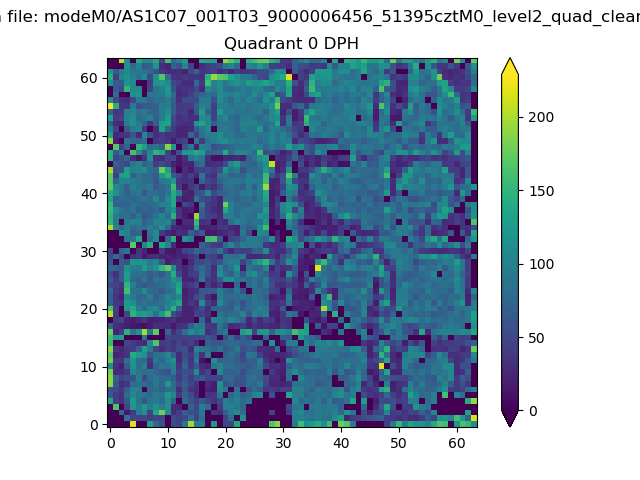 |
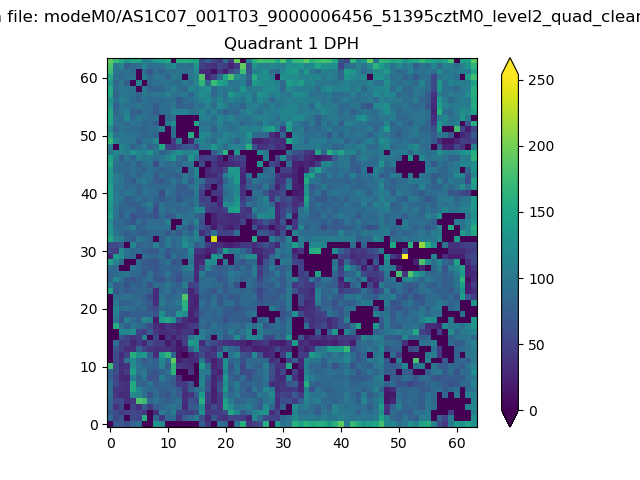 |
Quadrant B |
|---|---|---|---|
| Quadrant D | 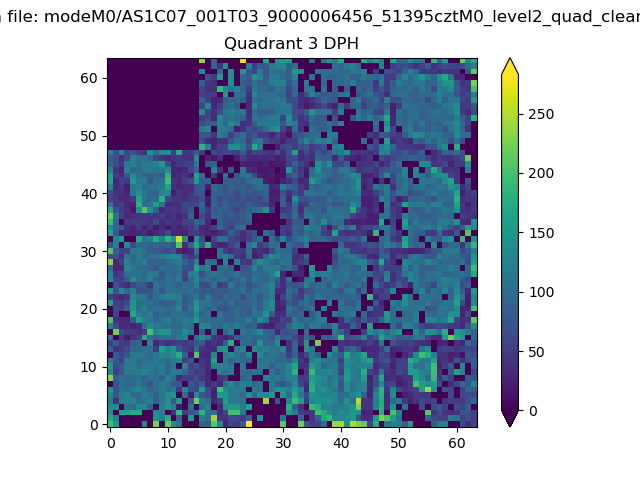 |
 |
Quadrant C |
| Plot type | Count rate plots | Images |
|---|---|---|
| Comparison with Poisson distribution Blue bars denote a histogram of data divided into 1 sec bins. Red curve is a Poisson curve with rate = median count rate of data. |
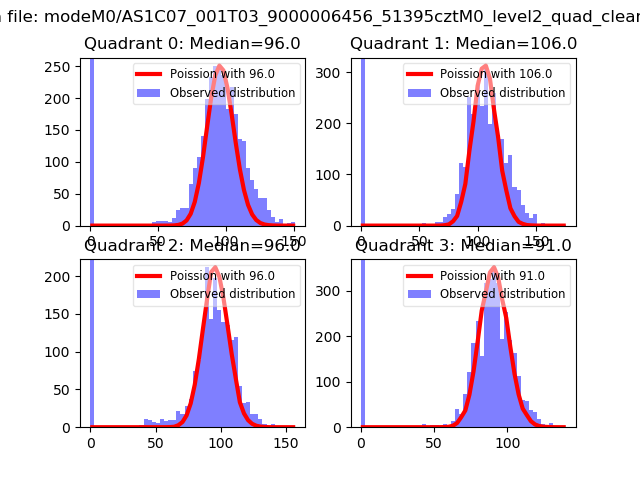 |
 |
| Quadrant-wise count rates Data is divided into 100 sec bins |
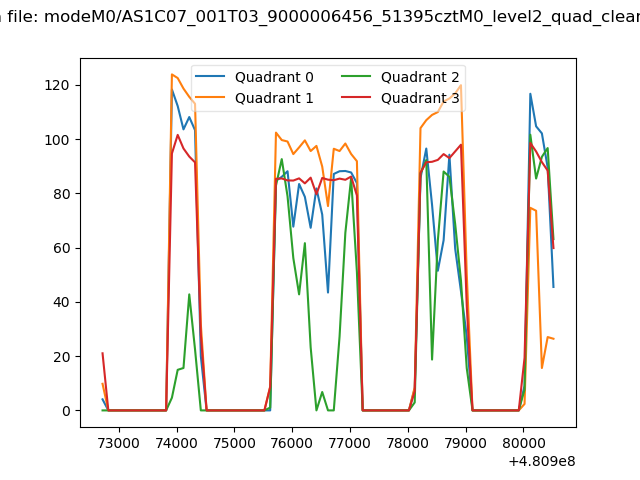 |
|
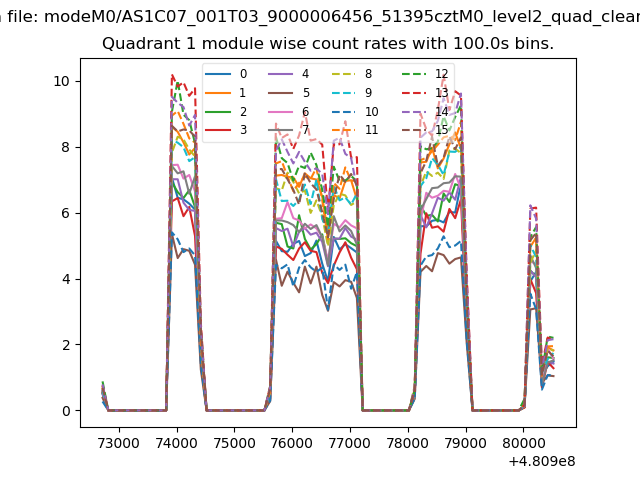
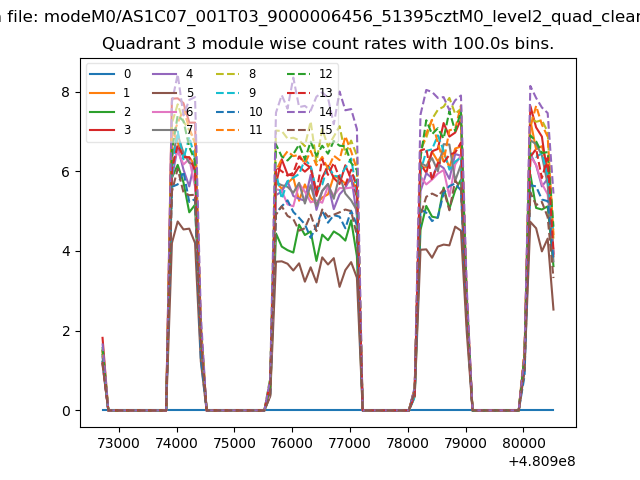
| Module-wise count rates for Quadrant A Data is divided into 100 sec bins |
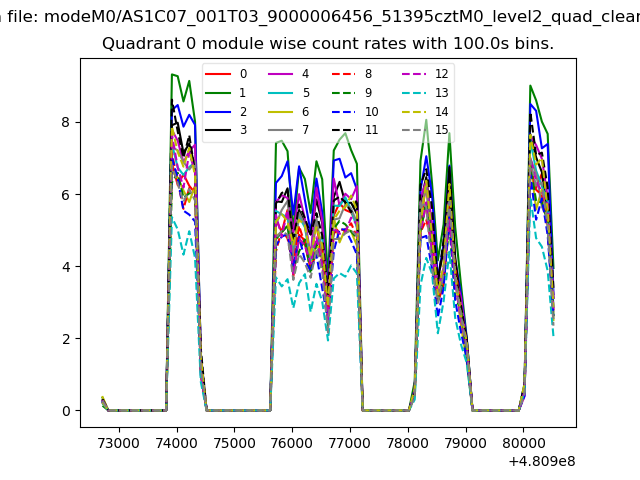 |
 |
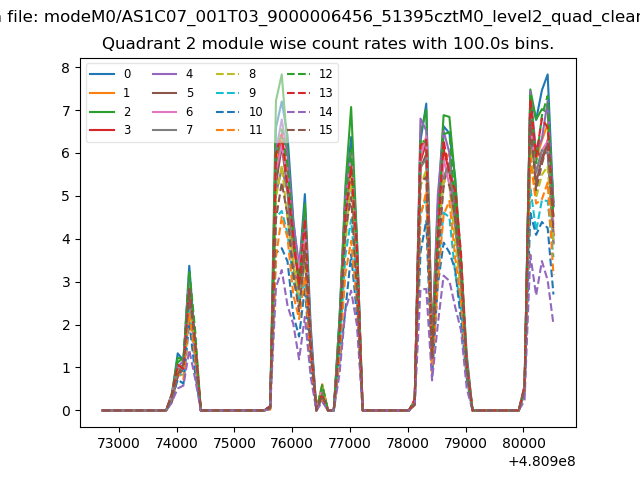
| Module-wise count rates for Quadrant B Data is divided into 100 sec bins |
 |
 |
| Module-wise count rates for Quadrant C Data is divided into 100 sec bins |
 |
 |
| Module-wise count rates for Quadrant D Data is divided into 100 sec bins |
 |
 |
| Parameter | Plot |
|---|---|
| CZT HV Monitor | 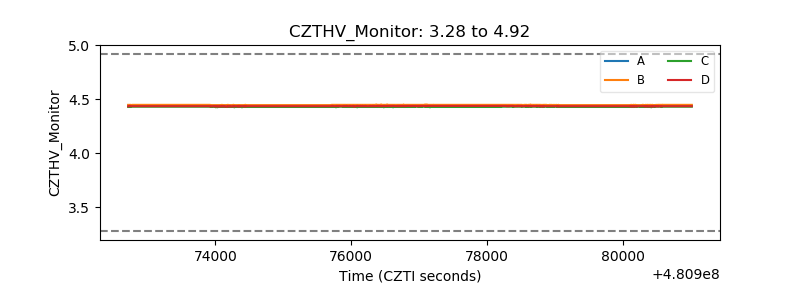 |
| D_VDD | 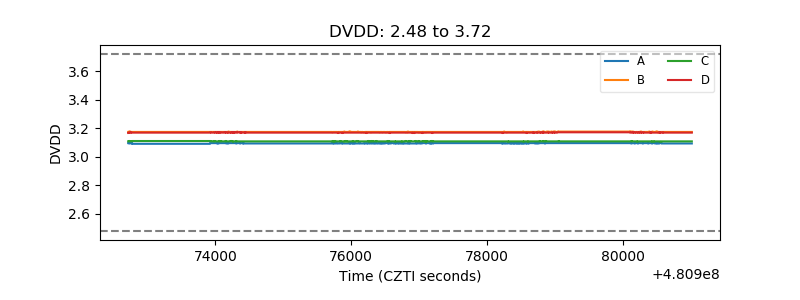 |
| Temperature 1 | 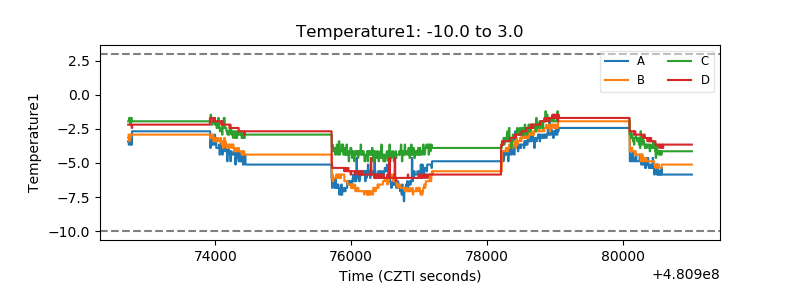 |
| Veto HV Monitor | 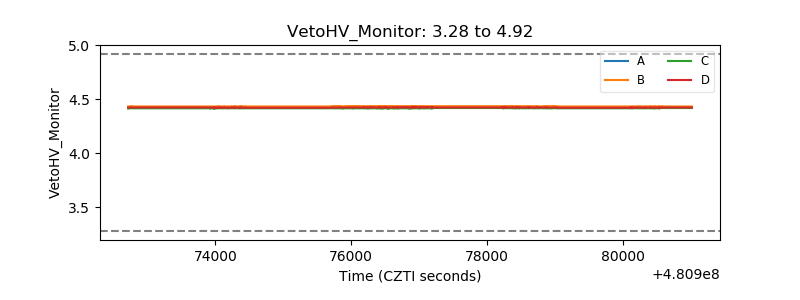 |
| Veto LLD | 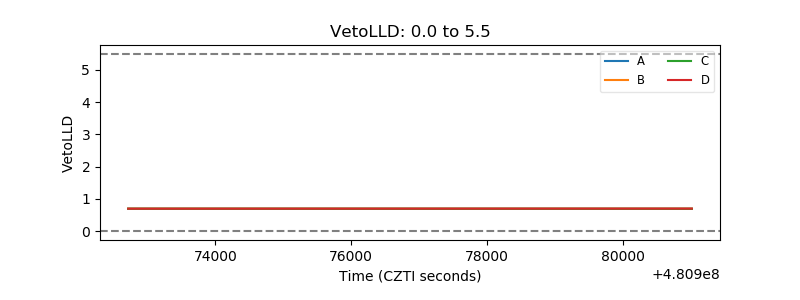 |
| Alpha Counter | 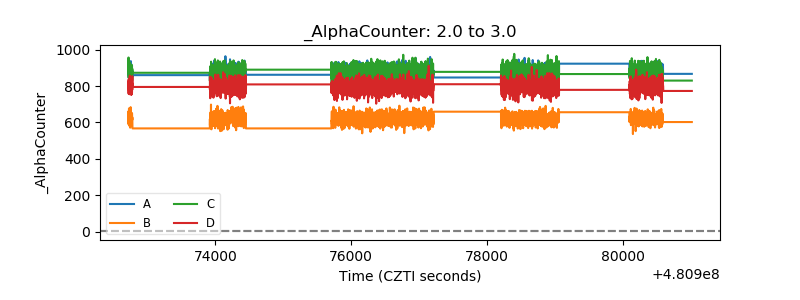 |
| _CPM_Rate | 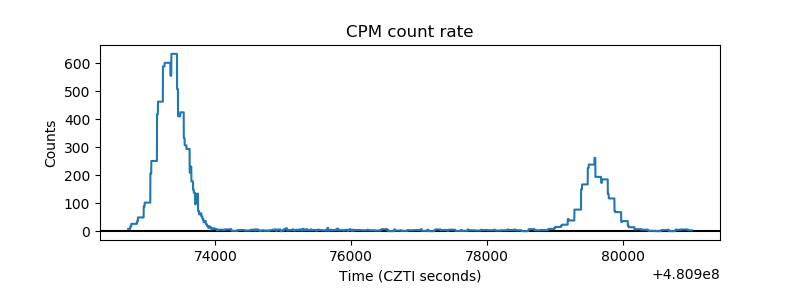 |
| CZT Counter | 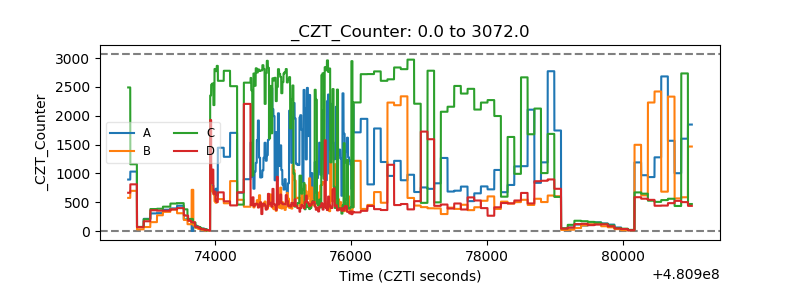 |
| +2.5 Volts monitor |  |
| +5 Volts monitor | 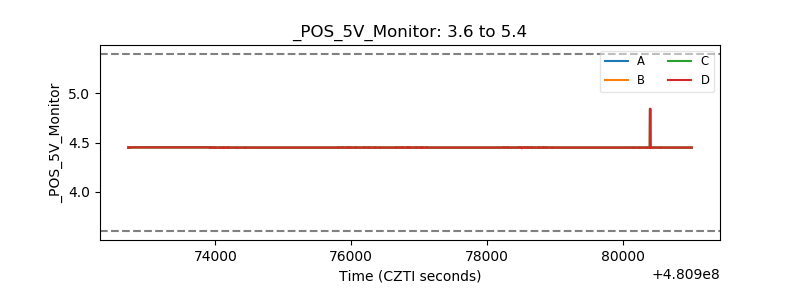 |
| _ROLL_ROT | 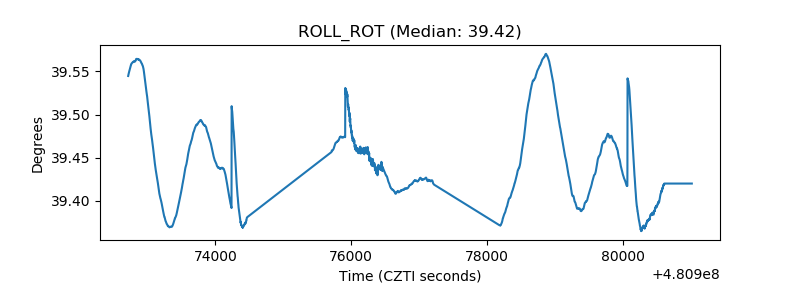 |
| _Roll_DEC | 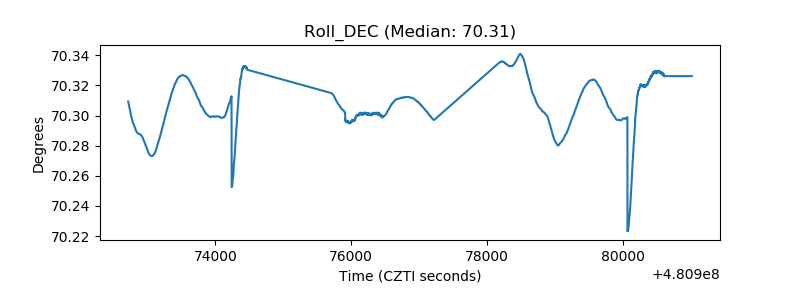 |
| _Roll_RA | 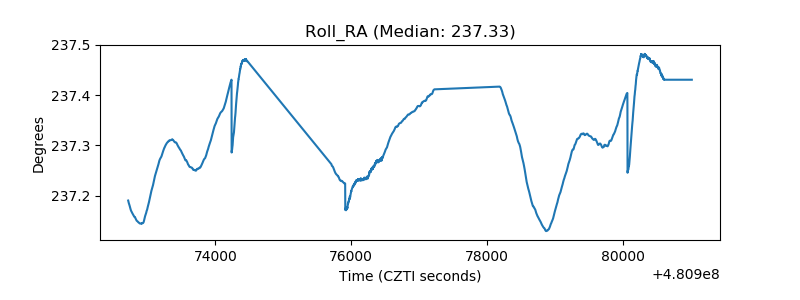 |
| Veto Counter | 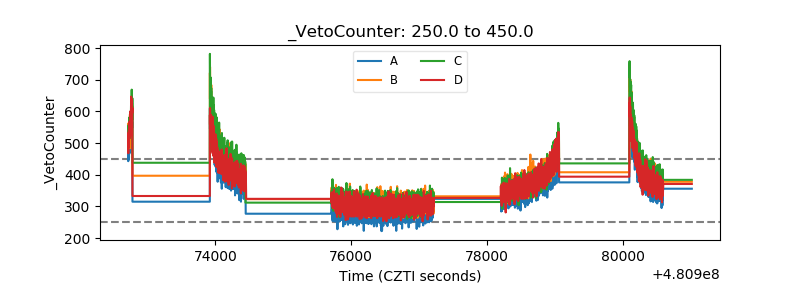 |