| Param | Original file | Final file |
|---|---|---|
| Filename | modeM0/AS1C07_001T03_9000006456_51396cztM0_level2.fits | modeM0/AS1C07_001T03_9000006456_51396cztM0_level2_quad_clean.evt |
| Size (bytes) | 300,006,720 | 26,314,560 |
| Size | 286.1 MB | 25.1 MB |
| Events in quadrant A | 3,135,063 | 172,732 |
| Events in quadrant B | 1,340,479 | 222,340 |
| Events in quadrant C | 4,805,117 | 51,941 |
| Events in quadrant D | 1,638,403 | 178,761 |
| Mode SS | |||
|---|---|---|---|
| Quadrant | BADHDUFLAG | Total packets | Discarded packets |
| A | 0 | 58 | 10 |
| B | 0 | 59 | 9 |
| C | 0 | 63 | 13 |
| D | 0 | 54 | 4 |
| Mode M0 | |||
|---|---|---|---|
| Quadrant | BADHDUFLAG | Total packets | Discarded packets |
| A | 0 | 12081 | 1060 |
| B | 0 | 6356 | 674 |
| C | 0 | 17298 | 1402 |
| D | 0 | 7306 | 547 |
| Mode M9 | |||
|---|---|---|---|
| Quadrant | BADHDUFLAG | Total packets | Discarded packets |
| A | 0 | 14 | 6 |
| B | 0 | 12 | 4 |
| C | 0 | 15 | 7 |
| D | 0 | 14 | 6 |
| Quadrant | Total seconds | Saturated seconds | Saturation percentage |
|---|---|---|---|
| A | 2384 | 446 | 18.708054% |
| B | 2388 | 60 | 2.512563% |
| C | 2355 | 1590 | 67.515924% |
| D | 2381 | 138 | 5.795884% |
Noise dominated data is calculated using 1-second bins in cleaned event files. If a bin has >2000 counts, and if more than 50% of those come from <1% of pixels, then it is considered to be noise-dominated and hence unusable.
| Quadrant | # 1 sec bins | Bins with >0 counts | Bins with >2000 counts | High rate bins dominated by noise | Noise dominated (total time) | Noise dominated (detector-on time) | Marked lightcurve |
|---|---|---|---|---|---|---|---|
| A | 4252 | 2396 | 410 | 410 | 9.64% | 17.11% | 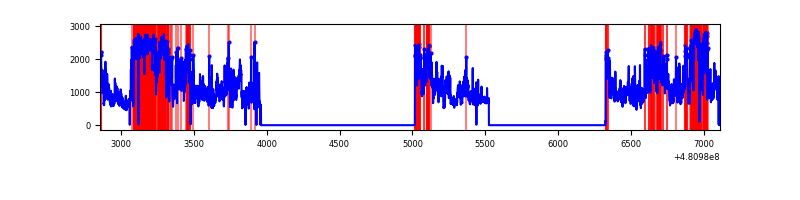 |
| B | 4253 | 2404 | 37 | 37 | 0.87% | 1.54% | 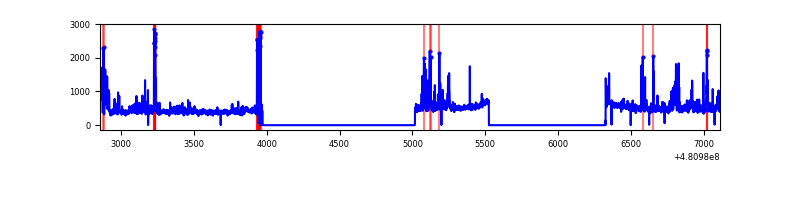 |
| C | 4248 | 2391 | 1580 | 1580 | 37.19% | 66.08% | 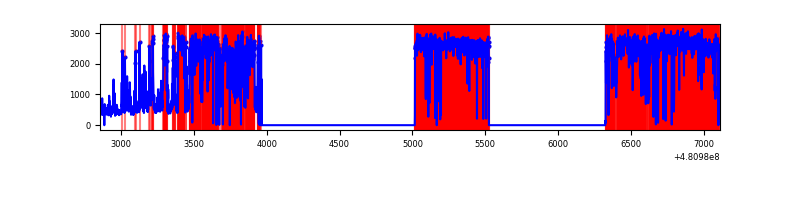 |
| D | 4253 | 2399 | 119 | 119 | 2.80% | 4.96% | 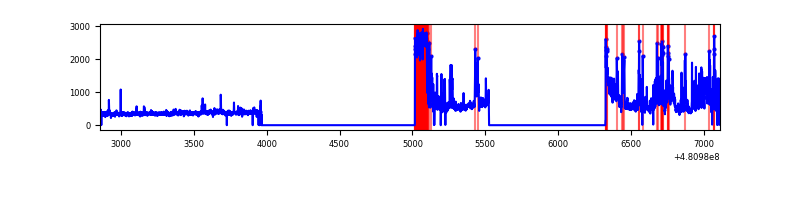 |
Top three noisy pixels from each quadrant. If the there are fewer than three noisy pixels in the level2.evt file, extra rows are filled as -1
| Pixel properties | Quadrant properties | ||||||
|---|---|---|---|---|---|---|---|
| Quadrant | DetID | PixID | Counts | Sigma | Mean | Median | Sigma |
| A | 12 | 3 | 882959 | 14228.42 | 243 | 237 | 62.0 |
| A | 12 | 250 | 493901 | 7957.27 | 243 | 237 | 62.0 |
| A | 15 | 174 | 256782 | 4135.2 | 243 | 237 | 62.0 |
| B | 5 | 185 | 156414 | 2761.38 | 257 | 248 | 56.6 |
| B | 4 | 81 | 58235 | 1025.35 | 257 | 248 | 56.6 |
| B | 1 | 223 | 18779 | 327.67 | 257 | 248 | 56.6 |
| C | 4 | 12 | 3578494 | 106475.37 | 117 | 116 | 33.6 |
| C | 15 | 179 | 401913 | 11955.55 | 117 | 116 | 33.6 |
| C | 4 | 5 | 164323 | 4886.01 | 117 | 116 | 33.6 |
| D | 10 | 172 | 261493 | 3839.74 | 243 | 234 | 68.0 |
| D | 11 | 176 | 233181 | 3423.64 | 243 | 234 | 68.0 |
| D | 2 | 153 | 39136 | 571.75 | 243 | 234 | 68.0 |
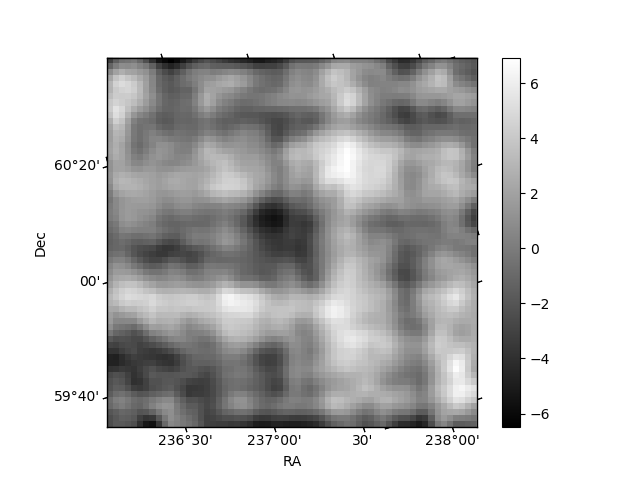
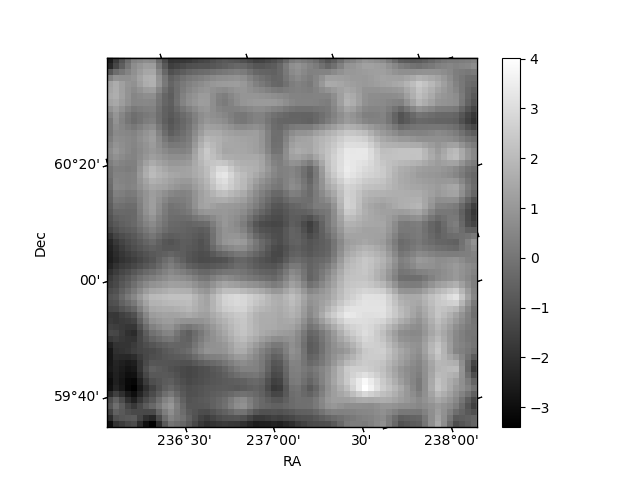
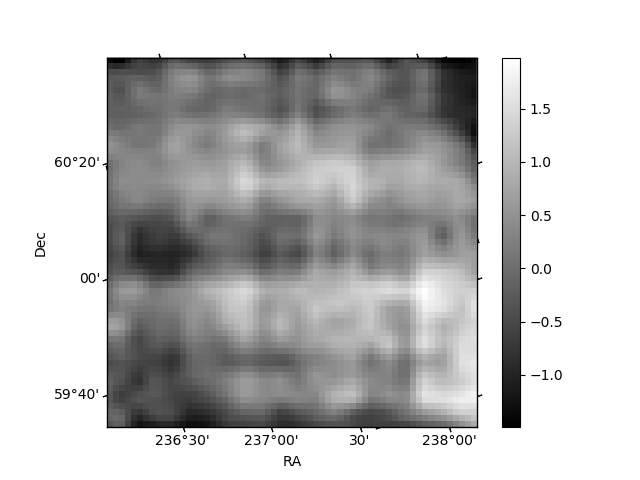
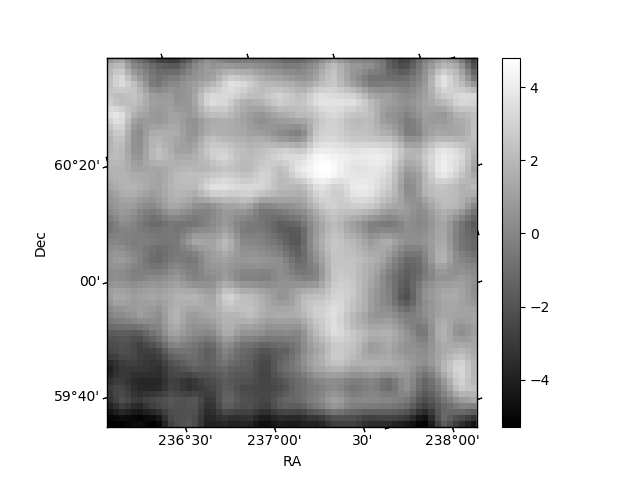
Histogram calculated using DETX and DETY for each event in the final _common_clean file
| Quadrant A | 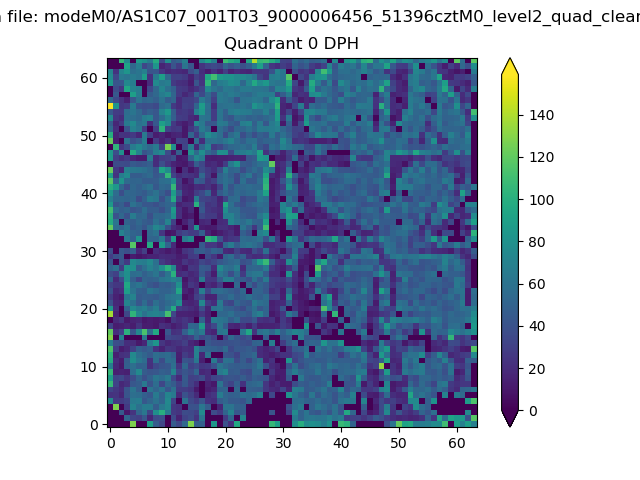 |
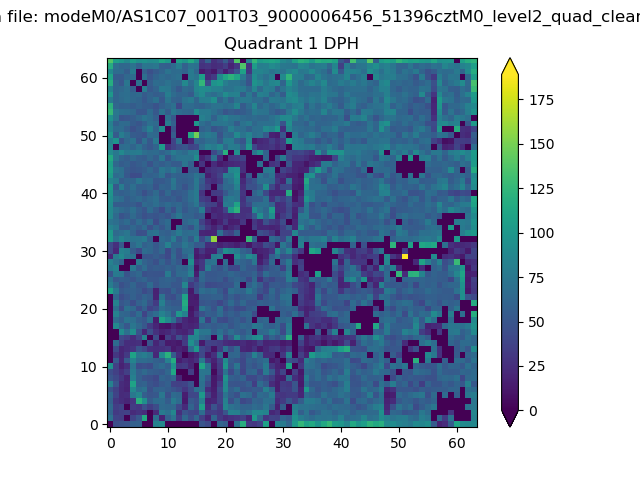 |
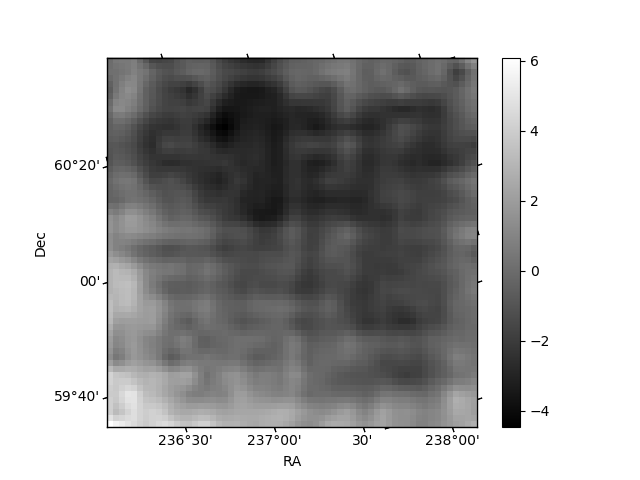
Quadrant B |
|---|---|---|---|
| Quadrant D | 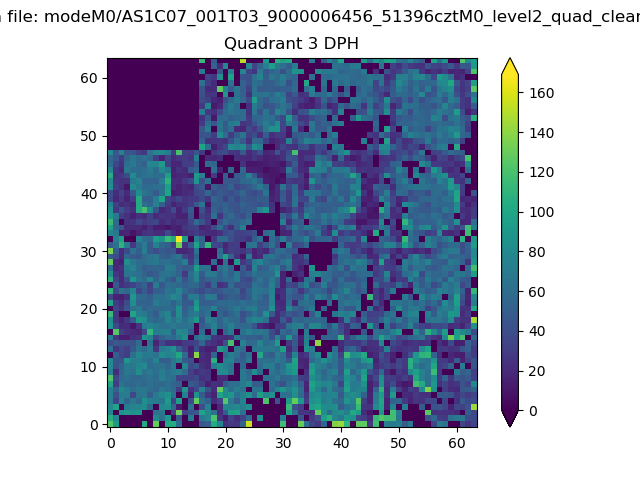 |
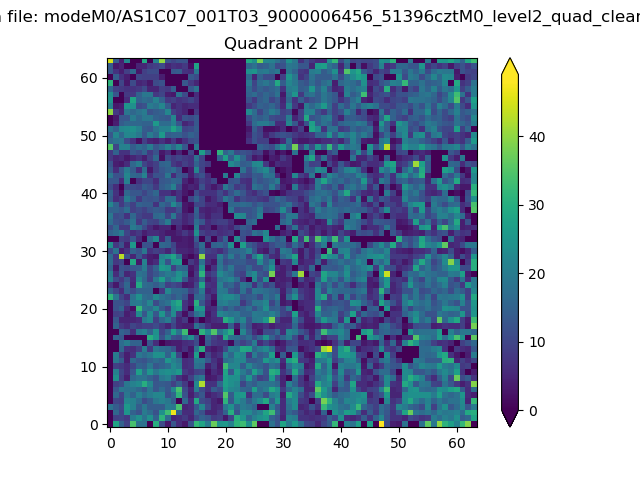 |
Quadrant C |
| Plot type | Count rate plots | Images |
|---|---|---|
| Comparison with Poisson distribution Blue bars denote a histogram of data divided into 1 sec bins. Red curve is a Poisson curve with rate = median count rate of data. |
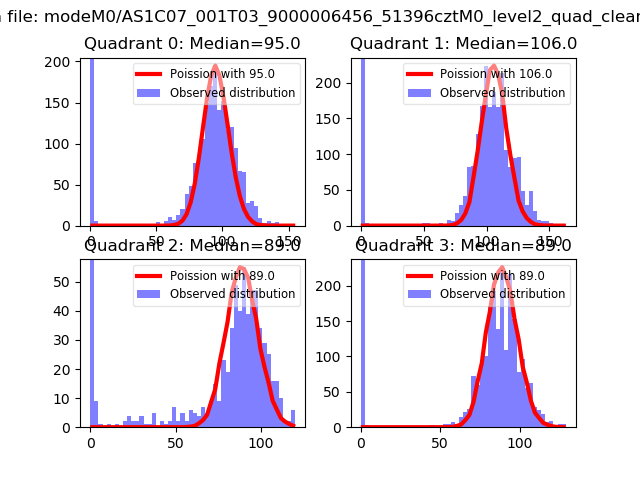 |
 |
| Quadrant-wise count rates Data is divided into 100 sec bins |
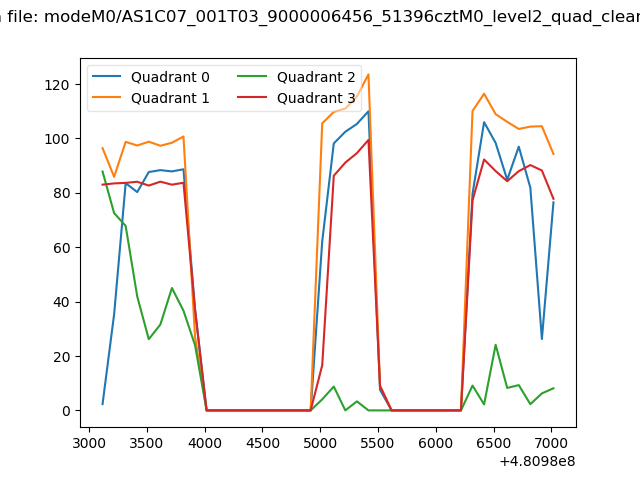 |
|
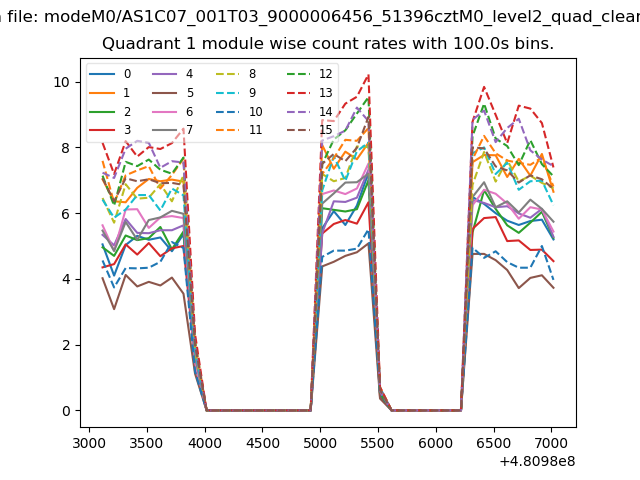
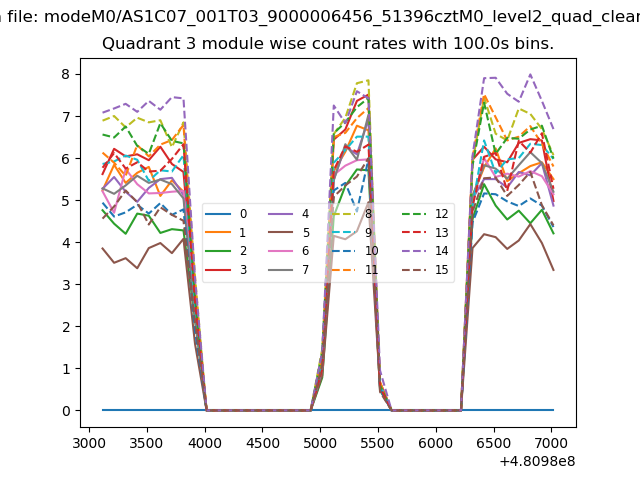
| Module-wise count rates for Quadrant A Data is divided into 100 sec bins |
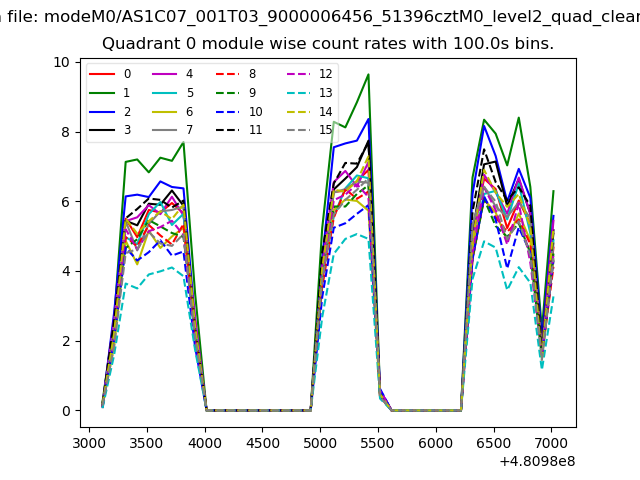 |
 |
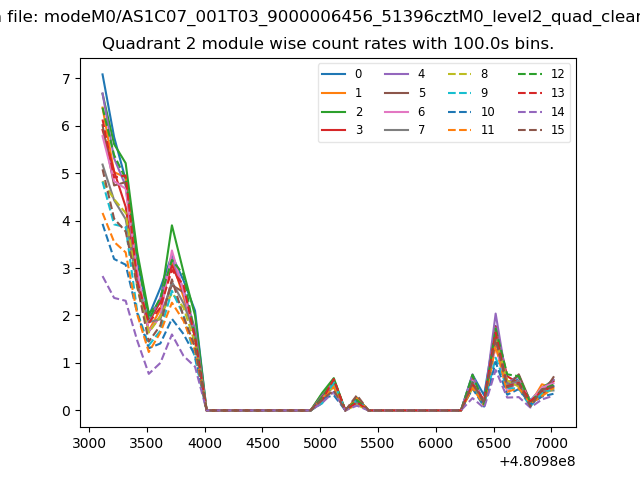
| Module-wise count rates for Quadrant B Data is divided into 100 sec bins |
 |
 |
| Module-wise count rates for Quadrant C Data is divided into 100 sec bins |
 |
 |
| Module-wise count rates for Quadrant D Data is divided into 100 sec bins |
 |
 |
| Parameter | Plot |
|---|---|
| CZT HV Monitor | 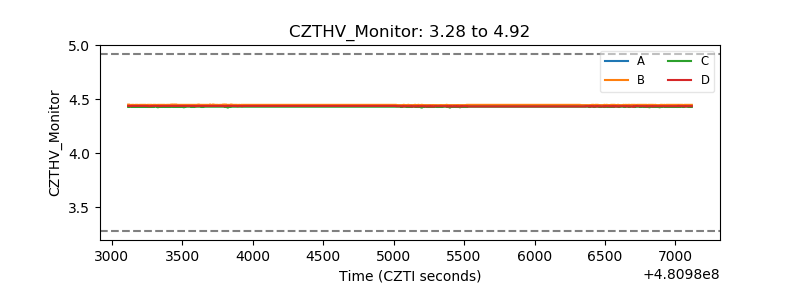 |
| D_VDD | 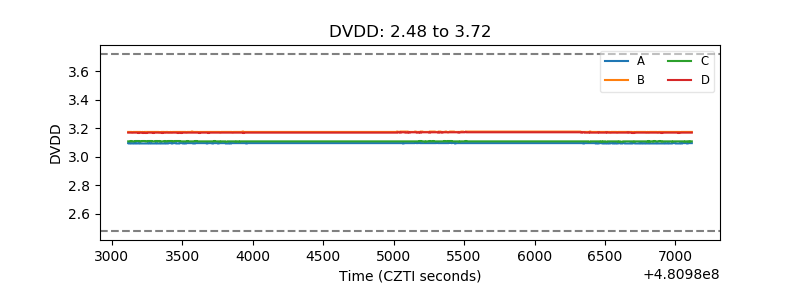 |
| Temperature 1 | 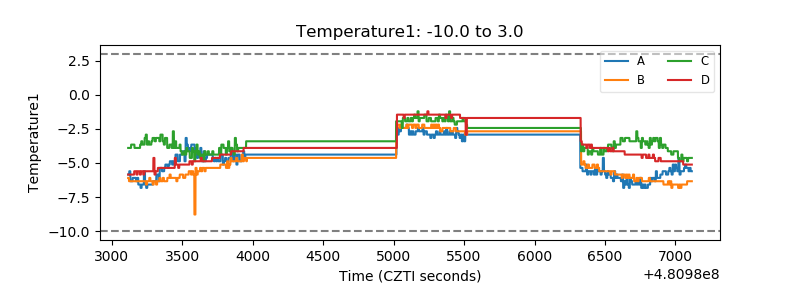 |
| Veto HV Monitor | 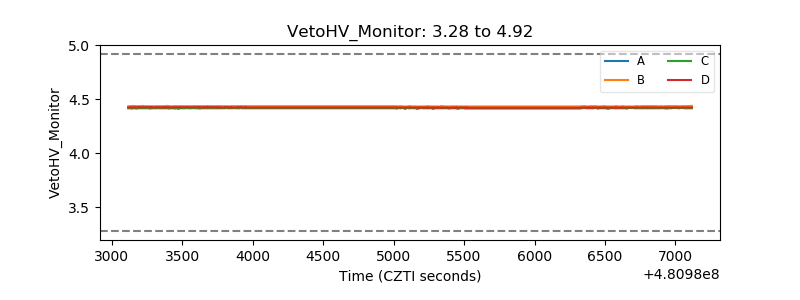 |
| Veto LLD | 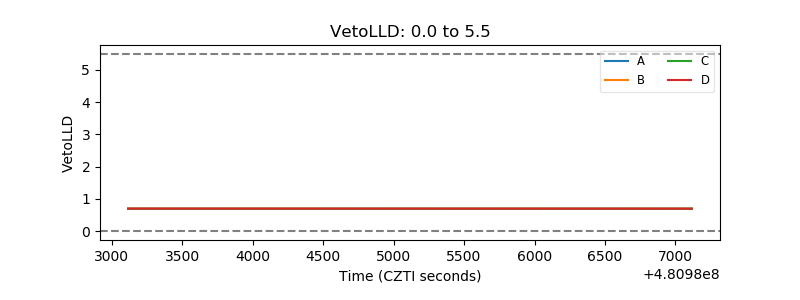 |
| Alpha Counter | 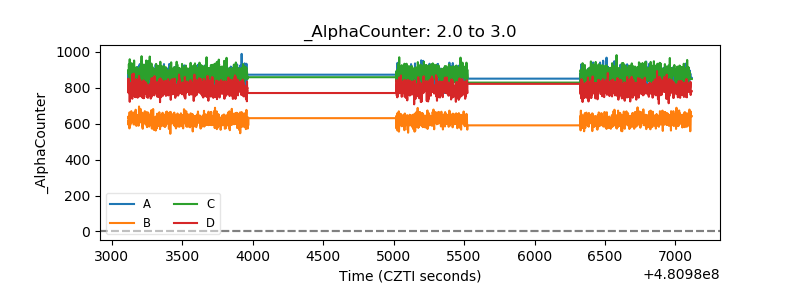 |
| _CPM_Rate | 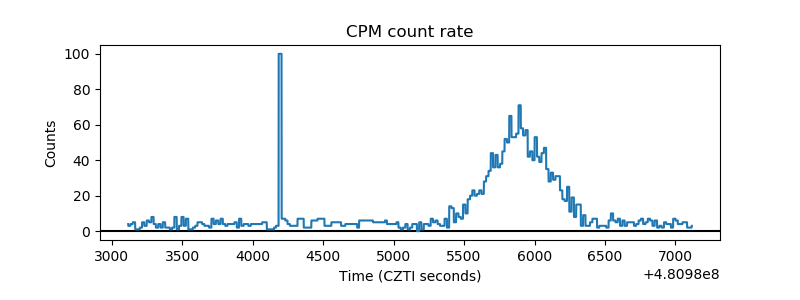 |
| CZT Counter | 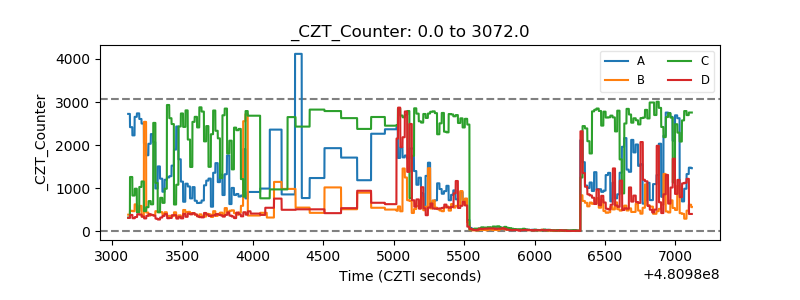 |
| +2.5 Volts monitor | 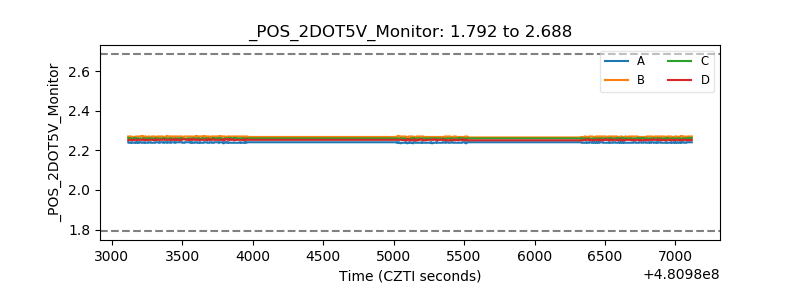 |
| +5 Volts monitor | 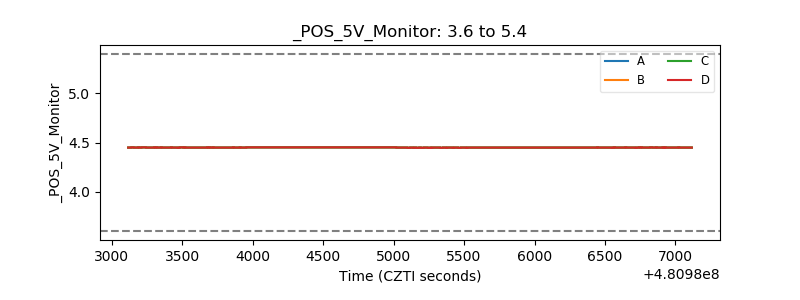 |
| _ROLL_ROT | 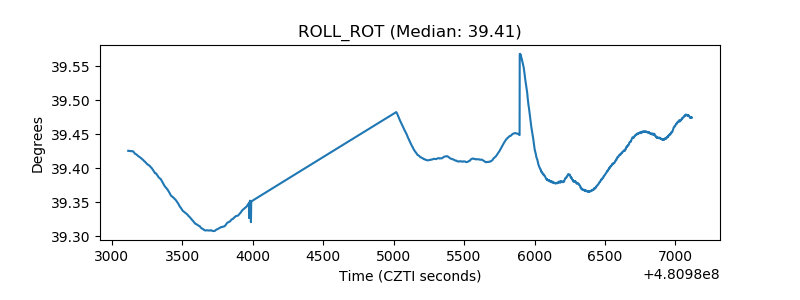 |
| _Roll_DEC | 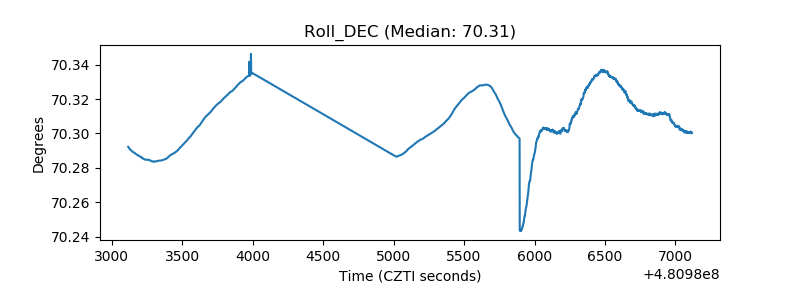 |
| _Roll_RA | 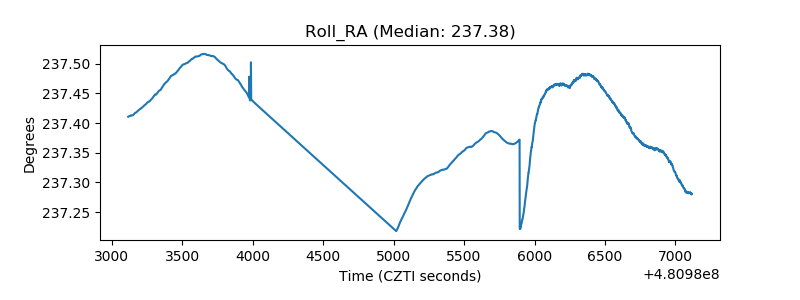 |
| Veto Counter | 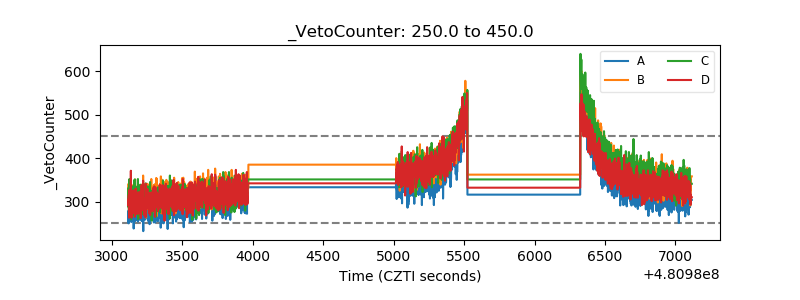 |