| Param | Original file | Final file |
|---|---|---|
| Filename | modeM0/AS1C07_001T03_9000006456_51397cztM0_level2.fits | modeM0/AS1C07_001T03_9000006456_51397cztM0_level2_quad_clean.evt |
| Size (bytes) | 838,684,800 | 95,114,880 |
| Size | 799.8 MB | 90.7 MB |
| Events in quadrant A | 8,533,337 | 638,053 |
| Events in quadrant B | 4,678,376 | 746,654 |
| Events in quadrant C | 12,682,038 | 370,910 |
| Events in quadrant D | 4,580,889 | 610,213 |
| Mode SS | |||
|---|---|---|---|
| Quadrant | BADHDUFLAG | Total packets | Discarded packets |
| A | 0 | 148 | 0 |
| B | 0 | 148 | 0 |
| C | 0 | 148 | 0 |
| D | 0 | 148 | 0 |
| Mode M0 | |||
|---|---|---|---|
| Quadrant | BADHDUFLAG | Total packets | Discarded packets |
| A | 0 | 30637 | 1 |
| B | 0 | 19006 | 1 |
| C | 0 | 42764 | 1 |
| D | 0 | 19174 | 1 |
| Quadrant | Total seconds | Saturated seconds | Saturation percentage |
|---|---|---|---|
| A | 7380 | 670 | 9.078591% |
| B | 7380 | 231 | 3.130081% |
| C | 7381 | 3623 | 49.085490% |
| D | 7381 | 335 | 4.538680% |
Noise dominated data is calculated using 1-second bins in cleaned event files. If a bin has >2000 counts, and if more than 50% of those come from <1% of pixels, then it is considered to be noise-dominated and hence unusable.
| Quadrant | # 1 sec bins | Bins with >0 counts | Bins with >2000 counts | High rate bins dominated by noise | Noise dominated (total time) | Noise dominated (detector-on time) | Marked lightcurve |
|---|---|---|---|---|---|---|---|
| A | 7410 | 7381 | 521 | 521 | 7.03% | 7.06% | 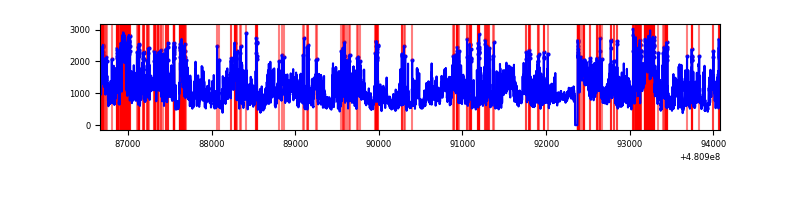 |
| B | 7410 | 7381 | 135 | 135 | 1.82% | 1.83% | 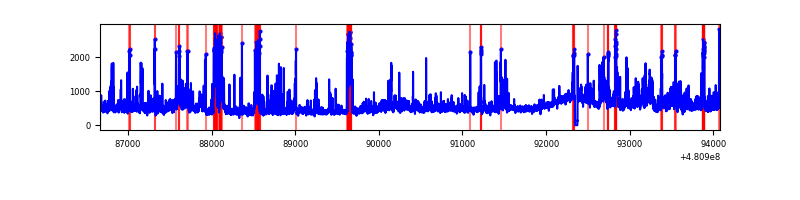 |
| C | 7411 | 7382 | 3447 | 3447 | 46.51% | 46.69% | 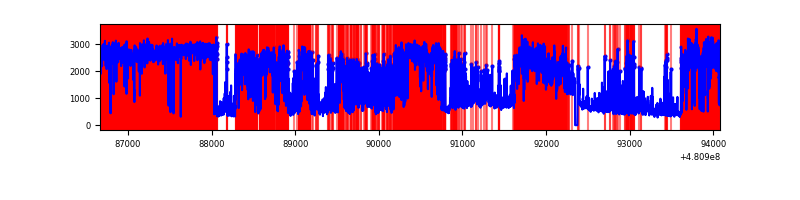 |
| D | 7411 | 7382 | 289 | 289 | 3.90% | 3.91% | 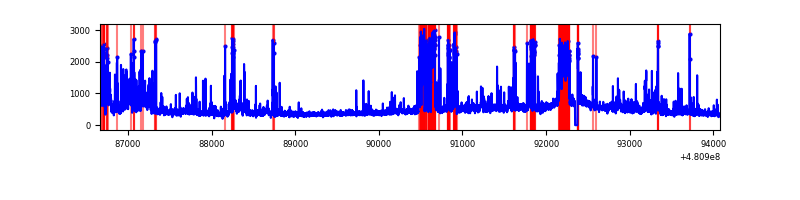 |
Top three noisy pixels from each quadrant. If the there are fewer than three noisy pixels in the level2.evt file, extra rows are filled as -1
| Pixel properties | Quadrant properties | ||||||
|---|---|---|---|---|---|---|---|
| Quadrant | DetID | PixID | Counts | Sigma | Mean | Median | Sigma |
| A | 12 | 3 | 3090789 | 16653.51 | 753 | 735 | 185.5 |
| A | 15 | 174 | 732637 | 3944.51 | 753 | 735 | 185.5 |
| A | 4 | 175 | 560012 | 3014.16 | 753 | 735 | 185.5 |
| B | 5 | 185 | 362974 | 2174.16 | 780 | 749 | 166.6 |
| B | 10 | 254 | 359292 | 2152.06 | 780 | 749 | 166.6 |
| B | 5 | 172 | 146499 | 874.82 | 780 | 749 | 166.6 |
| C | 4 | 12 | 6677691 | 45040.38 | 537 | 531 | 148.2 |
| C | 15 | 179 | 1413121 | 9528.54 | 537 | 531 | 148.2 |
| C | 15 | 205 | 924607 | 6233.3 | 537 | 531 | 148.2 |
| D | 10 | 172 | 734284 | 3518.25 | 740 | 712 | 208.5 |
| D | 11 | 176 | 405120 | 1939.56 | 740 | 712 | 208.5 |
| D | 8 | 176 | 160978 | 768.65 | 740 | 712 | 208.5 |
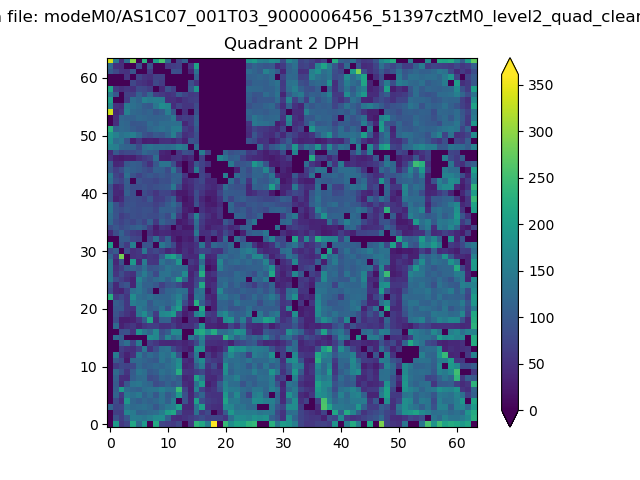
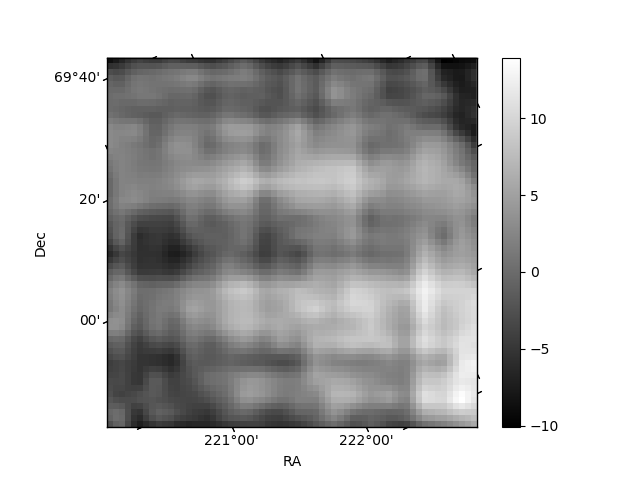
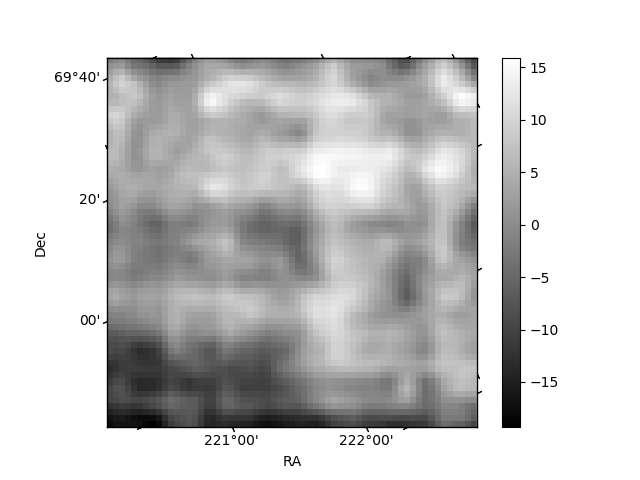
Histogram calculated using DETX and DETY for each event in the final _common_clean file
| Quadrant A | 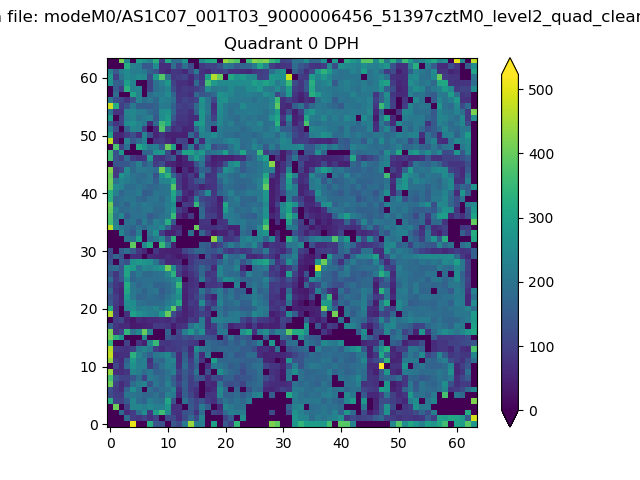 |
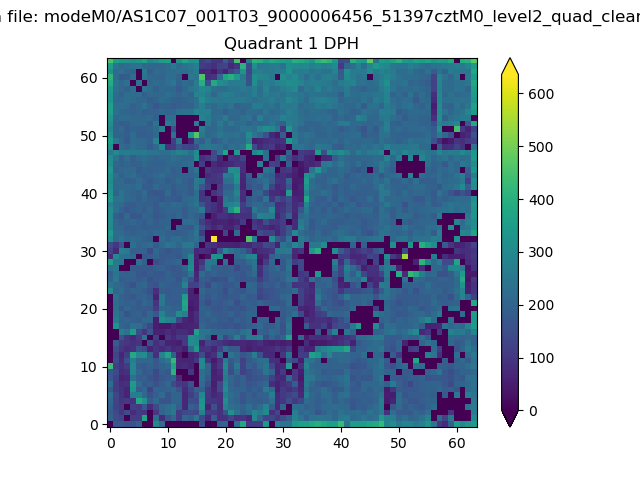 |
Quadrant B |
|---|---|---|---|
| Quadrant D | 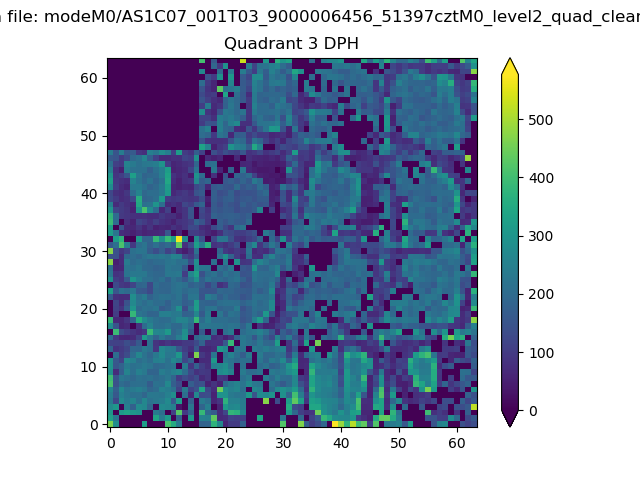 |
 |
Quadrant C |
| Plot type | Count rate plots | Images |
|---|---|---|
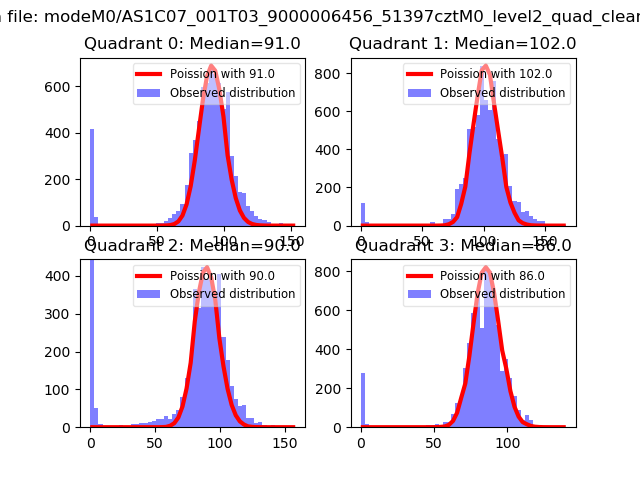
| Comparison with Poisson distribution Blue bars denote a histogram of data divided into 1 sec bins. Red curve is a Poisson curve with rate = median count rate of data. |
 |
 |
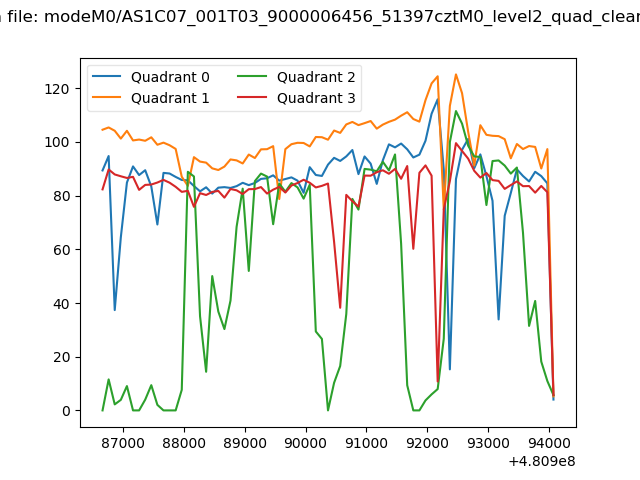
| Quadrant-wise count rates Data is divided into 100 sec bins |
 |
|
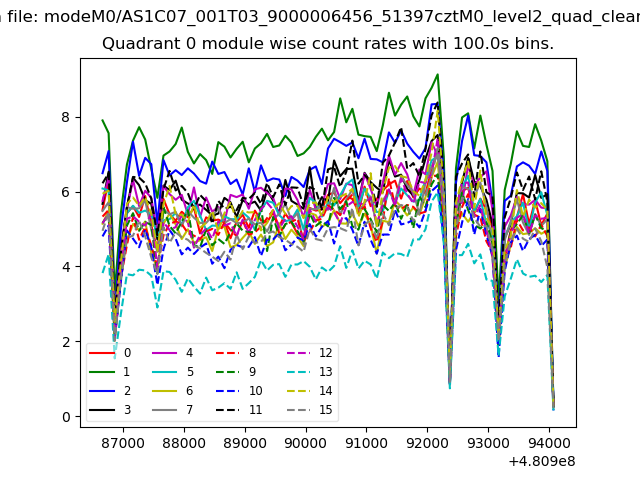
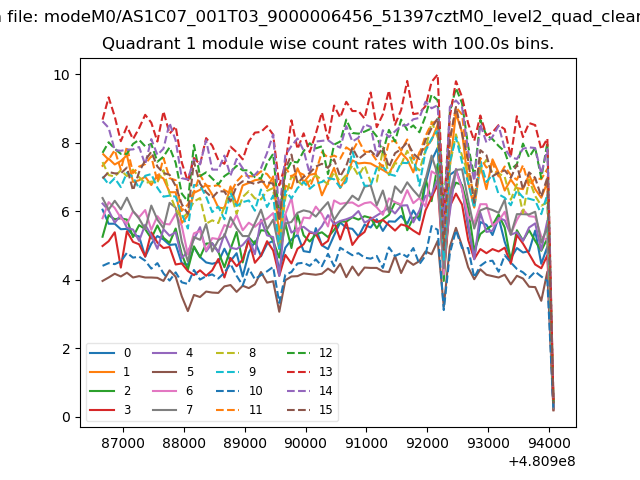
| Module-wise count rates for Quadrant A Data is divided into 100 sec bins |
 |
 |
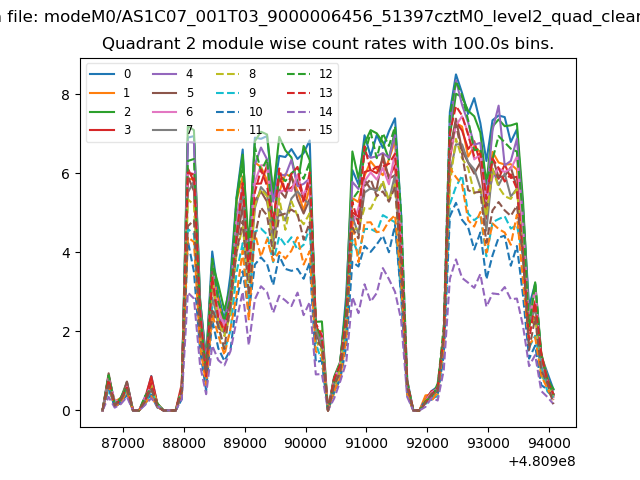
| Module-wise count rates for Quadrant B Data is divided into 100 sec bins |
 |
 |
| Module-wise count rates for Quadrant C Data is divided into 100 sec bins |
 |
 |
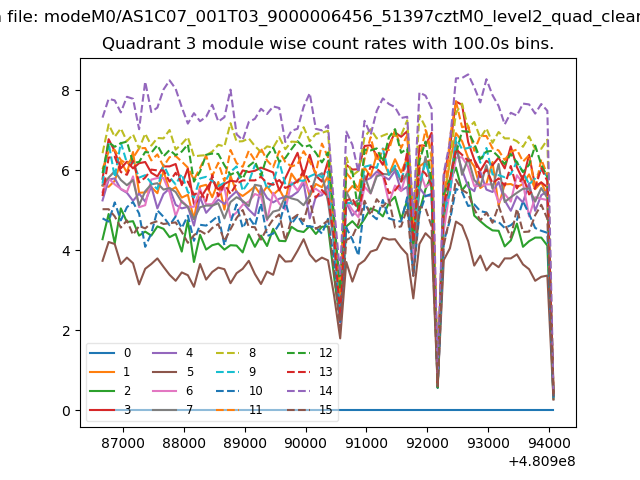
| Module-wise count rates for Quadrant D Data is divided into 100 sec bins |
 |
 |
| Parameter | Plot |
|---|---|
| CZT HV Monitor | 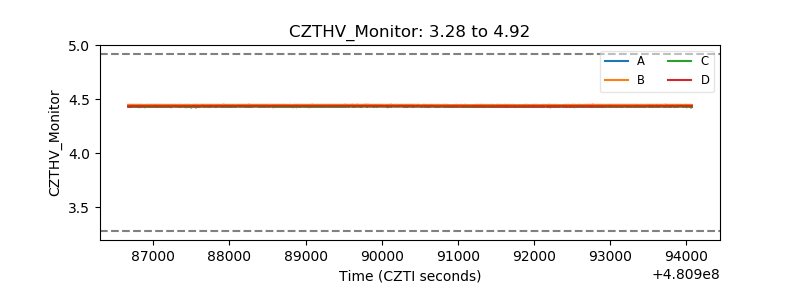 |
| D_VDD | 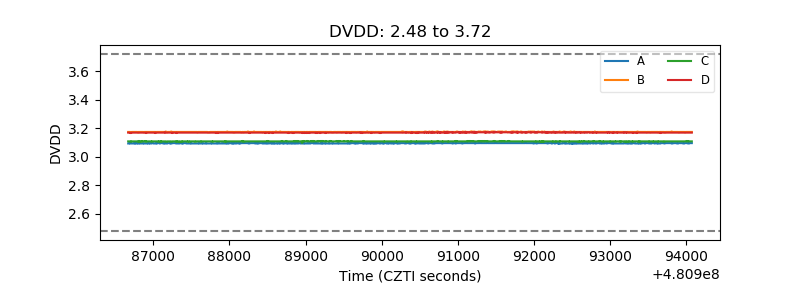 |
| Temperature 1 | 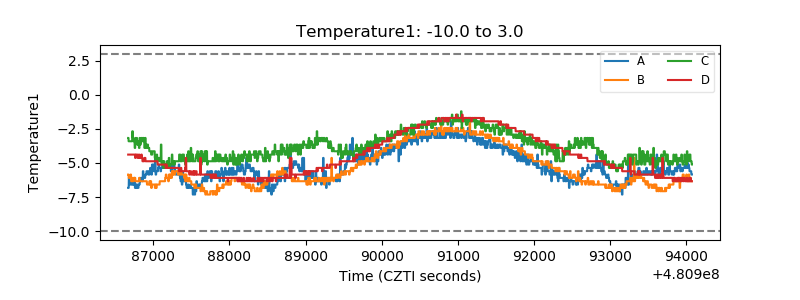 |
| Veto HV Monitor |  |
| Veto LLD | 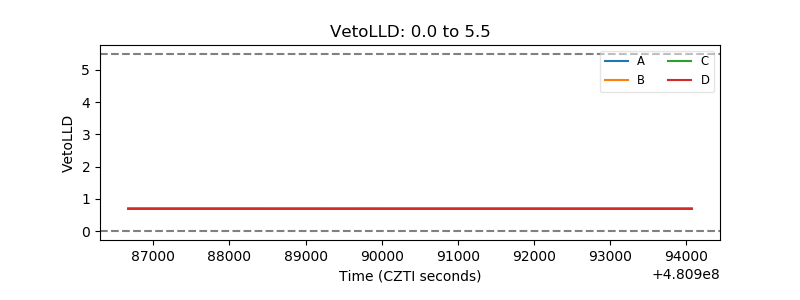 |
| Alpha Counter | 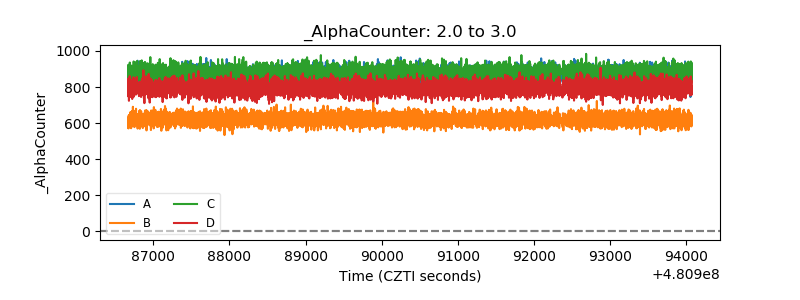 |
| _CPM_Rate | 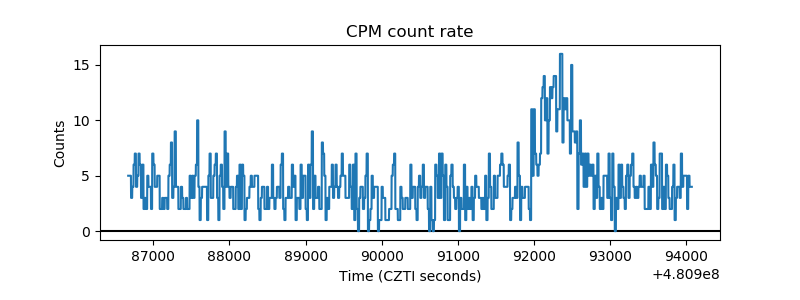 |
| CZT Counter | 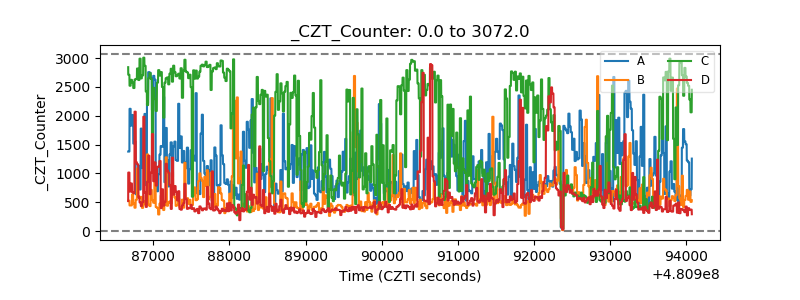 |
| +2.5 Volts monitor | 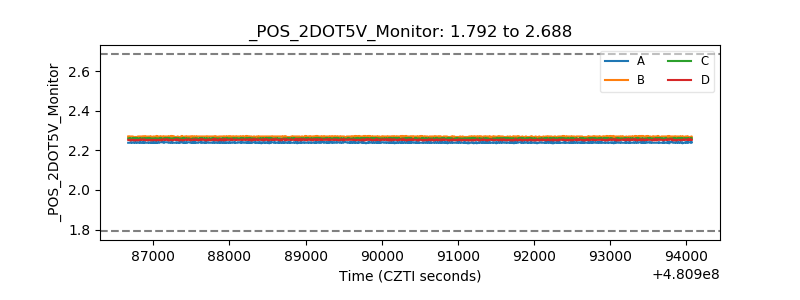 |
| +5 Volts monitor | 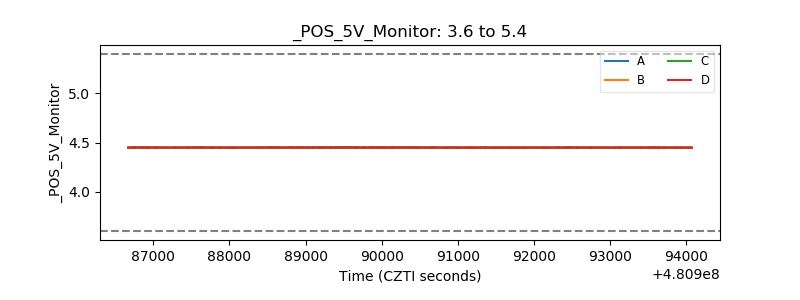 |
| _ROLL_ROT | 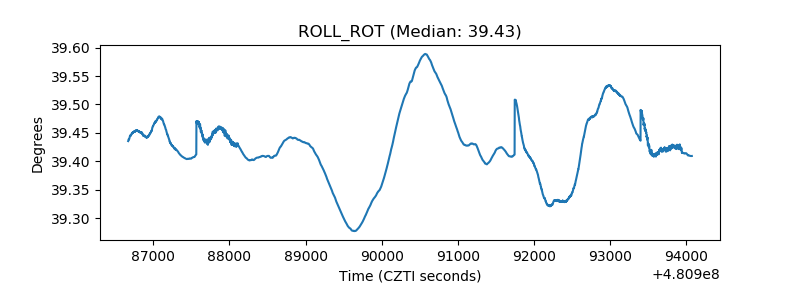 |
| _Roll_DEC | 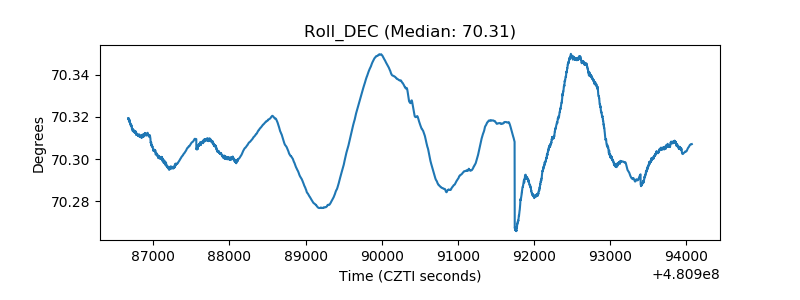 |
| _Roll_RA | 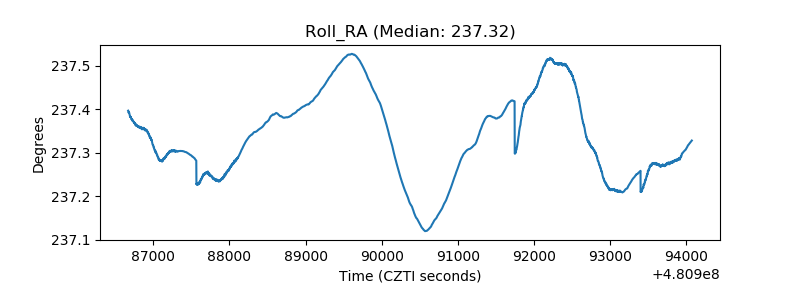 |
| Veto Counter | 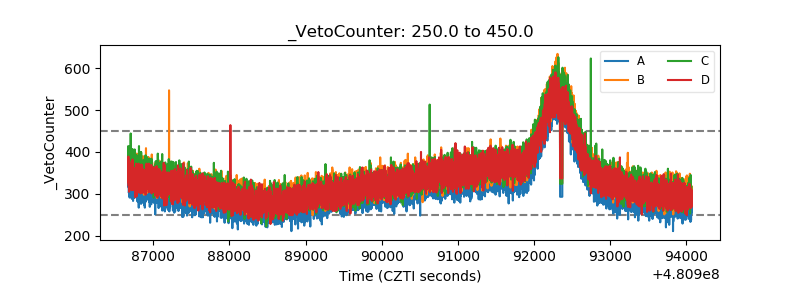 |