| Param | Original file | Final file |
|---|---|---|
| Filename | modeM0/AS1C07_001T03_9000006456_51398cztM0_level2.fits | modeM0/AS1C07_001T03_9000006456_51398cztM0_level2_quad_clean.evt |
| Size (bytes) | 941,618,880 | 100,733,760 |
| Size | 898.0 MB | 96.1 MB |
| Events in quadrant A | 10,415,471 | 635,106 |
| Events in quadrant B | 4,679,649 | 824,509 |
| Events in quadrant C | 14,660,568 | 336,021 |
| Events in quadrant D | 4,467,374 | 686,090 |
| Mode SS | |||
|---|---|---|---|
| Quadrant | BADHDUFLAG | Total packets | Discarded packets |
| A | 0 | 164 | 0 |
| B | 0 | 164 | 0 |
| C | 0 | 164 | 0 |
| D | 0 | 164 | 0 |
| Mode M0 | |||
|---|---|---|---|
| Quadrant | BADHDUFLAG | Total packets | Discarded packets |
| A | 0 | 36753 | 1 |
| B | 0 | 19802 | 1 |
| C | 0 | 49127 | 1 |
| D | 0 | 19314 | 1 |
| Quadrant | Total seconds | Saturated seconds | Saturation percentage |
|---|---|---|---|
| A | 8170 | 1517 | 18.567931% |
| B | 8171 | 175 | 2.141721% |
| C | 8171 | 4951 | 60.592339% |
| D | 8171 | 176 | 2.153959% |
Noise dominated data is calculated using 1-second bins in cleaned event files. If a bin has >2000 counts, and if more than 50% of those come from <1% of pixels, then it is considered to be noise-dominated and hence unusable.
| Quadrant | # 1 sec bins | Bins with >0 counts | Bins with >2000 counts | High rate bins dominated by noise | Noise dominated (total time) | Noise dominated (detector-on time) | Marked lightcurve |
|---|---|---|---|---|---|---|---|
| A | 8200 | 8171 | 1262 | 1262 | 15.39% | 15.44% | 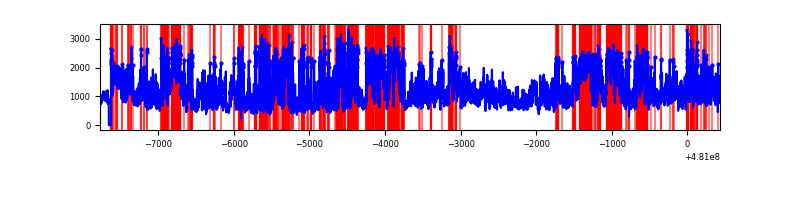 |
| B | 8201 | 8172 | 66 | 66 | 0.80% | 0.81% | 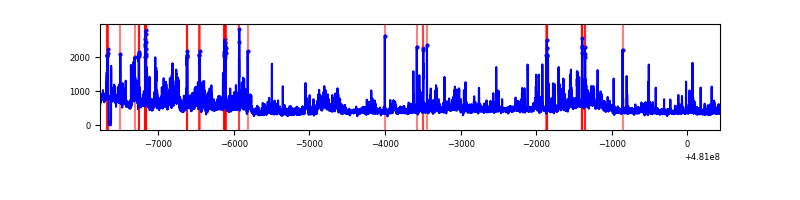 |
| C | 8201 | 8172 | 4178 | 4178 | 50.95% | 51.13% | 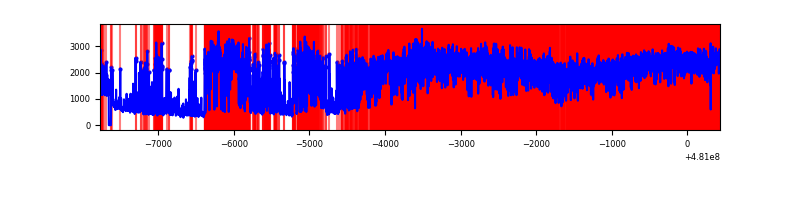 |
| D | 8201 | 8172 | 145 | 145 | 1.77% | 1.77% | 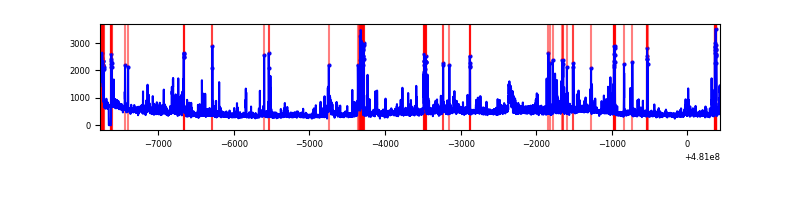 |
Top three noisy pixels from each quadrant. If the there are fewer than three noisy pixels in the level2.evt file, extra rows are filled as -1
| Pixel properties | Quadrant properties | ||||||
|---|---|---|---|---|---|---|---|
| Quadrant | DetID | PixID | Counts | Sigma | Mean | Median | Sigma |
| A | 12 | 3 | 3234887 | 16427.33 | 799 | 780 | 196.9 |
| A | 12 | 250 | 1248601 | 6338.19 | 799 | 780 | 196.9 |
| A | 15 | 174 | 895977 | 4547.07 | 799 | 780 | 196.9 |
| B | 10 | 254 | 290720 | 1588.42 | 859 | 829 | 182.5 |
| B | 5 | 172 | 158418 | 863.49 | 859 | 829 | 182.5 |
| B | 4 | 206 | 143256 | 780.41 | 859 | 829 | 182.5 |
| C | 15 | 179 | 7071695 | 40900.39 | 625 | 619 | 172.9 |
| C | 4 | 12 | 2105417 | 12174.53 | 625 | 619 | 172.9 |
| C | 4 | 5 | 763731 | 4413.98 | 625 | 619 | 172.9 |
| D | 2 | 153 | 188543 | 817.24 | 826 | 796 | 229.7 |
| D | 2 | 120 | 166603 | 721.74 | 826 | 796 | 229.7 |
| D | 11 | 176 | 162566 | 704.16 | 826 | 796 | 229.7 |
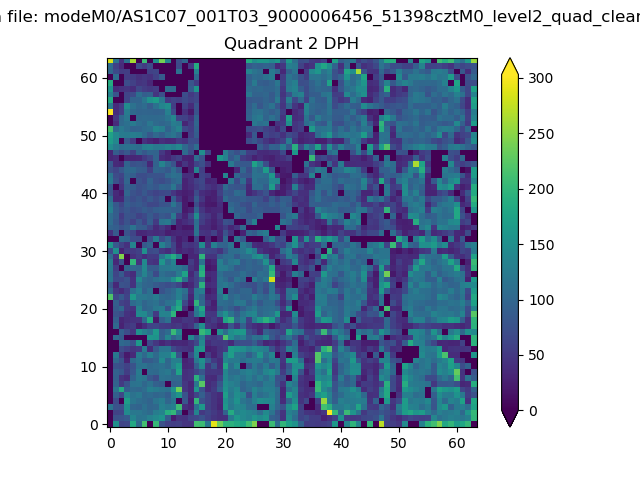
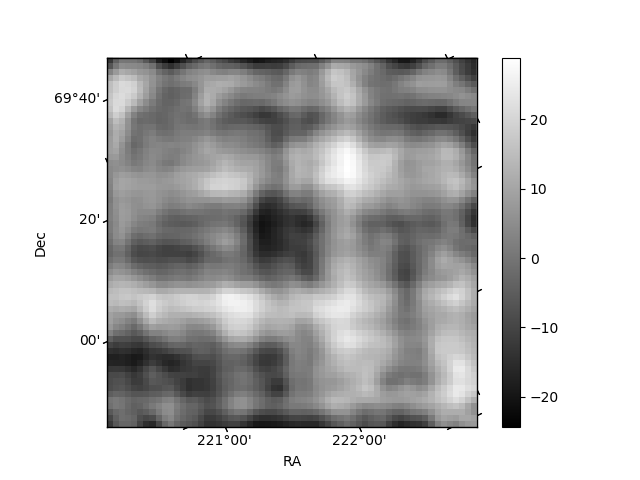
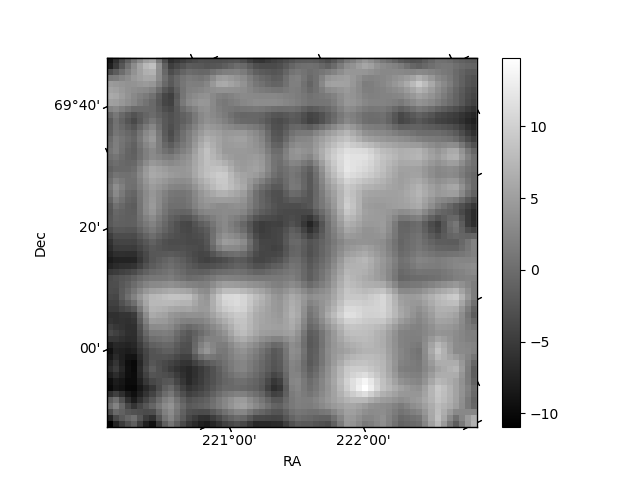
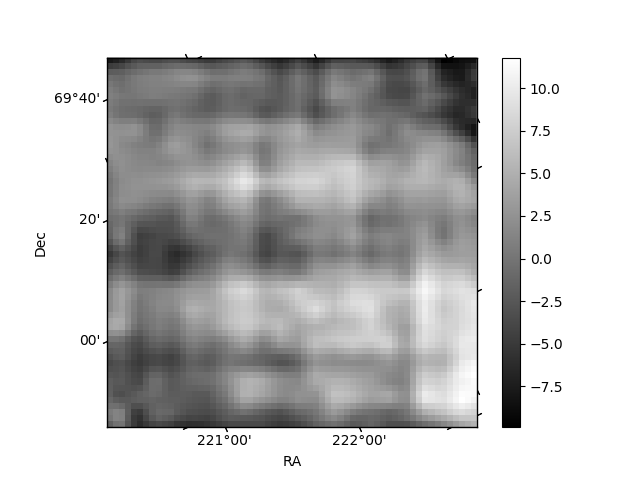
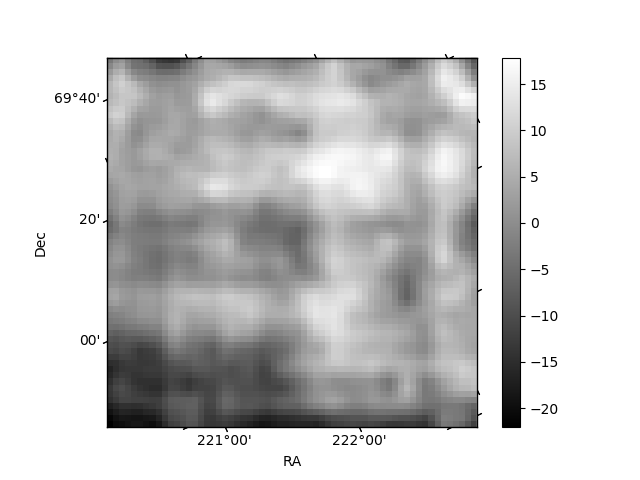
Histogram calculated using DETX and DETY for each event in the final _common_clean file
| Quadrant A | 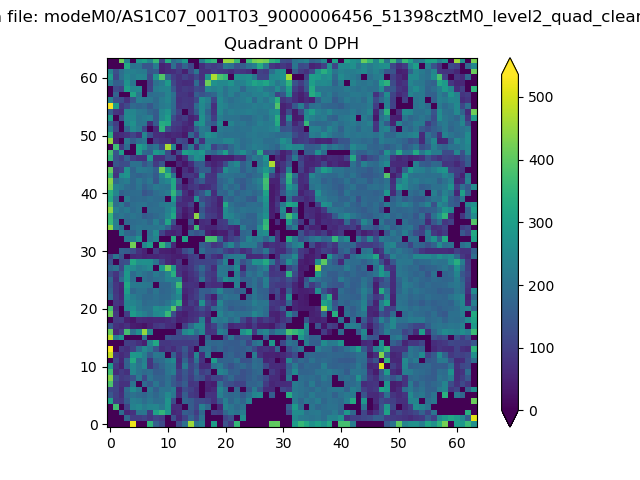 |
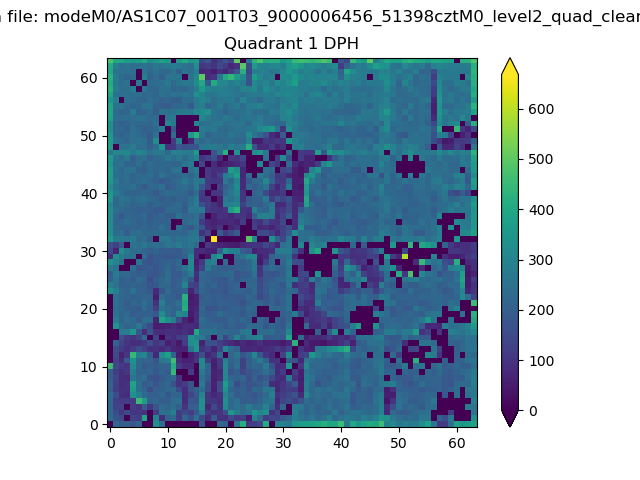 |
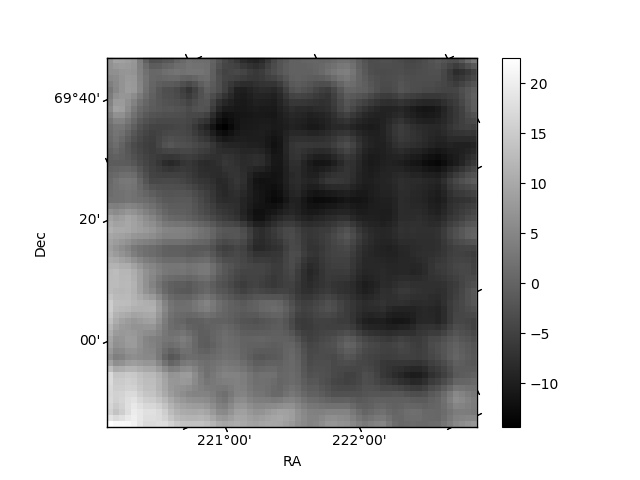
Quadrant B |
|---|---|---|---|
| Quadrant D | 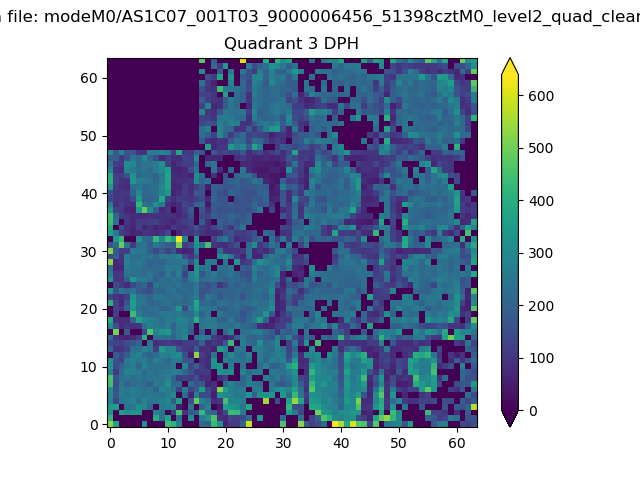 |
 |
Quadrant C |
| Plot type | Count rate plots | Images |
|---|---|---|
| Comparison with Poisson distribution Blue bars denote a histogram of data divided into 1 sec bins. Red curve is a Poisson curve with rate = median count rate of data. |
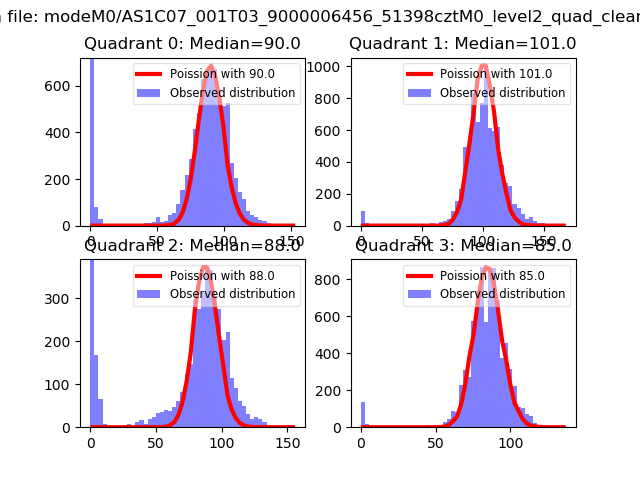 |
 |
| Quadrant-wise count rates Data is divided into 100 sec bins |
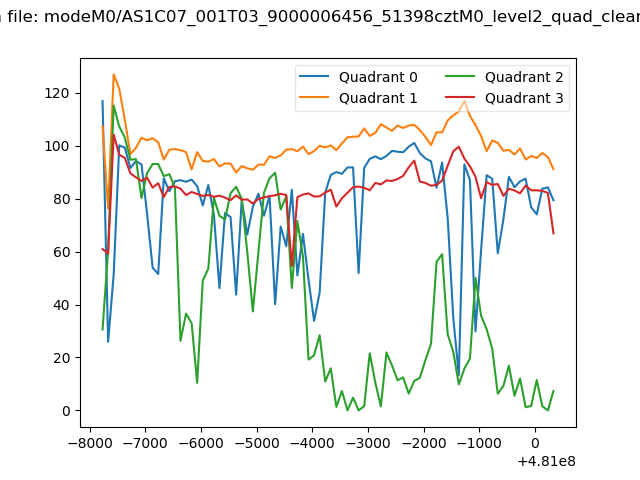 |
|
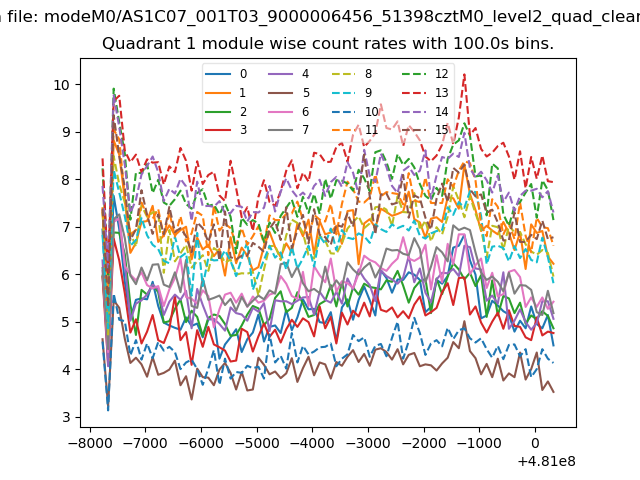
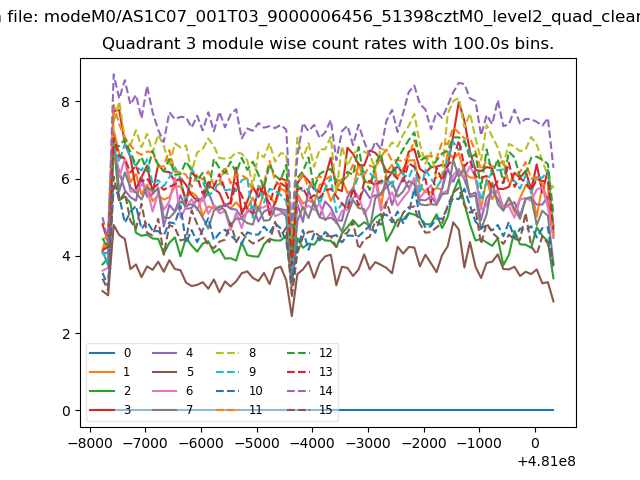
| Module-wise count rates for Quadrant A Data is divided into 100 sec bins |
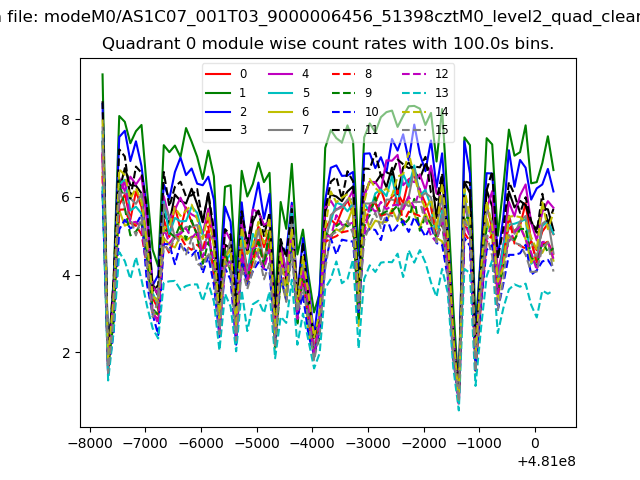 |
 |
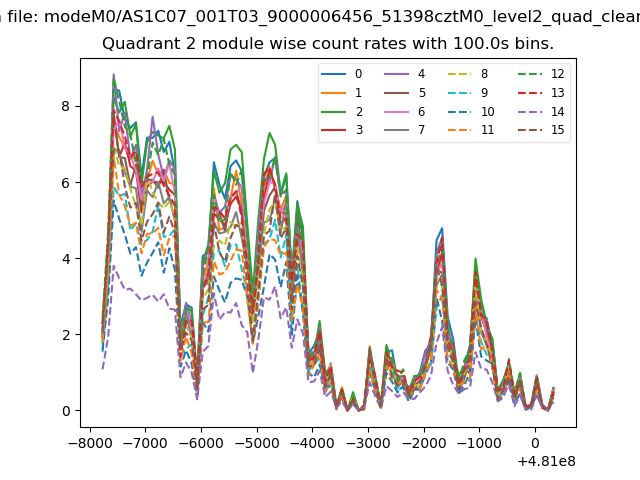
| Module-wise count rates for Quadrant B Data is divided into 100 sec bins |
 |
 |
| Module-wise count rates for Quadrant C Data is divided into 100 sec bins |
 |
 |
| Module-wise count rates for Quadrant D Data is divided into 100 sec bins |
 |
 |
| Parameter | Plot |
|---|---|
| CZT HV Monitor | 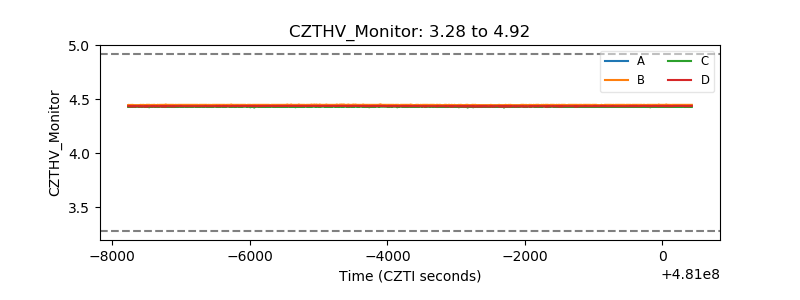 |
| D_VDD | 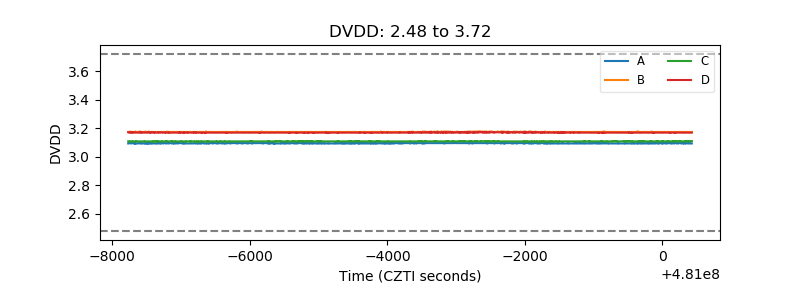 |
| Temperature 1 | 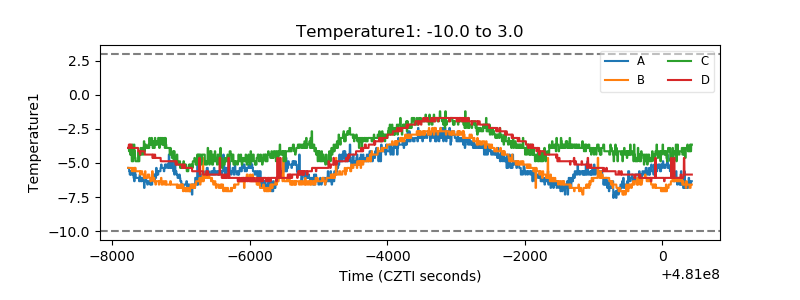 |
| Veto HV Monitor | 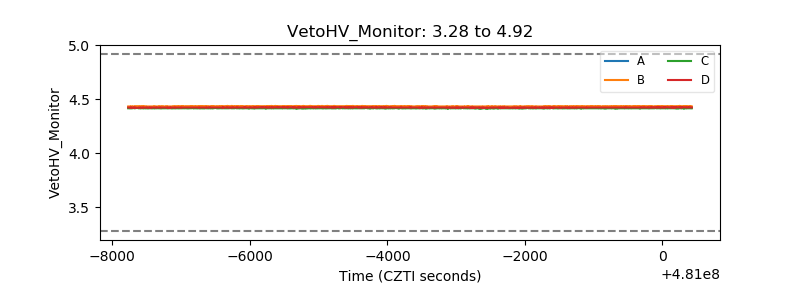 |
| Veto LLD | 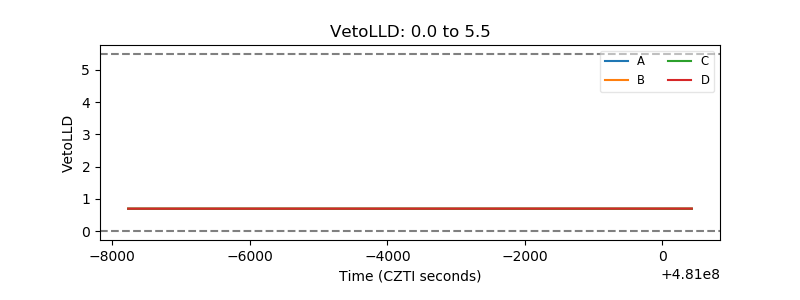 |
| Alpha Counter | 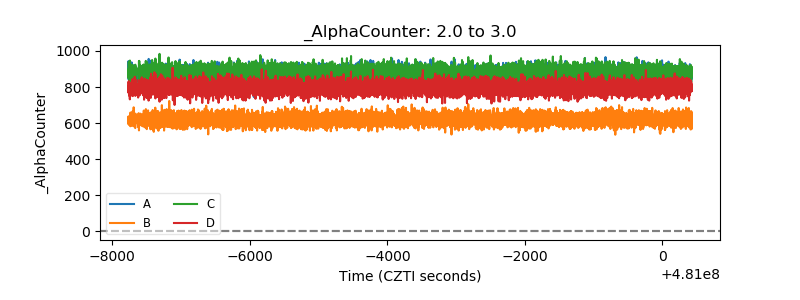 |
| _CPM_Rate | 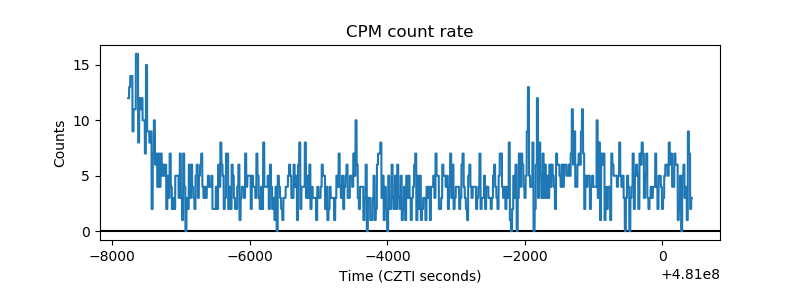 |
| CZT Counter | 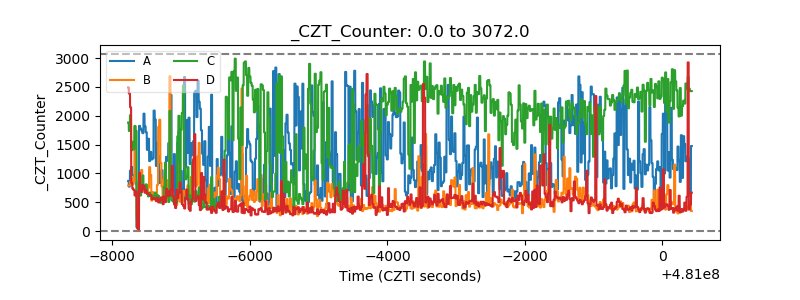 |
| +2.5 Volts monitor | 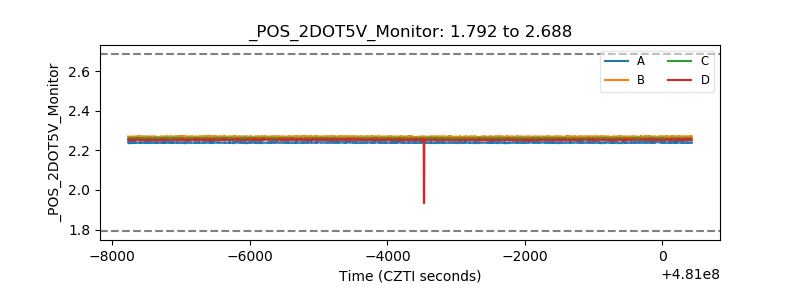 |
| +5 Volts monitor | 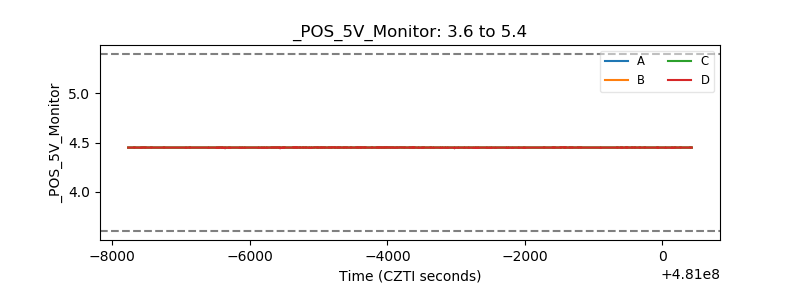 |
| _ROLL_ROT | 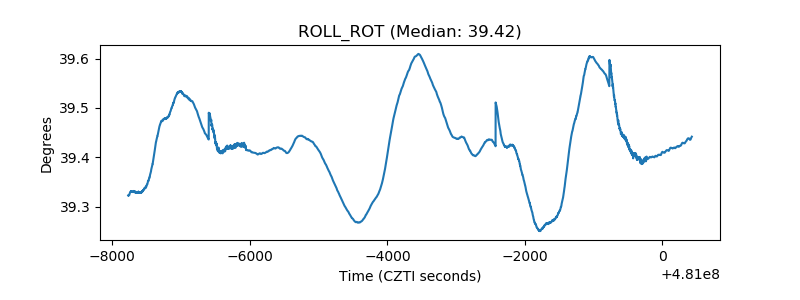 |
| _Roll_DEC | 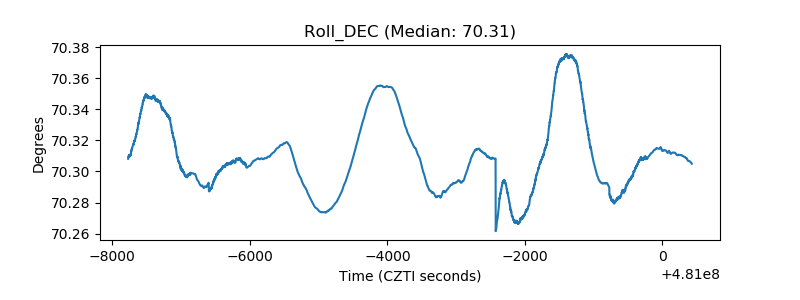 |
| _Roll_RA | 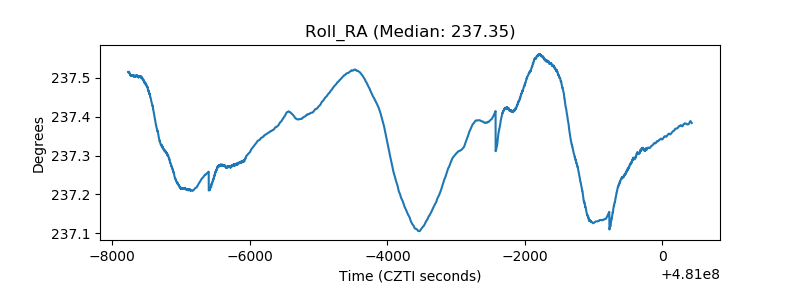 |
| Veto Counter | 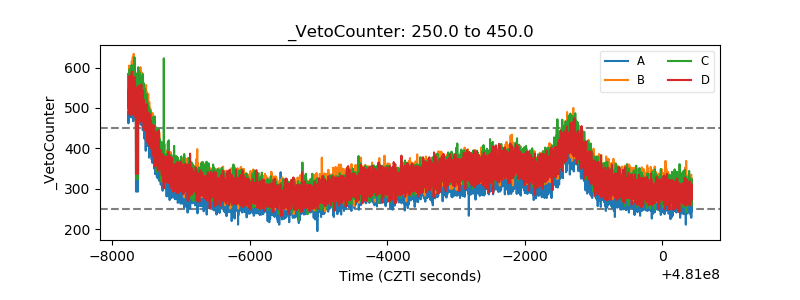 |