| Param | Original file | Final file |
|---|---|---|
| Filename | modeM0/AS1C07_001T03_9000006456_51402cztM0_level2.fits | modeM0/AS1C07_001T03_9000006456_51402cztM0_level2_quad_clean.evt |
| Size (bytes) | 2,372,382,720 | 208,805,760 |
| Size | 2.2 GB | 199.1 MB |
| Events in quadrant A | 22,671,387 | 1,402,107 |
| Events in quadrant B | 11,066,734 | 1,811,979 |
| Events in quadrant C | 36,541,815 | 433,457 |
| Events in quadrant D | 16,080,794 | 1,373,095 |
| Mode SS | |||
|---|---|---|---|
| Quadrant | BADHDUFLAG | Total packets | Discarded packets |
| A | 0 | 380 | 0 |
| B | 0 | 380 | 0 |
| C | 0 | 380 | 0 |
| D | 0 | 380 | 0 |
| Mode M0 | |||
|---|---|---|---|
| Quadrant | BADHDUFLAG | Total packets | Discarded packets |
| A | 0 | 80680 | 3 |
| B | 0 | 46263 | 3 |
| C | 0 | 121549 | 3 |
| D | 0 | 61279 | 3 |
| Mode M9 | |||
|---|---|---|---|
| Quadrant | BADHDUFLAG | Total packets | Discarded packets |
| A | 0 | 9 | 0 |
| B | 0 | 9 | 0 |
| C | 0 | 9 | 0 |
| D | 0 | 9 | 0 |
| Quadrant | Total seconds | Saturated seconds | Saturation percentage |
|---|---|---|---|
| A | 18874 | 3588 | 19.010279% |
| B | 18875 | 829 | 4.392053% |
| C | 18875 | 14733 | 78.055629% |
| D | 18875 | 2215 | 11.735099% |
Noise dominated data is calculated using 1-second bins in cleaned event files. If a bin has >2000 counts, and if more than 50% of those come from <1% of pixels, then it is considered to be noise-dominated and hence unusable.
| Quadrant | # 1 sec bins | Bins with >0 counts | Bins with >2000 counts | High rate bins dominated by noise | Noise dominated (total time) | Noise dominated (detector-on time) | Marked lightcurve |
|---|---|---|---|---|---|---|---|
| A | 19774 | 18877 | 2515 | 2515 | 12.72% | 13.32% | 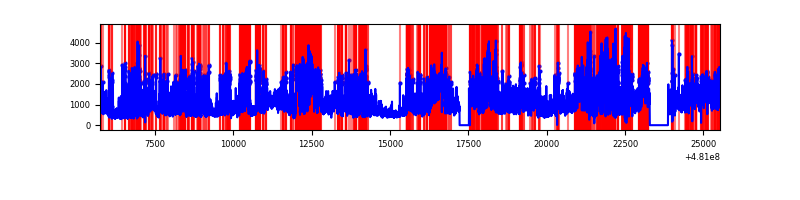 |
| B | 19775 | 18878 | 389 | 389 | 1.97% | 2.06% | 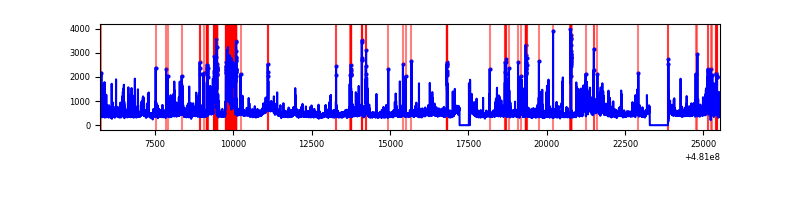 |
| C | 19775 | 18878 | 9323 | 9323 | 47.15% | 49.39% | 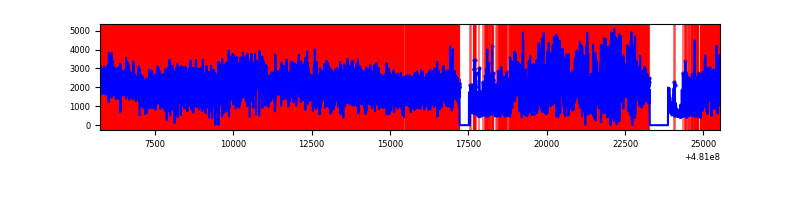 |
| D | 19775 | 18878 | 2051 | 2051 | 10.37% | 10.86% | 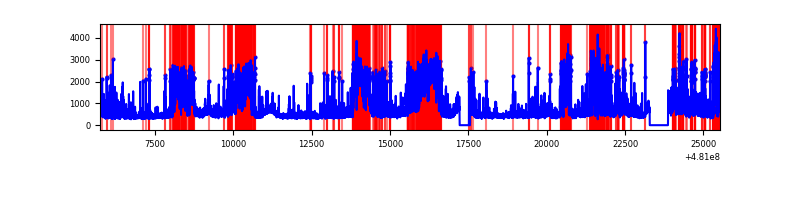 |
Top three noisy pixels from each quadrant. If the there are fewer than three noisy pixels in the level2.evt file, extra rows are filled as -1
| Pixel properties | Quadrant properties | ||||||
|---|---|---|---|---|---|---|---|
| Quadrant | DetID | PixID | Counts | Sigma | Mean | Median | Sigma |
| A | 12 | 3 | 5303489 | 11640.26 | 1848 | 1798 | 455.5 |
| A | 15 | 174 | 5237709 | 11495.83 | 1848 | 1798 | 455.5 |
| A | 12 | 250 | 1461964 | 3205.9 | 1848 | 1798 | 455.5 |
| B | 5 | 172 | 1251064 | 2977.97 | 1965 | 1895 | 419.5 |
| B | 5 | 173 | 467943 | 1111.04 | 1965 | 1895 | 419.5 |
| B | 5 | 185 | 292430 | 692.62 | 1965 | 1895 | 419.5 |
| C | 15 | 179 | 17498154 | 64003.35 | 984 | 975 | 273.4 |
| C | 4 | 12 | 10852279 | 39693.24 | 984 | 975 | 273.4 |
| C | 10 | 171 | 1228124 | 4488.82 | 984 | 975 | 273.4 |
| D | 7 | 60 | 4339081 | 8394.17 | 1855 | 1788 | 516.7 |
| D | 15 | 94 | 1166269 | 2253.67 | 1855 | 1788 | 516.7 |
| D | 3 | 12 | 853801 | 1648.94 | 1855 | 1788 | 516.7 |
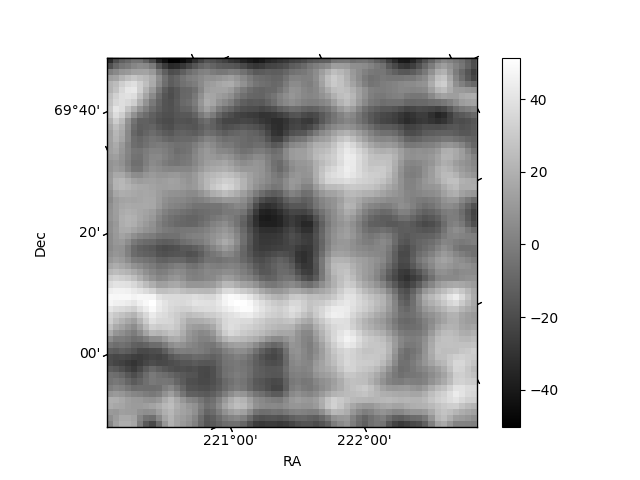
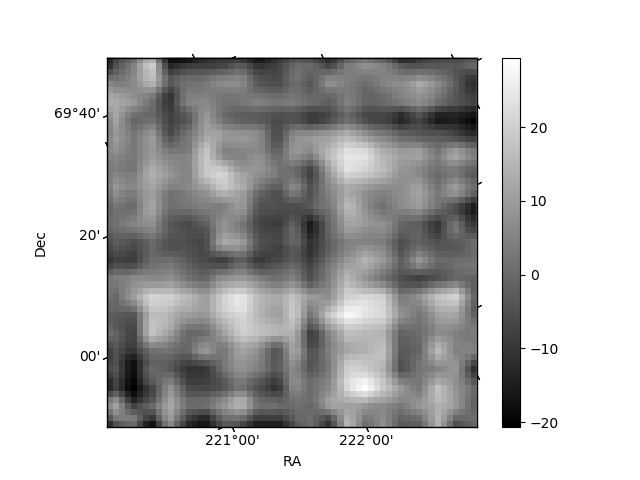
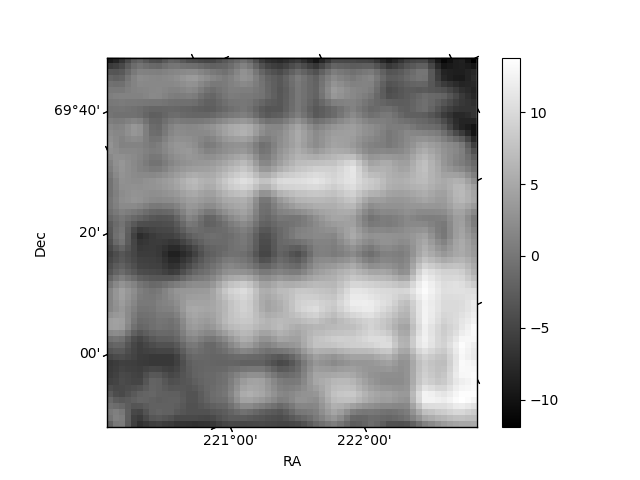
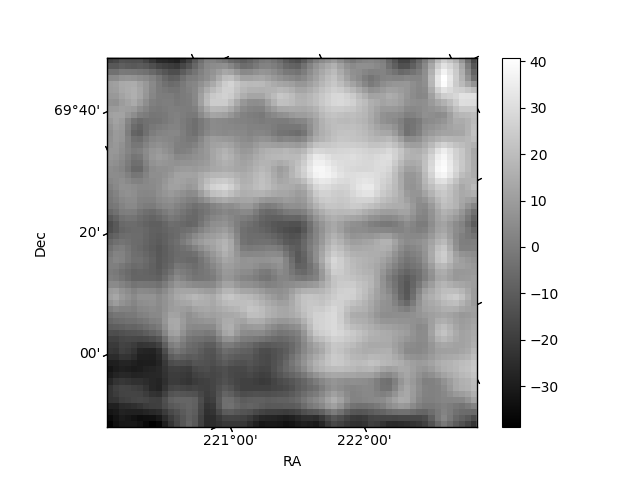
Histogram calculated using DETX and DETY for each event in the final _common_clean file
| Quadrant A | 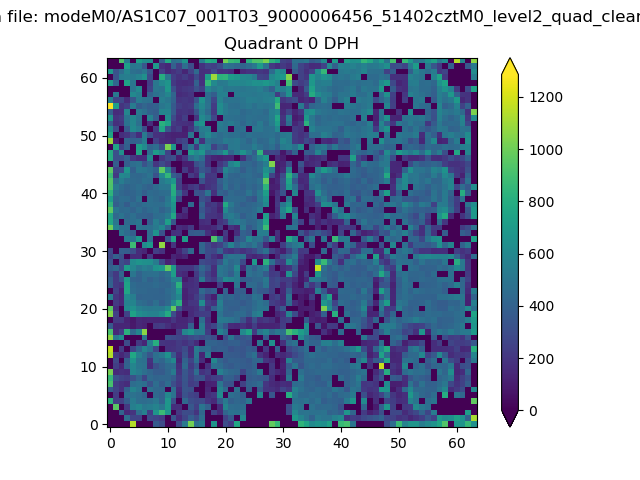 |
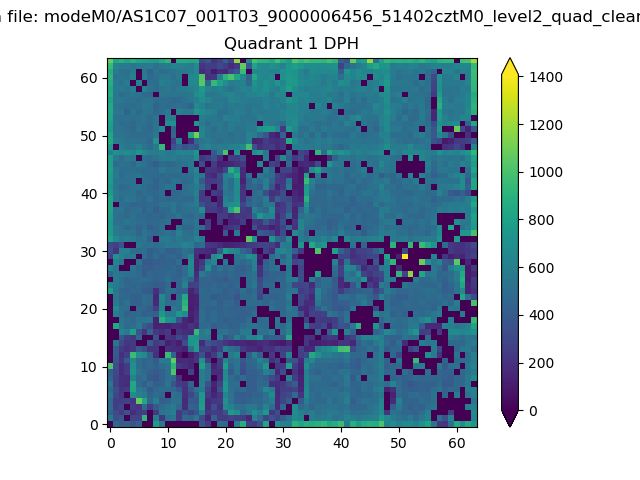 |
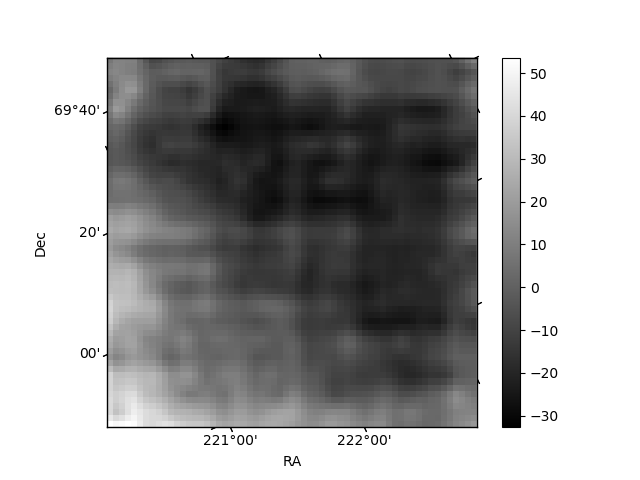
Quadrant B |
|---|---|---|---|
| Quadrant D | 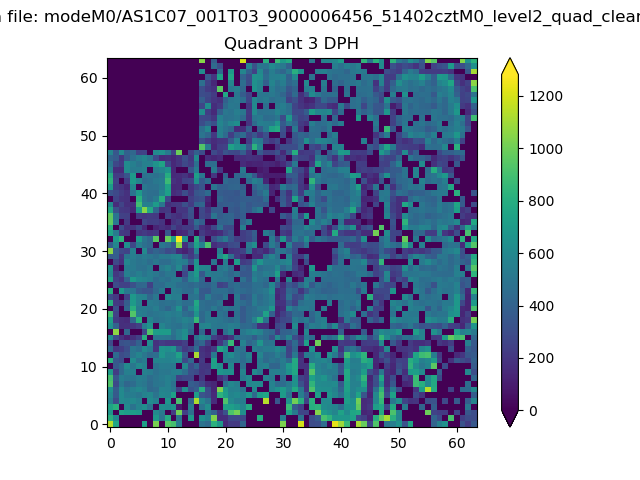 |
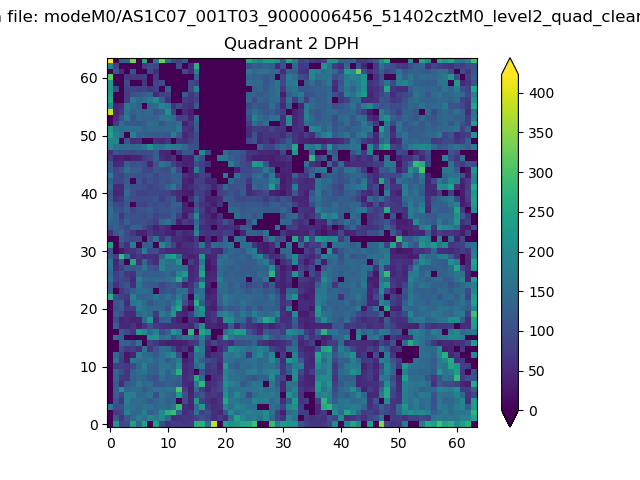 |
Quadrant C |
| Plot type | Count rate plots | Images |
|---|---|---|
| Comparison with Poisson distribution Blue bars denote a histogram of data divided into 1 sec bins. Red curve is a Poisson curve with rate = median count rate of data. |
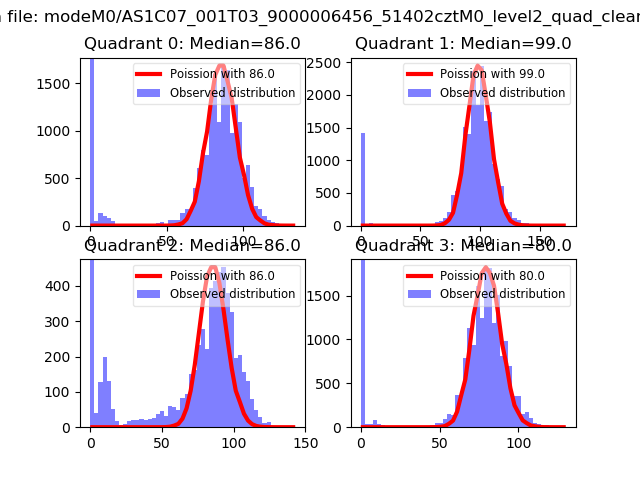 |
 |
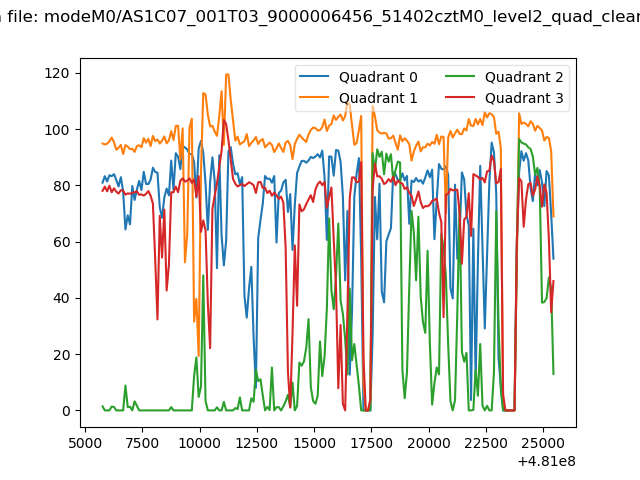
| Quadrant-wise count rates Data is divided into 100 sec bins |
 |
|
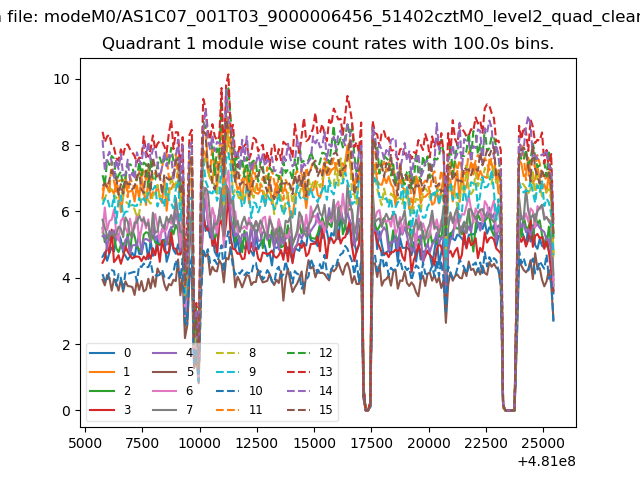
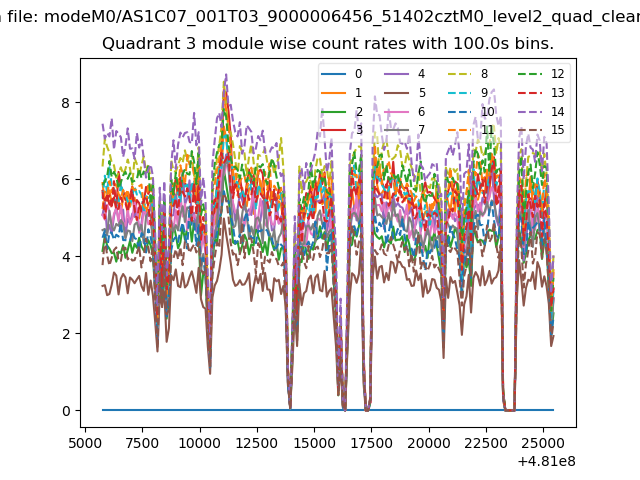
| Module-wise count rates for Quadrant A Data is divided into 100 sec bins |
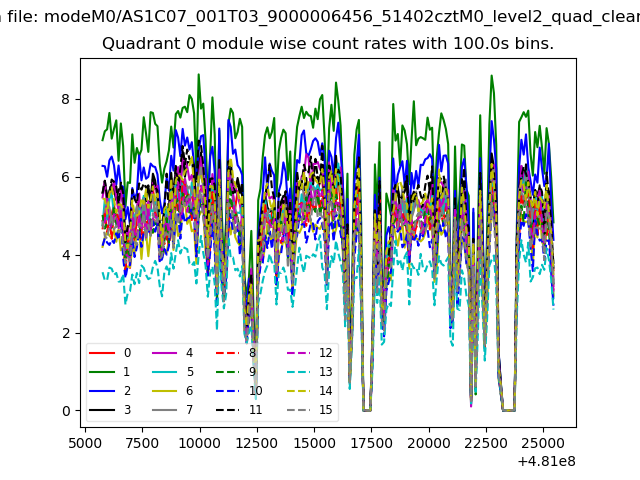 |
 |
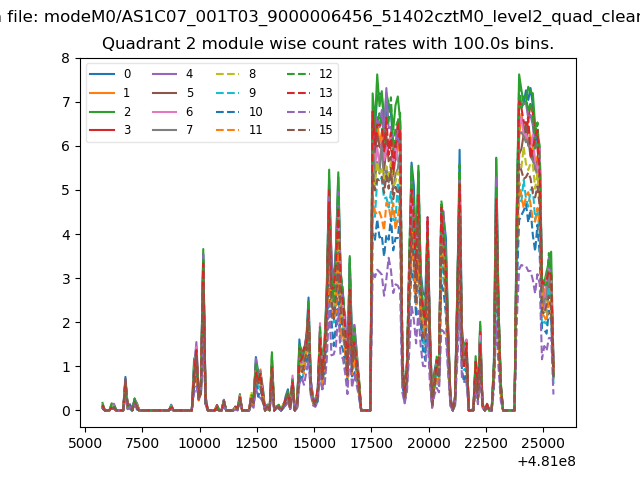
| Module-wise count rates for Quadrant B Data is divided into 100 sec bins |
 |
 |
| Module-wise count rates for Quadrant C Data is divided into 100 sec bins |
 |
 |
| Module-wise count rates for Quadrant D Data is divided into 100 sec bins |
 |
 |
| Parameter | Plot |
|---|---|
| CZT HV Monitor | 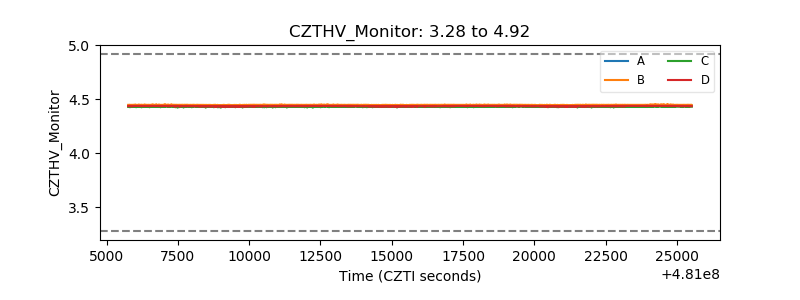 |
| D_VDD | 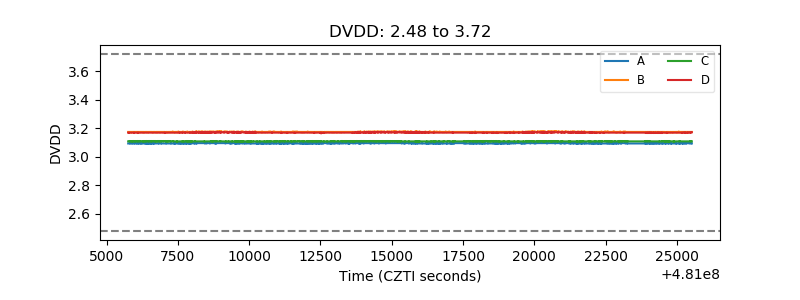 |
| Temperature 1 | 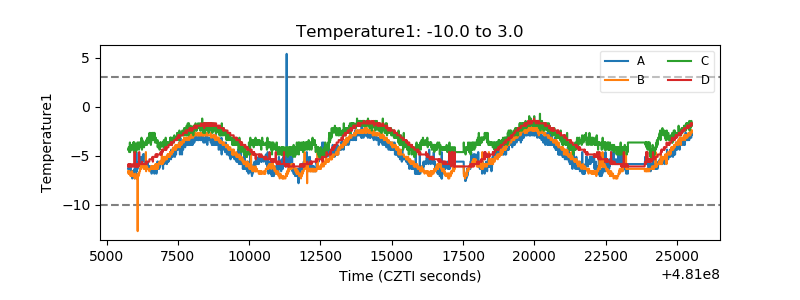 |
| Veto HV Monitor | 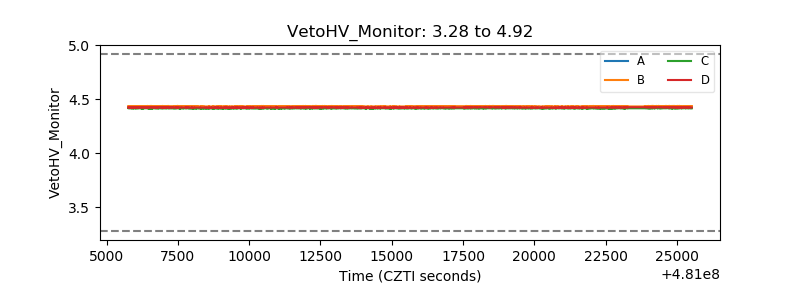 |
| Veto LLD | 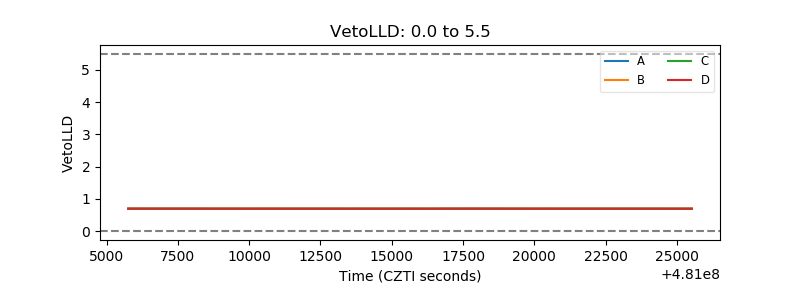 |
| Alpha Counter | 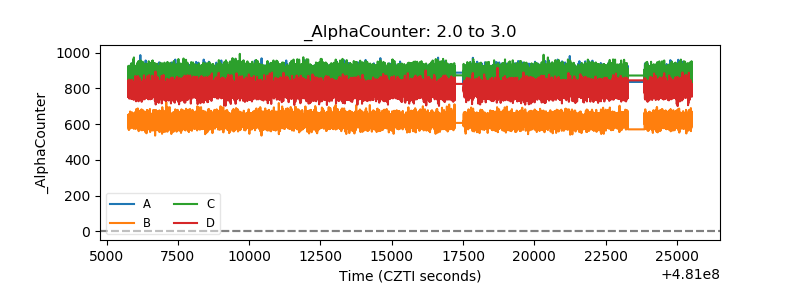 |
| _CPM_Rate |  |
| CZT Counter |  |
| +2.5 Volts monitor |  |
| +5 Volts monitor | 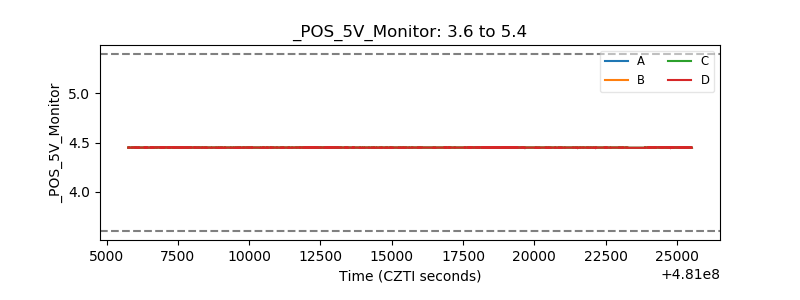 |
| _ROLL_ROT | 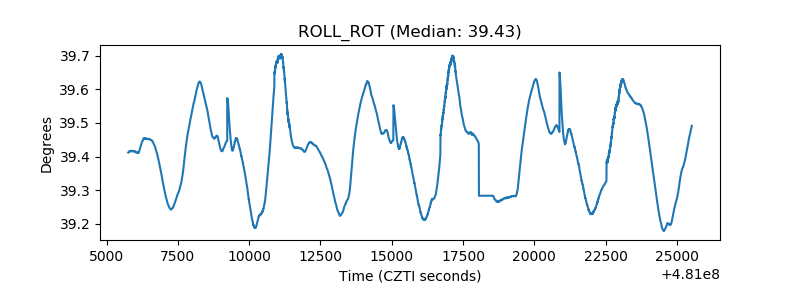 |
| _Roll_DEC | 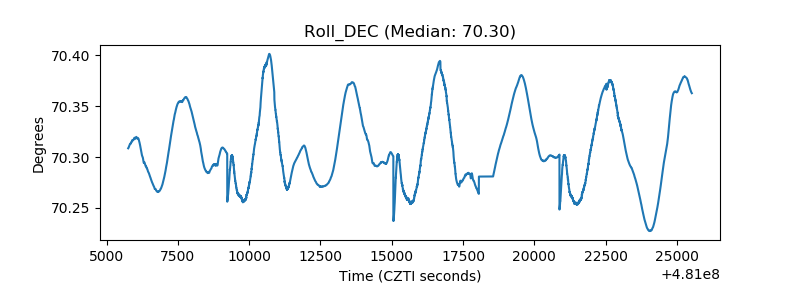 |
| _Roll_RA | 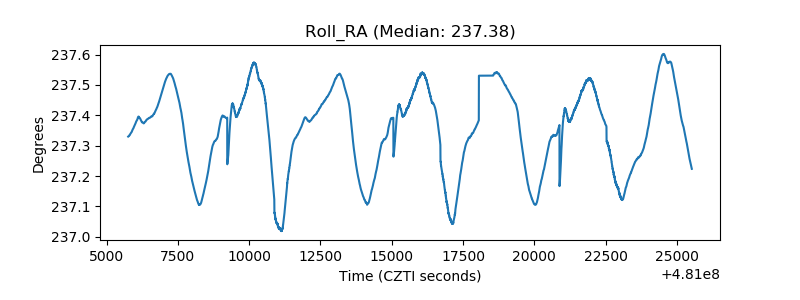 |
| Veto Counter | 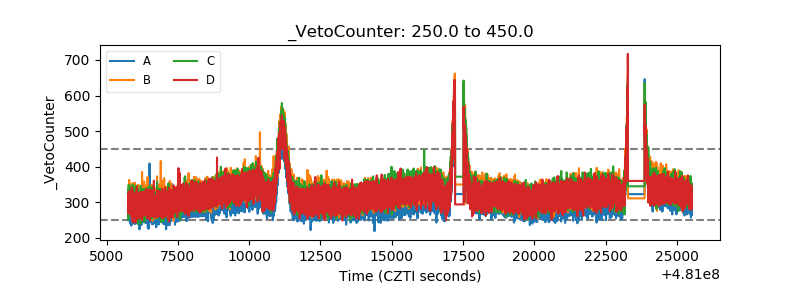 |