| Param | Original file | Final file |
|---|---|---|
| Filename | modeM0/AS1C07_001T03_9000006456_51403cztM0_level2.fits | modeM0/AS1C07_001T03_9000006456_51403cztM0_level2_quad_clean.evt |
| Size (bytes) | 885,084,480 | 86,719,680 |
| Size | 844.1 MB | 82.7 MB |
| Events in quadrant A | 10,053,880 | 523,209 |
| Events in quadrant B | 5,047,363 | 672,714 |
| Events in quadrant C | 9,016,394 | 481,013 |
| Events in quadrant D | 8,117,892 | 471,110 |
| Mode SS | |||
|---|---|---|---|
| Quadrant | BADHDUFLAG | Total packets | Discarded packets |
| A | 0 | 140 | 0 |
| B | 0 | 140 | 0 |
| C | 0 | 140 | 0 |
| D | 0 | 140 | 0 |
| Mode M0 | |||
|---|---|---|---|
| Quadrant | BADHDUFLAG | Total packets | Discarded packets |
| A | 0 | 34690 | 3 |
| B | 0 | 19705 | 1 |
| C | 0 | 31549 | 1 |
| D | 0 | 28854 | 1 |
| Mode M9 | |||
|---|---|---|---|
| Quadrant | BADHDUFLAG | Total packets | Discarded packets |
| A | 0 | 8 | 0 |
| B | 0 | 8 | 0 |
| C | 0 | 8 | 0 |
| D | 0 | 8 | 0 |
| Quadrant | Total seconds | Saturated seconds | Saturation percentage |
|---|---|---|---|
| A | 6843 | 1459 | 21.321058% |
| B | 6844 | 285 | 4.164231% |
| C | 6844 | 1838 | 26.855640% |
| D | 6844 | 1431 | 20.908825% |
Noise dominated data is calculated using 1-second bins in cleaned event files. If a bin has >2000 counts, and if more than 50% of those come from <1% of pixels, then it is considered to be noise-dominated and hence unusable.
| Quadrant | # 1 sec bins | Bins with >0 counts | Bins with >2000 counts | High rate bins dominated by noise | Noise dominated (total time) | Noise dominated (detector-on time) | Marked lightcurve |
|---|---|---|---|---|---|---|---|
| A | 7673 | 6844 | 1224 | 1224 | 15.95% | 17.88% | 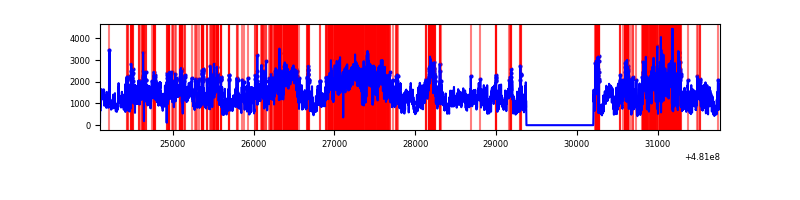 |
| B | 7674 | 6845 | 145 | 145 | 1.89% | 2.12% | 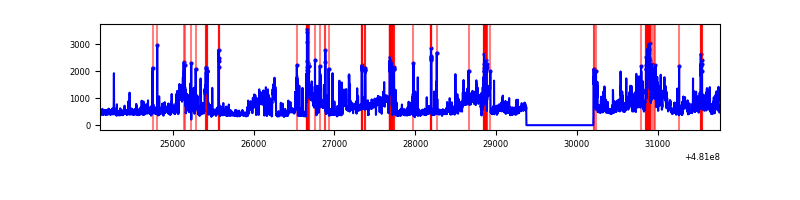 |
| C | 7674 | 6845 | 1344 | 1344 | 17.51% | 19.63% | 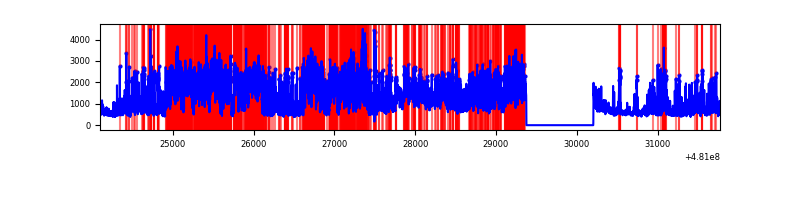 |
| D | 7674 | 6845 | 1360 | 1360 | 17.72% | 19.87% | 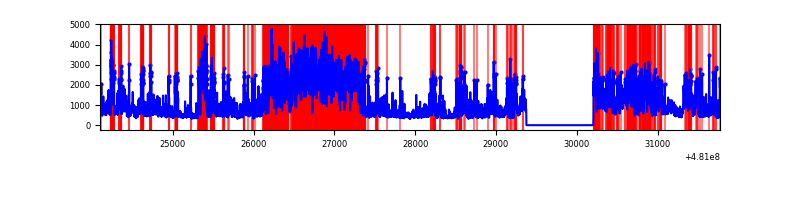 |
Top three noisy pixels from each quadrant. If the there are fewer than three noisy pixels in the level2.evt file, extra rows are filled as -1
| Pixel properties | Quadrant properties | ||||||
|---|---|---|---|---|---|---|---|
| Quadrant | DetID | PixID | Counts | Sigma | Mean | Median | Sigma |
| A | 12 | 3 | 3242483 | 19377.77 | 677 | 659 | 167.3 |
| A | 8 | 249 | 1700153 | 10158.6 | 677 | 659 | 167.3 |
| A | 15 | 174 | 874854 | 5225.44 | 677 | 659 | 167.3 |
| B | 5 | 173 | 857070 | 5636.67 | 711 | 687 | 151.9 |
| B | 10 | 254 | 544554 | 3579.7 | 711 | 687 | 151.9 |
| B | 5 | 185 | 262254 | 1721.62 | 711 | 687 | 151.9 |
| C | 15 | 179 | 3851646 | 21875.34 | 634 | 627 | 176.0 |
| C | 3 | 233 | 686210 | 3894.39 | 634 | 627 | 176.0 |
| C | 10 | 171 | 662573 | 3760.12 | 634 | 627 | 176.0 |
| D | 15 | 94 | 2411417 | 13451.49 | 635 | 610 | 179.2 |
| D | 3 | 12 | 1747799 | 9748.72 | 635 | 610 | 179.2 |
| D | 6 | 42 | 438199 | 2441.6 | 635 | 610 | 179.2 |
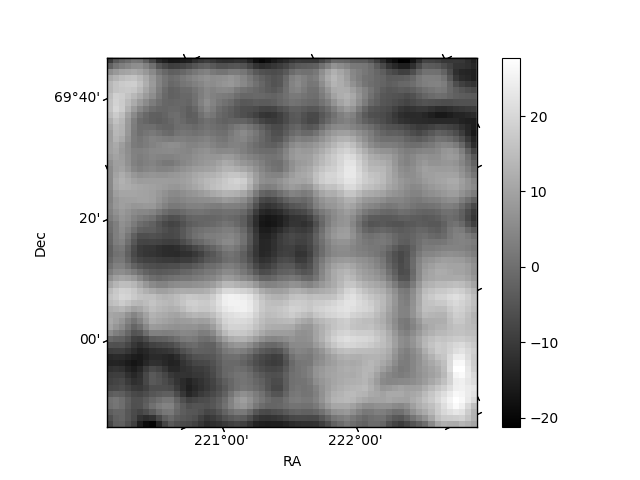
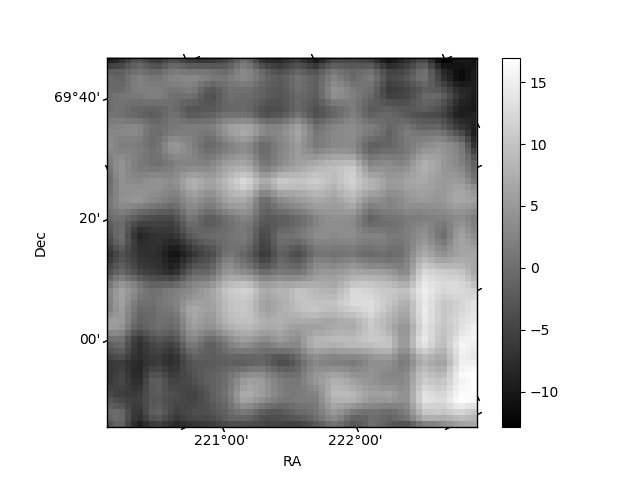
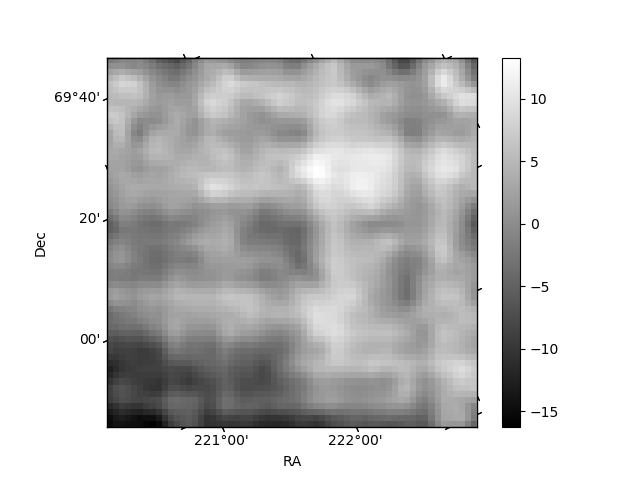
Histogram calculated using DETX and DETY for each event in the final _common_clean file
| Quadrant A | 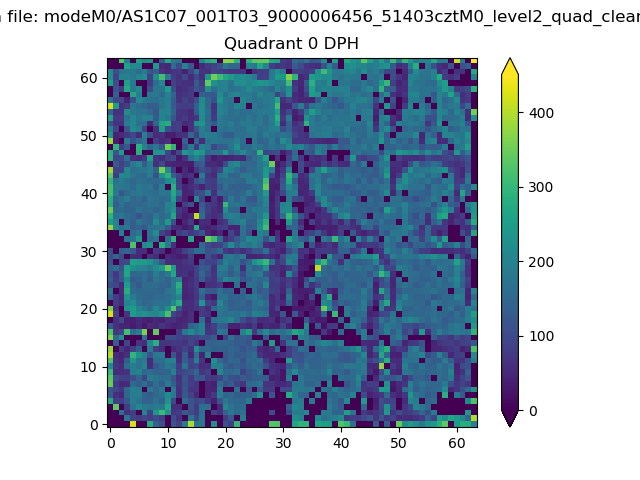 |
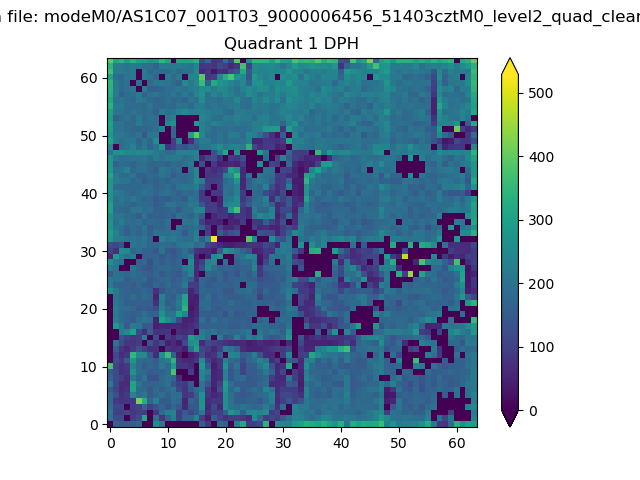 |
Quadrant B |
|---|---|---|---|
| Quadrant D | 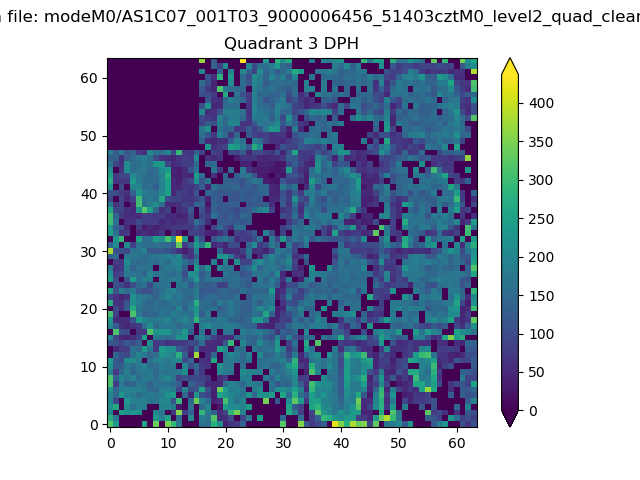 |
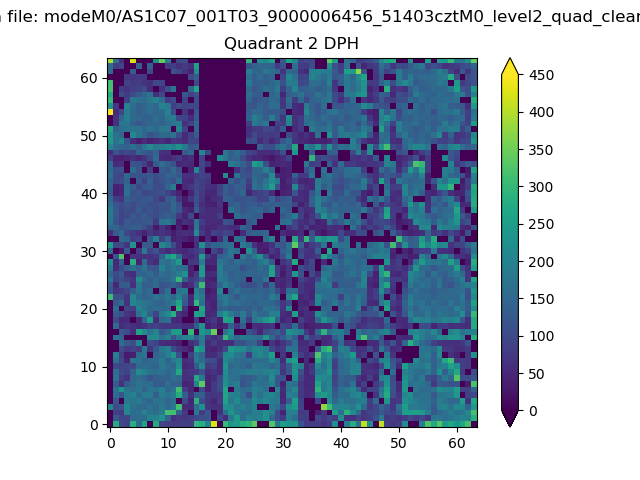 |
Quadrant C |
| Plot type | Count rate plots | Images |
|---|---|---|
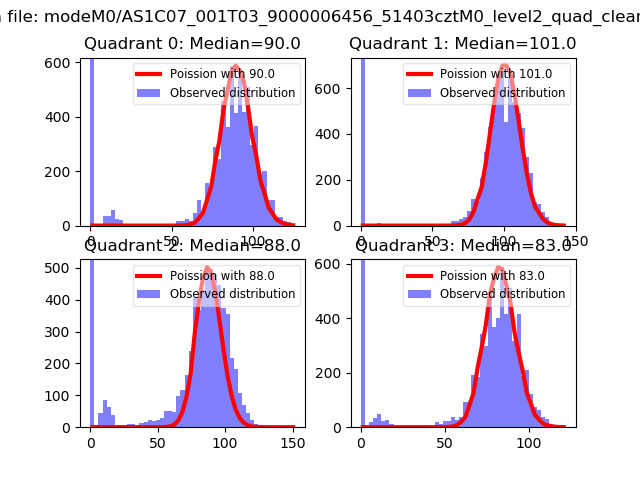
| Comparison with Poisson distribution Blue bars denote a histogram of data divided into 1 sec bins. Red curve is a Poisson curve with rate = median count rate of data. |
 |
 |
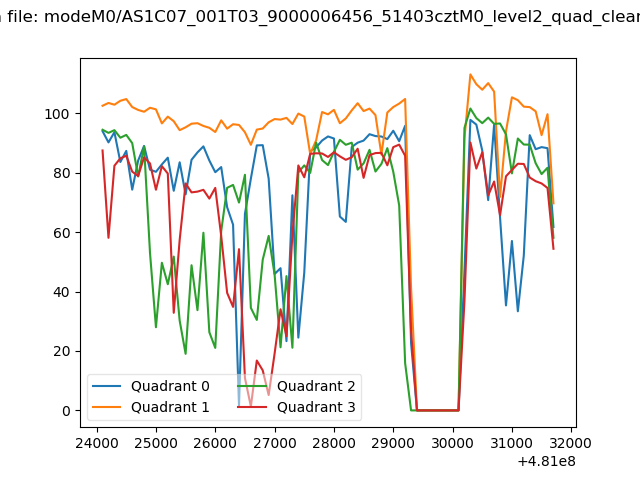
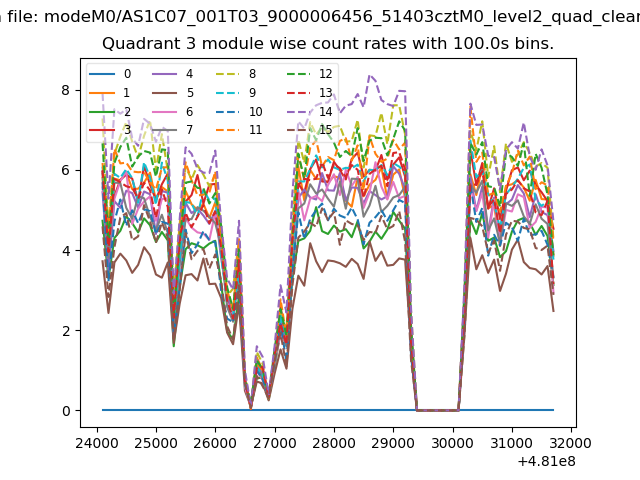
| Quadrant-wise count rates Data is divided into 100 sec bins |
 |
|
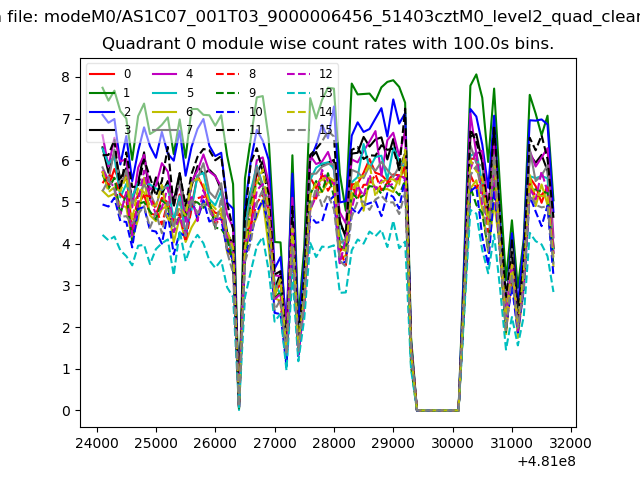
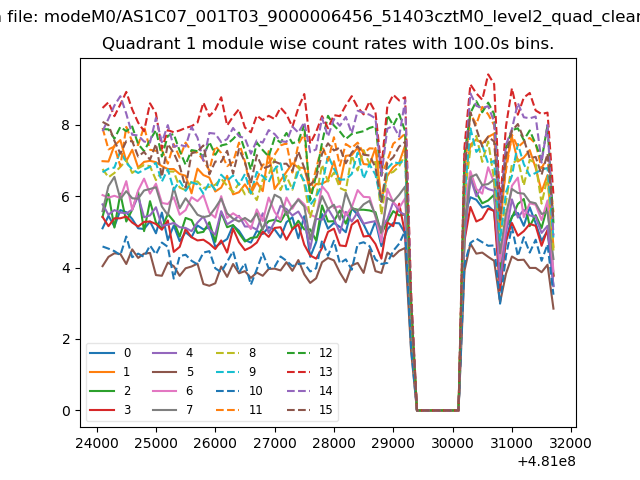
| Module-wise count rates for Quadrant A Data is divided into 100 sec bins |
 |
 |
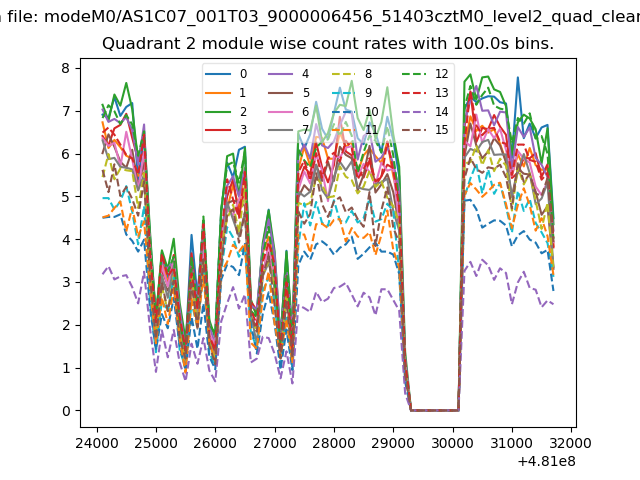
| Module-wise count rates for Quadrant B Data is divided into 100 sec bins |
 |
 |
| Module-wise count rates for Quadrant C Data is divided into 100 sec bins |
 |
 |
| Module-wise count rates for Quadrant D Data is divided into 100 sec bins |
 |
 |
| Parameter | Plot |
|---|---|
| CZT HV Monitor | 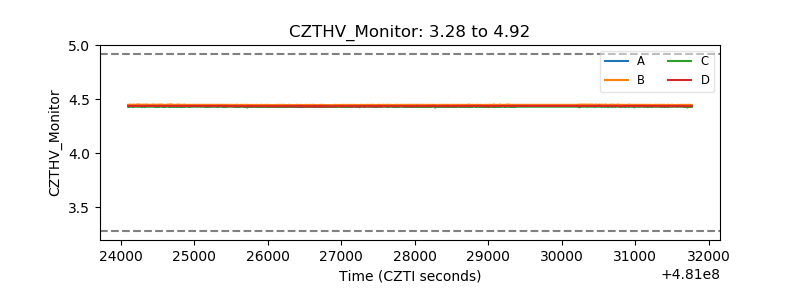 |
| D_VDD | 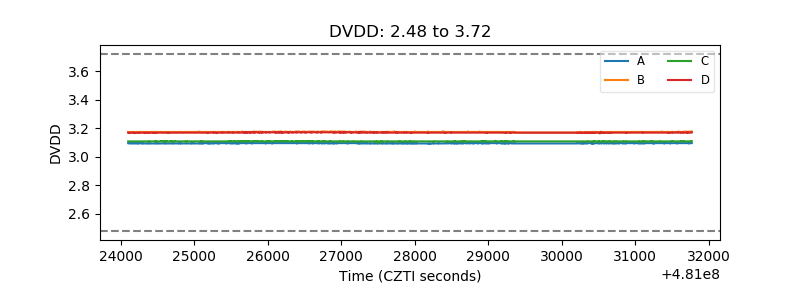 |
| Temperature 1 | 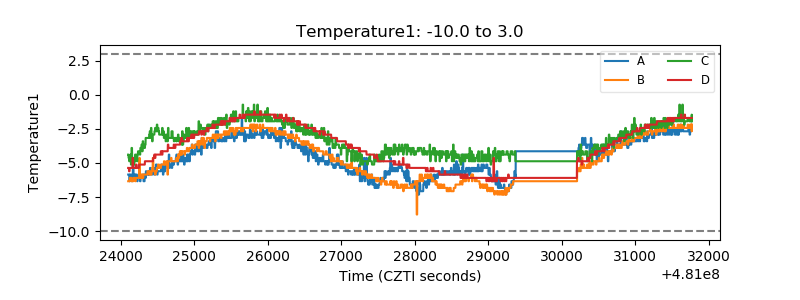 |
| Veto HV Monitor | 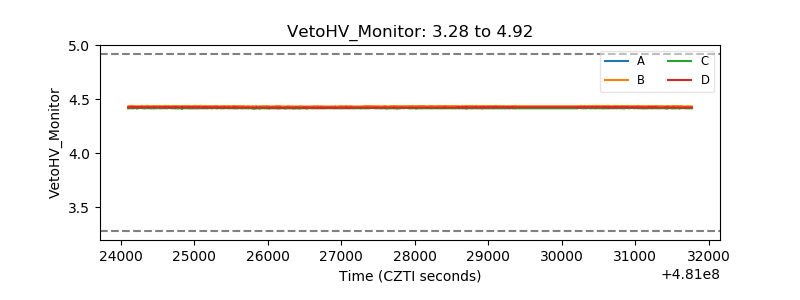 |
| Veto LLD | 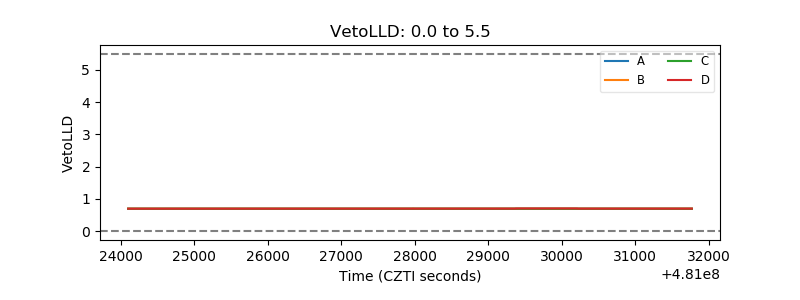 |
| Alpha Counter | 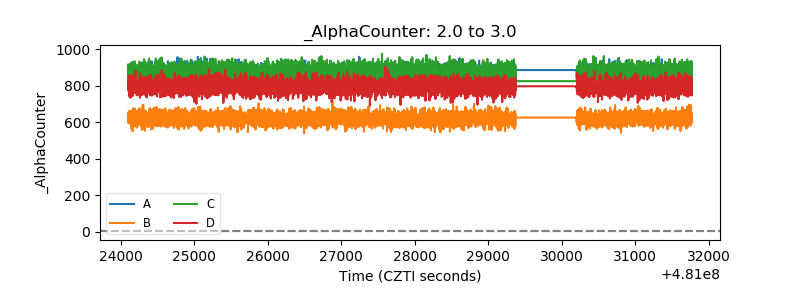 |
| _CPM_Rate | 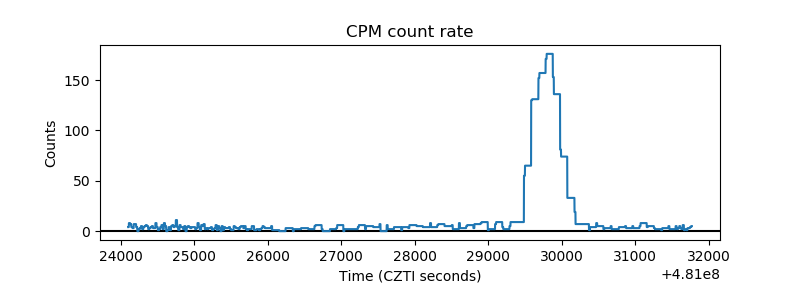 |
| CZT Counter | 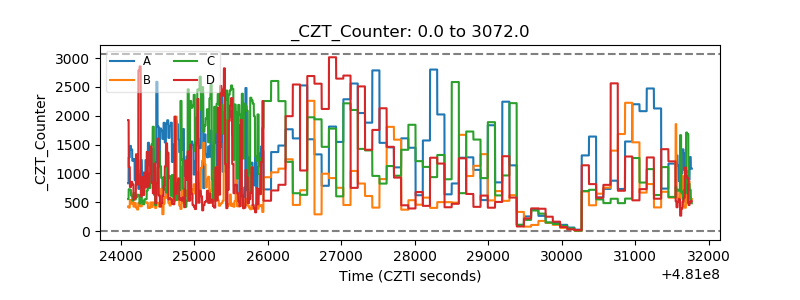 |
| +2.5 Volts monitor |  |
| +5 Volts monitor | 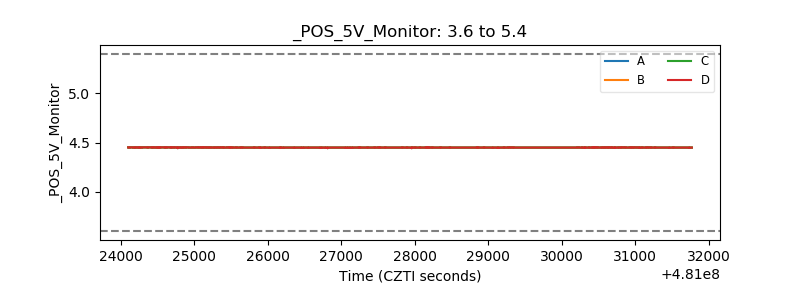 |
| _ROLL_ROT | 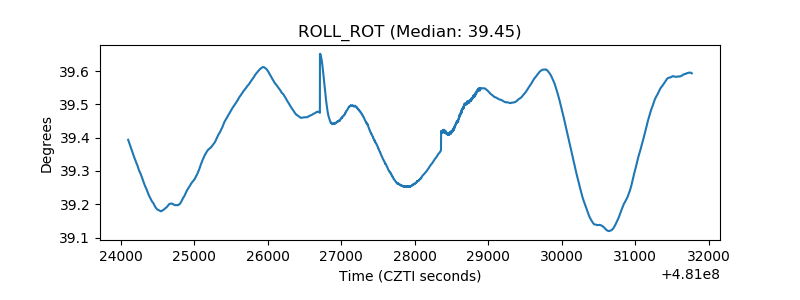 |
| _Roll_DEC | 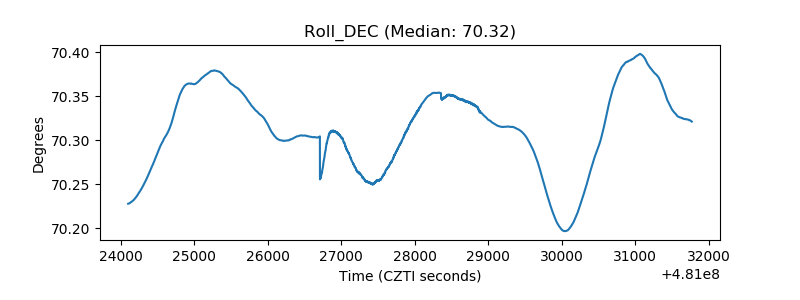 |
| _Roll_RA | 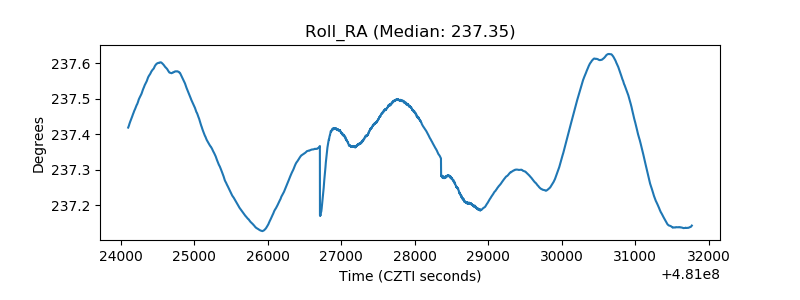 |
| Veto Counter | 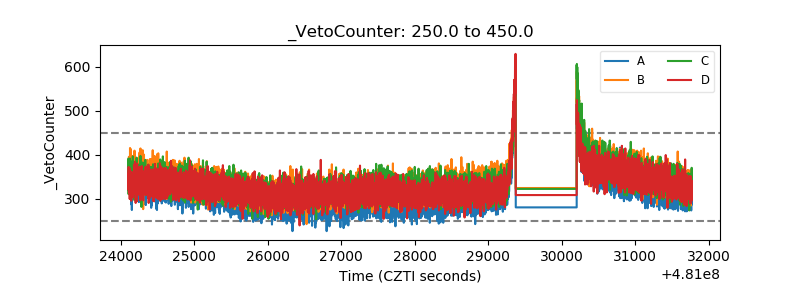 |