| Param | Original file | Final file |
|---|---|---|
| Filename | modeM0/AS1C07_001T03_9000006456_51405cztM0_level2.fits | modeM0/AS1C07_001T03_9000006456_51405cztM0_level2_quad_clean.evt |
| Size (bytes) | 682,159,680 | 88,986,240 |
| Size | 650.6 MB | 84.9 MB |
| Events in quadrant A | 8,630,246 | 506,799 |
| Events in quadrant B | 5,316,036 | 642,181 |
| Events in quadrant C | 6,062,532 | 561,424 |
| Events in quadrant D | 4,743,145 | 533,086 |
| Mode SS | |||
|---|---|---|---|
| Quadrant | BADHDUFLAG | Total packets | Discarded packets |
| A | 0 | 130 | 0 |
| B | 0 | 130 | 0 |
| C | 0 | 130 | 0 |
| D | 0 | 130 | 0 |
| Mode M0 | |||
|---|---|---|---|
| Quadrant | BADHDUFLAG | Total packets | Discarded packets |
| A | 0 | 30223 | 1 |
| B | 0 | 20254 | 1 |
| C | 0 | 22633 | 1 |
| D | 0 | 18555 | 1 |
| Mode M9 | |||
|---|---|---|---|
| Quadrant | BADHDUFLAG | Total packets | Discarded packets |
| A | 0 | 10 | 0 |
| B | 0 | 10 | 0 |
| C | 0 | 10 | 0 |
| D | 0 | 10 | 0 |
| Quadrant | Total seconds | Saturated seconds | Saturation percentage |
|---|---|---|---|
| A | 6465 | 1397 | 21.608662% |
| B | 6465 | 376 | 5.815932% |
| C | 6465 | 459 | 7.099768% |
| D | 6465 | 343 | 5.305491% |
Noise dominated data is calculated using 1-second bins in cleaned event files. If a bin has >2000 counts, and if more than 50% of those come from <1% of pixels, then it is considered to be noise-dominated and hence unusable.
| Quadrant | # 1 sec bins | Bins with >0 counts | Bins with >2000 counts | High rate bins dominated by noise | Noise dominated (total time) | Noise dominated (detector-on time) | Marked lightcurve |
|---|---|---|---|---|---|---|---|
| A | 7435 | 6466 | 1167 | 1167 | 15.70% | 18.05% | 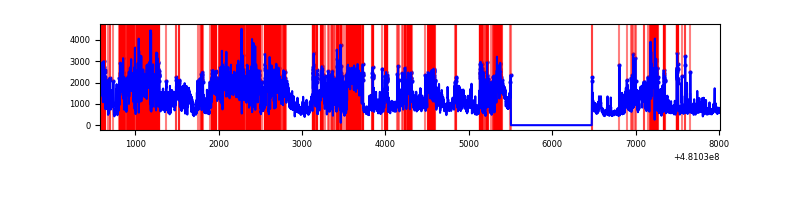 |
| B | 7435 | 6466 | 194 | 194 | 2.61% | 3.00% | 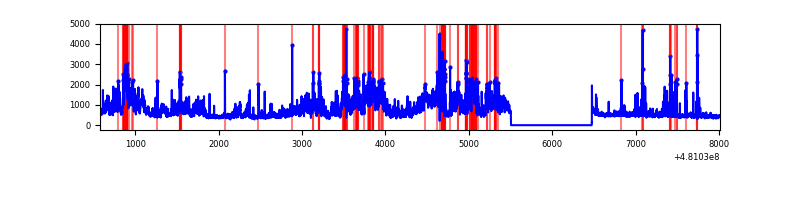 |
| C | 7435 | 6466 | 333 | 333 | 4.48% | 5.15% | 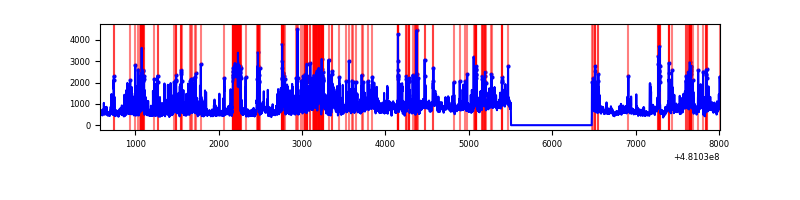 |
| D | 7435 | 6466 | 287 | 287 | 3.86% | 4.44% | 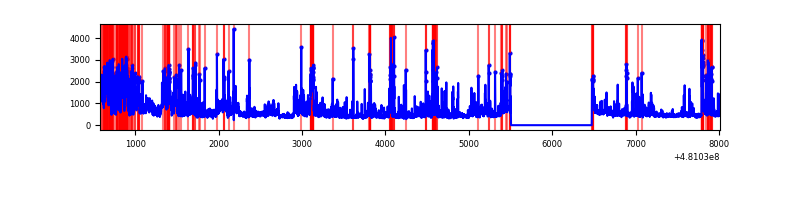 |
Top three noisy pixels from each quadrant. If the there are fewer than three noisy pixels in the level2.evt file, extra rows are filled as -1
| Pixel properties | Quadrant properties | ||||||
|---|---|---|---|---|---|---|---|
| Quadrant | DetID | PixID | Counts | Sigma | Mean | Median | Sigma |
| A | 8 | 249 | 1618887 | 10079.97 | 643 | 628 | 160.5 |
| A | 12 | 3 | 1470641 | 9156.56 | 643 | 628 | 160.5 |
| A | 12 | 250 | 1017504 | 6334.02 | 643 | 628 | 160.5 |
| B | 10 | 254 | 1836969 | 12756.74 | 673 | 649 | 143.9 |
| B | 5 | 185 | 309763 | 2147.39 | 673 | 649 | 143.9 |
| B | 6 | 51 | 119769 | 827.52 | 673 | 649 | 143.9 |
| C | 12 | 247 | 943239 | 5274.5 | 659 | 655 | 178.7 |
| C | 15 | 179 | 848915 | 4746.69 | 659 | 655 | 178.7 |
| C | 12 | 252 | 496381 | 2773.98 | 659 | 655 | 178.7 |
| D | 15 | 94 | 812566 | 4447.45 | 654 | 632 | 182.6 |
| D | 2 | 216 | 301392 | 1647.44 | 654 | 632 | 182.6 |
| D | 11 | 176 | 162484 | 886.56 | 654 | 632 | 182.6 |
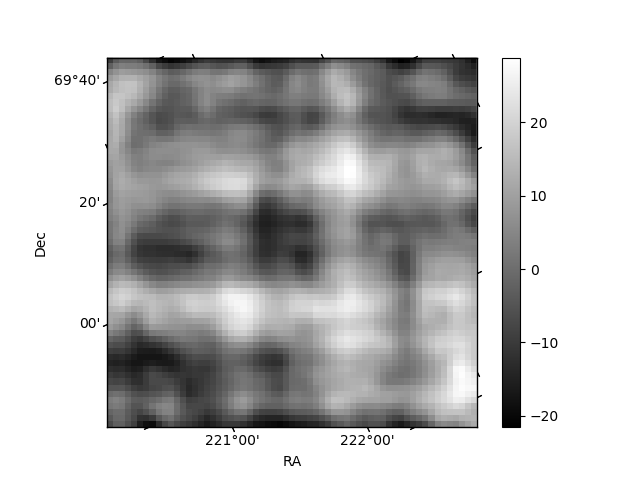
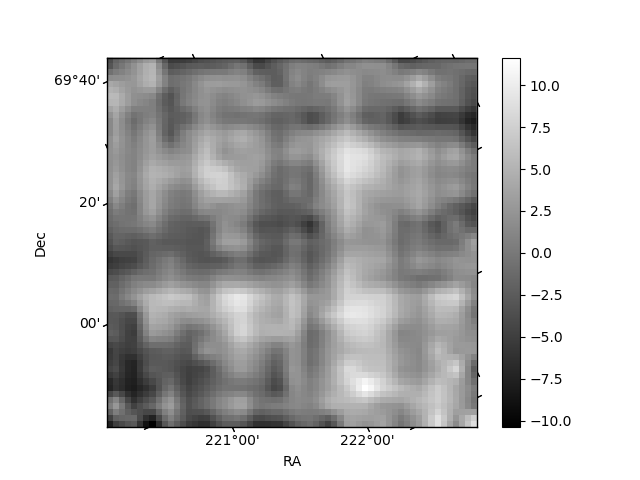
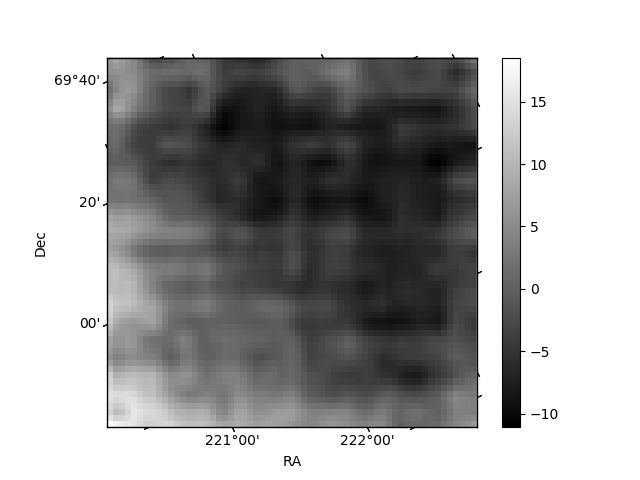
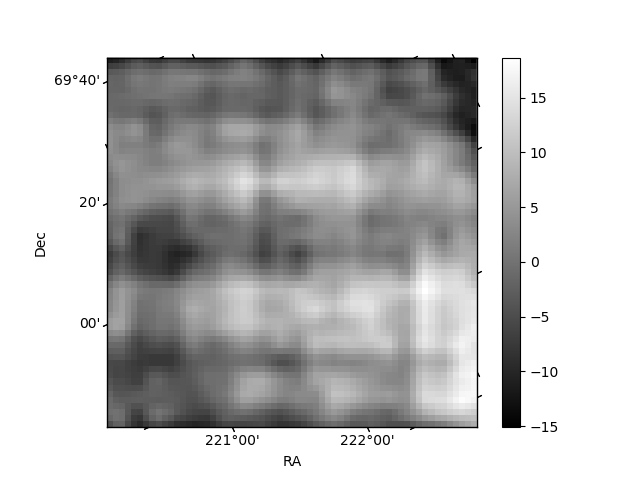
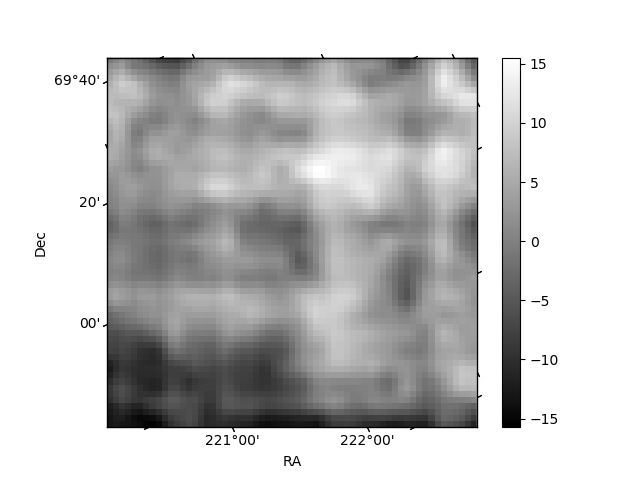
Histogram calculated using DETX and DETY for each event in the final _common_clean file
| Quadrant A | 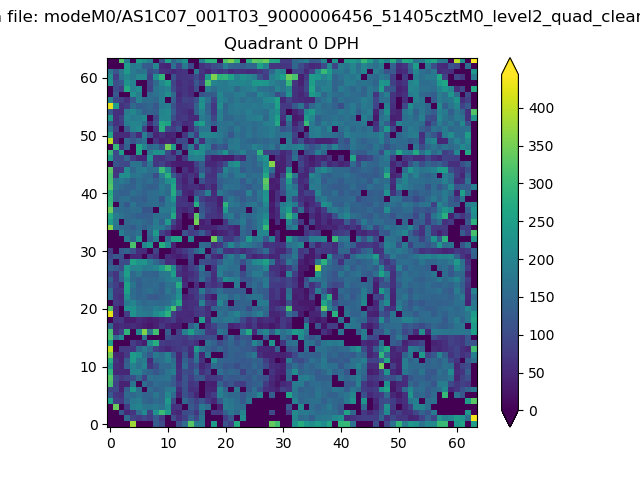 |
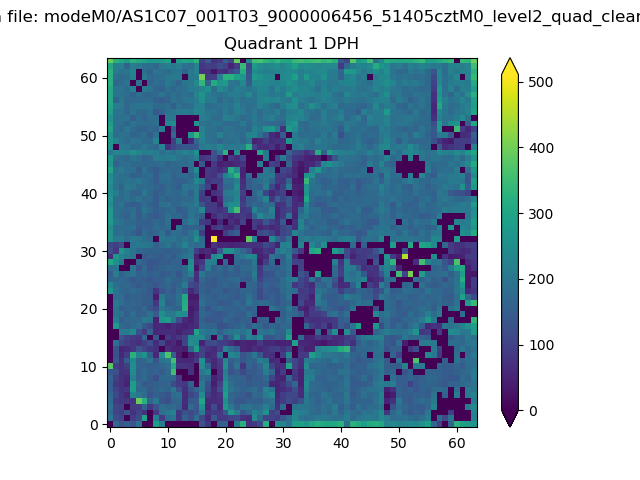 |
Quadrant B |
|---|---|---|---|
| Quadrant D | 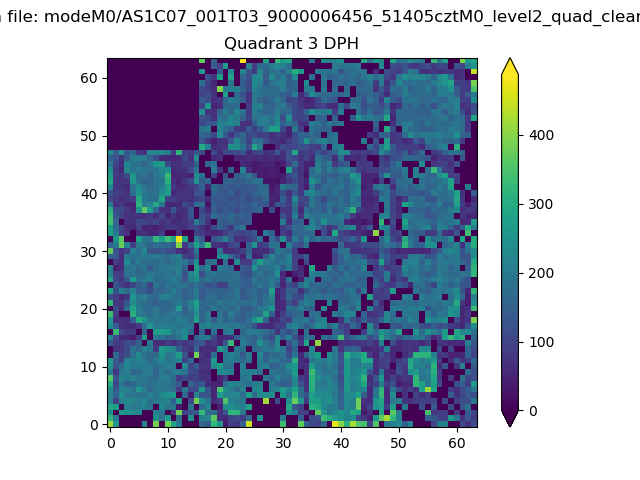 |
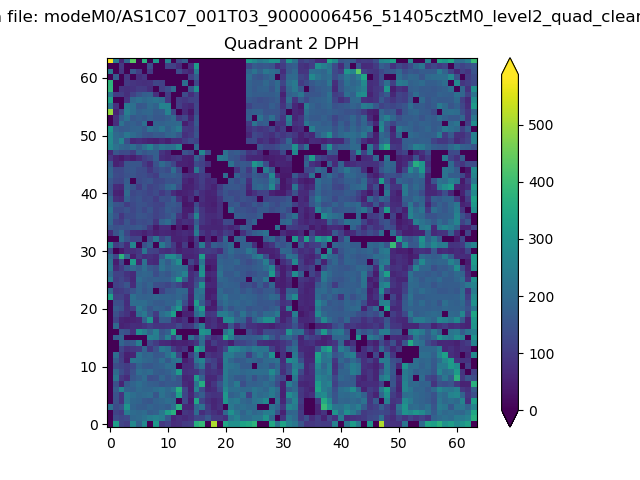 |
Quadrant C |
| Plot type | Count rate plots | Images |
|---|---|---|
| Comparison with Poisson distribution Blue bars denote a histogram of data divided into 1 sec bins. Red curve is a Poisson curve with rate = median count rate of data. |
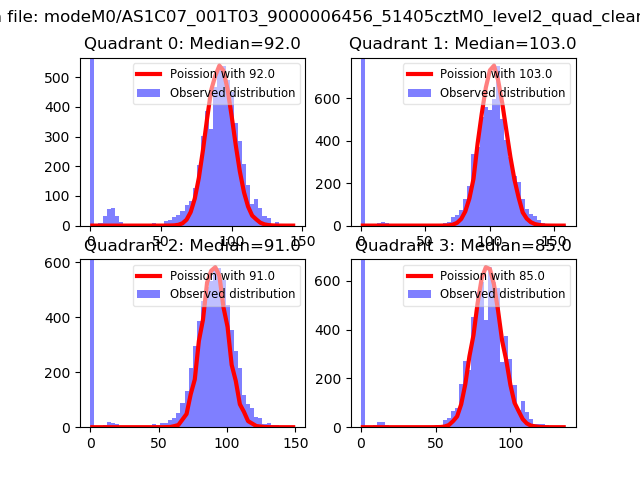 |
 |
| Quadrant-wise count rates Data is divided into 100 sec bins |
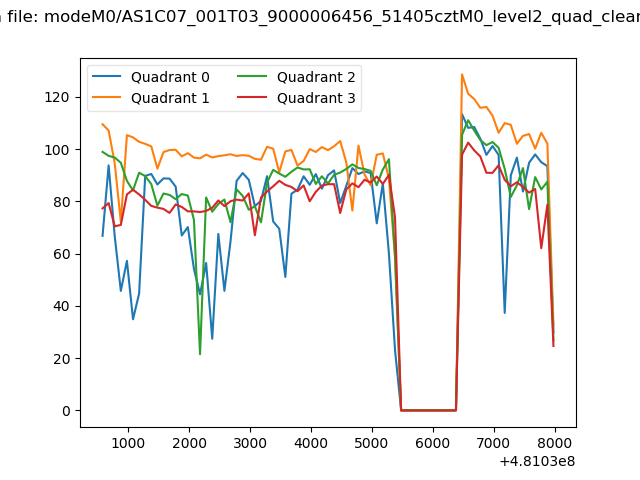 |
|
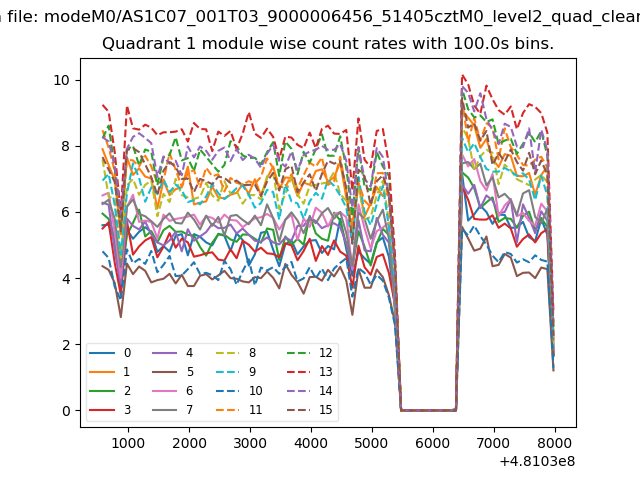
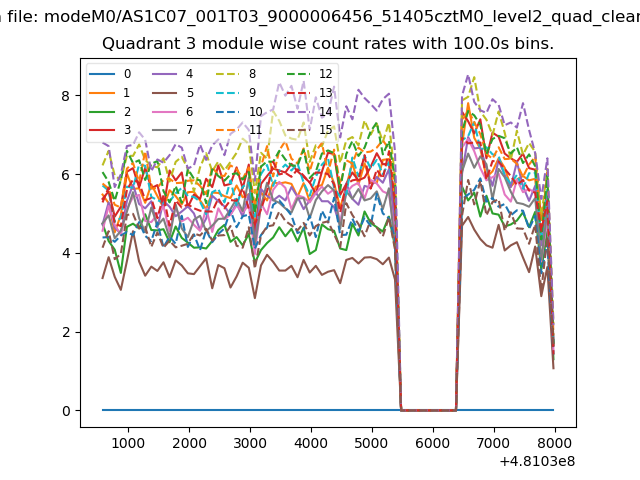
| Module-wise count rates for Quadrant A Data is divided into 100 sec bins |
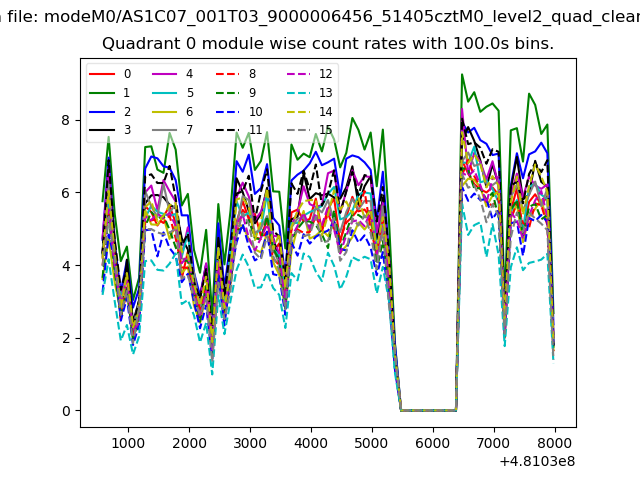 |
 |
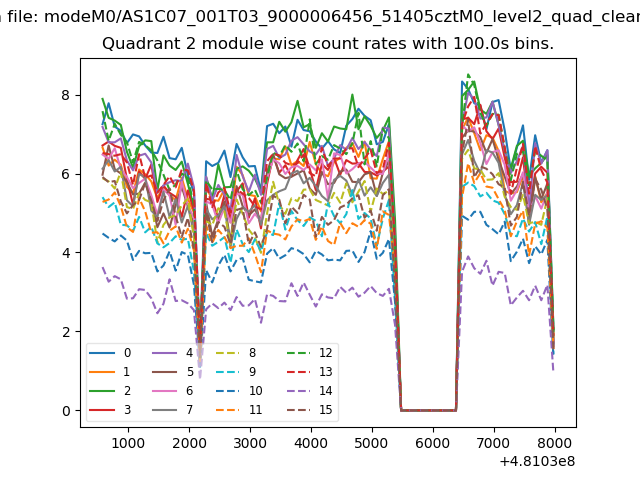
| Module-wise count rates for Quadrant B Data is divided into 100 sec bins |
 |
 |
| Module-wise count rates for Quadrant C Data is divided into 100 sec bins |
 |
 |
| Module-wise count rates for Quadrant D Data is divided into 100 sec bins |
 |
 |
| Parameter | Plot |
|---|---|
| CZT HV Monitor |  |
| D_VDD | 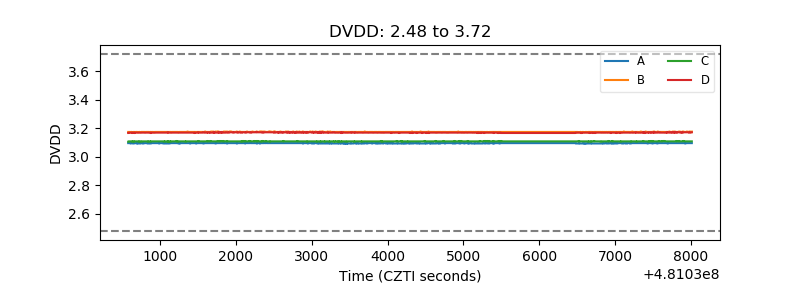 |
| Temperature 1 | 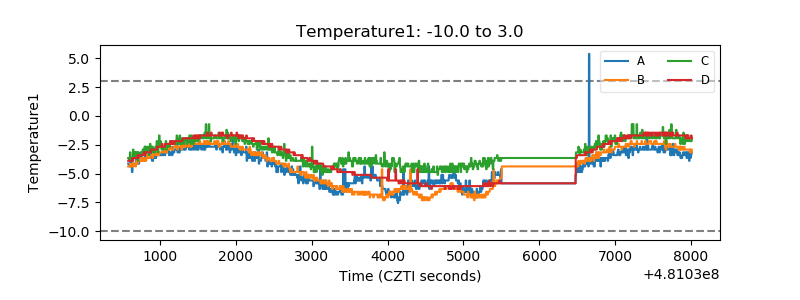 |
| Veto HV Monitor | 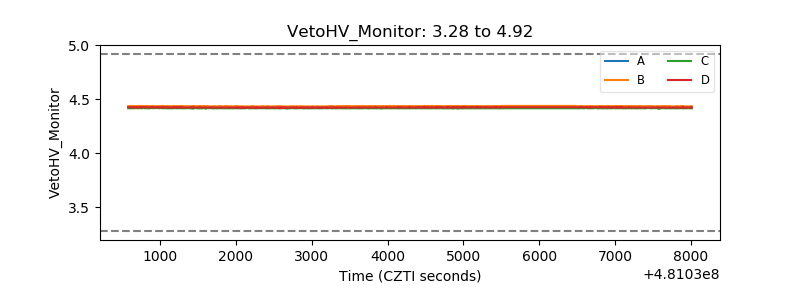 |
| Veto LLD | 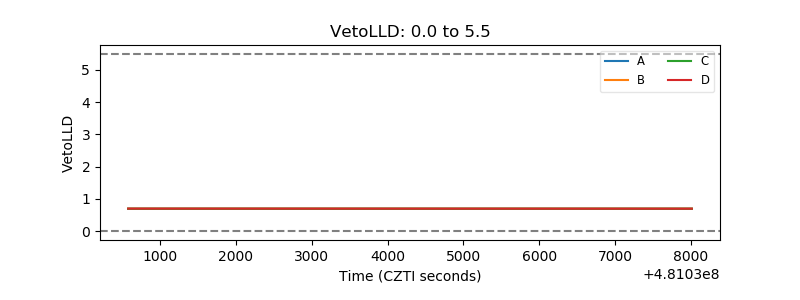 |
| Alpha Counter | 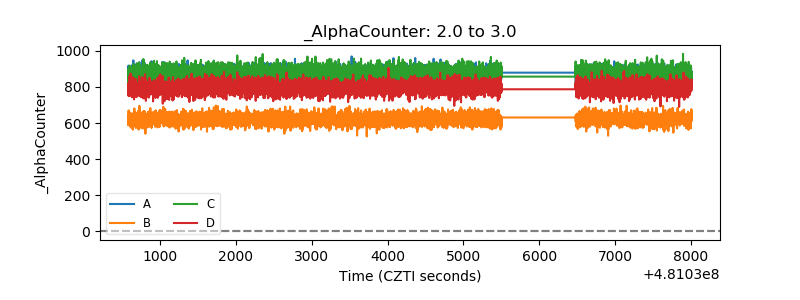 |
| _CPM_Rate | 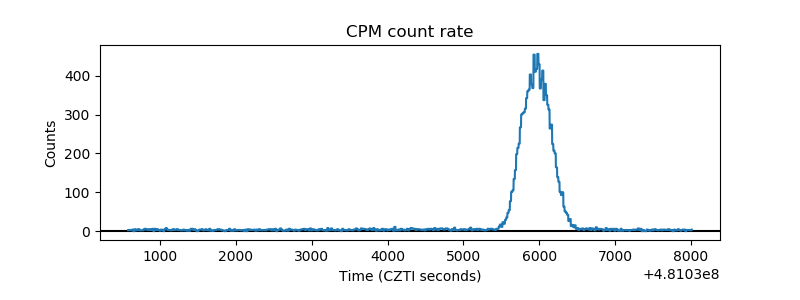 |
| CZT Counter | 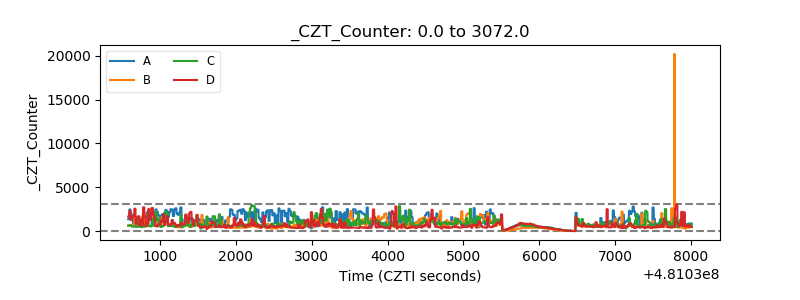 |
| +2.5 Volts monitor | 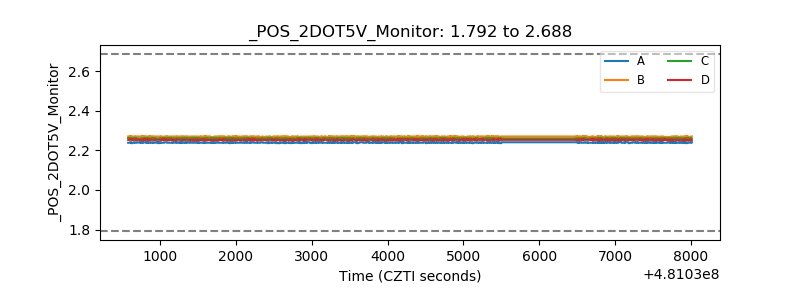 |
| +5 Volts monitor | 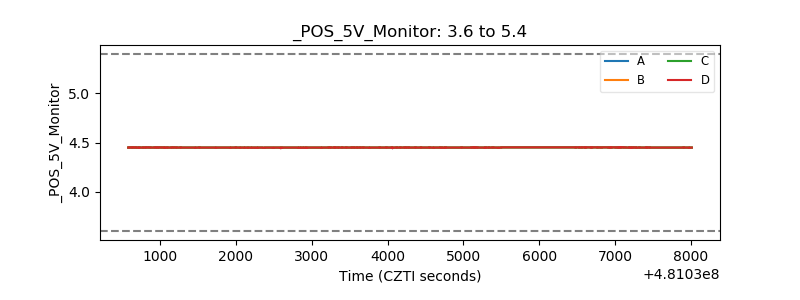 |
| _ROLL_ROT | 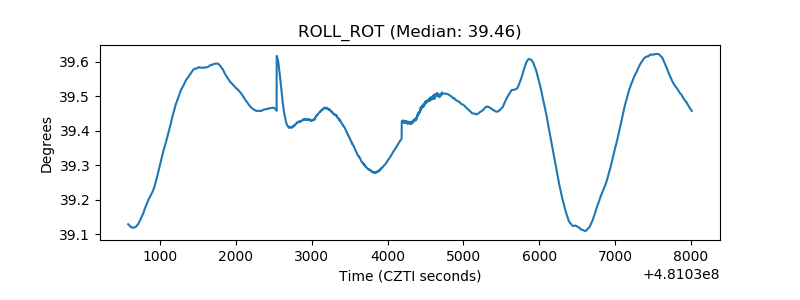 |
| _Roll_DEC | 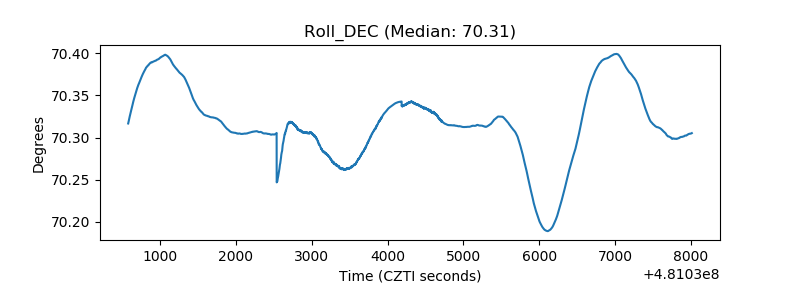 |
| _Roll_RA | 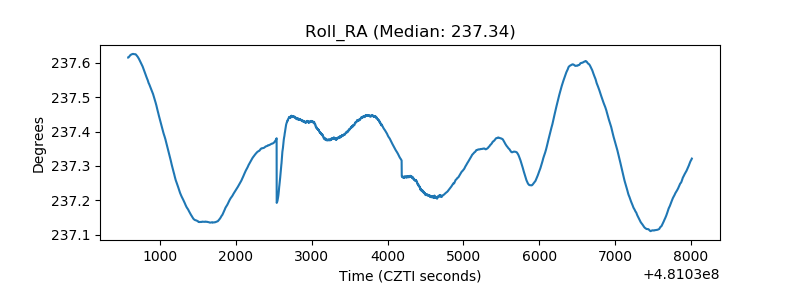 |
| Veto Counter | 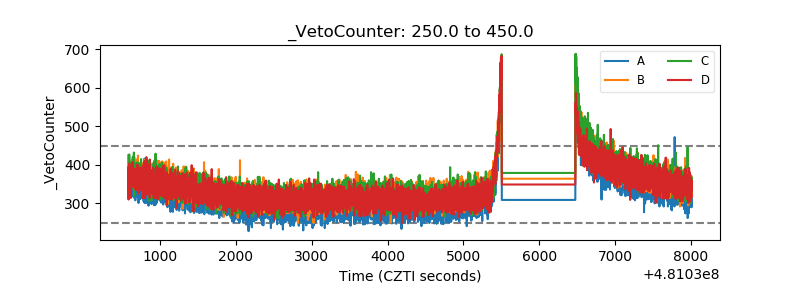 |