| Param | Original file | Final file |
|---|---|---|
| Filename | modeM0/AS1C07_001T03_9000006456_51406cztM0_level2.fits | modeM0/AS1C07_001T03_9000006456_51406cztM0_level2_quad_clean.evt |
| Size (bytes) | 601,102,080 | 91,036,800 |
| Size | 573.3 MB | 86.8 MB |
| Events in quadrant A | 7,004,461 | 557,860 |
| Events in quadrant B | 3,389,695 | 670,910 |
| Events in quadrant C | 7,070,174 | 529,349 |
| Events in quadrant D | 4,291,145 | 551,997 |
| Mode SS | |||
|---|---|---|---|
| Quadrant | BADHDUFLAG | Total packets | Discarded packets |
| A | 0 | 130 | 0 |
| B | 0 | 130 | 0 |
| C | 0 | 130 | 0 |
| D | 0 | 130 | 0 |
| Mode M0 | |||
|---|---|---|---|
| Quadrant | BADHDUFLAG | Total packets | Discarded packets |
| A | 0 | 25337 | 1 |
| B | 0 | 14493 | 1 |
| C | 0 | 25525 | 2 |
| D | 0 | 17196 | 1 |
| Mode M9 | |||
|---|---|---|---|
| Quadrant | BADHDUFLAG | Total packets | Discarded packets |
| A | 0 | 10 | 0 |
| B | 0 | 10 | 0 |
| C | 0 | 10 | 0 |
| D | 0 | 10 | 0 |
| Quadrant | Total seconds | Saturated seconds | Saturation percentage |
|---|---|---|---|
| A | 6395 | 869 | 13.588741% |
| B | 6396 | 151 | 2.360851% |
| C | 6395 | 1087 | 16.997654% |
| D | 6395 | 251 | 3.924941% |
Noise dominated data is calculated using 1-second bins in cleaned event files. If a bin has >2000 counts, and if more than 50% of those come from <1% of pixels, then it is considered to be noise-dominated and hence unusable.
| Quadrant | # 1 sec bins | Bins with >0 counts | Bins with >2000 counts | High rate bins dominated by noise | Noise dominated (total time) | Noise dominated (detector-on time) | Marked lightcurve |
|---|---|---|---|---|---|---|---|
| A | 7455 | 6396 | 730 | 730 | 9.79% | 11.41% | 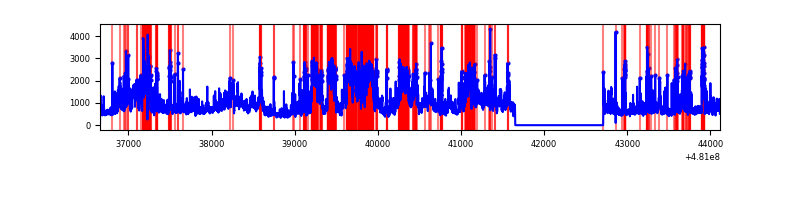 |
| B | 7456 | 6397 | 32 | 32 | 0.43% | 0.50% | 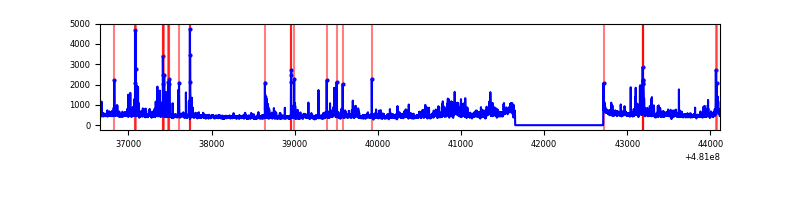 |
| C | 7455 | 6396 | 678 | 678 | 9.09% | 10.60% | 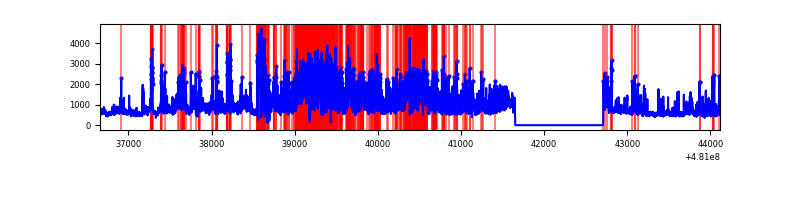 |
| D | 7455 | 6396 | 185 | 185 | 2.48% | 2.89% | 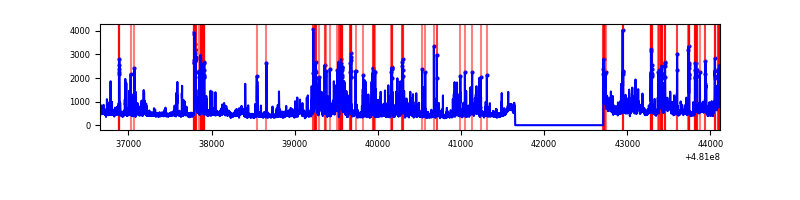 |
Top three noisy pixels from each quadrant. If the there are fewer than three noisy pixels in the level2.evt file, extra rows are filled as -1
| Pixel properties | Quadrant properties | ||||||
|---|---|---|---|---|---|---|---|
| Quadrant | DetID | PixID | Counts | Sigma | Mean | Median | Sigma |
| A | 12 | 250 | 1167828 | 7148.1 | 664 | 647 | 163.3 |
| A | 15 | 174 | 996596 | 6099.43 | 664 | 647 | 163.3 |
| A | 12 | 3 | 691055 | 4228.23 | 664 | 647 | 163.3 |
| B | 10 | 254 | 182436 | 1233.2 | 688 | 662 | 147.4 |
| B | 5 | 185 | 86686 | 583.61 | 688 | 662 | 147.4 |
| B | 6 | 51 | 53855 | 360.87 | 688 | 662 | 147.4 |
| C | 15 | 179 | 2160676 | 12372.95 | 638 | 631 | 174.6 |
| C | 12 | 247 | 774812 | 4434.58 | 638 | 631 | 174.6 |
| C | 12 | 252 | 511031 | 2923.62 | 638 | 631 | 174.6 |
| D | 8 | 176 | 502132 | 2697.8 | 669 | 644 | 185.9 |
| D | 2 | 216 | 370986 | 1992.28 | 669 | 644 | 185.9 |
| D | 10 | 172 | 244500 | 1311.84 | 669 | 644 | 185.9 |
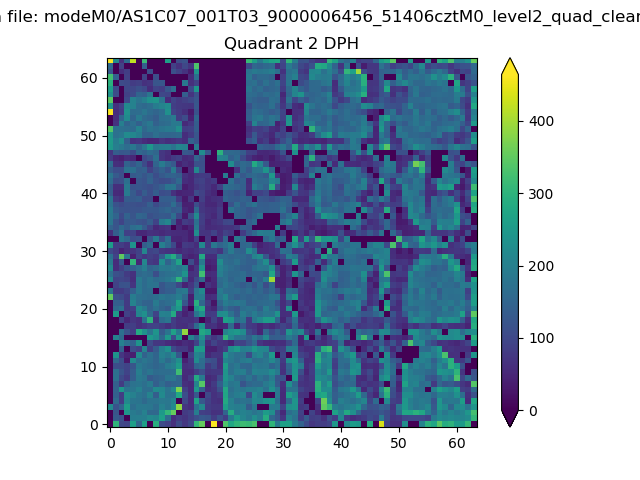
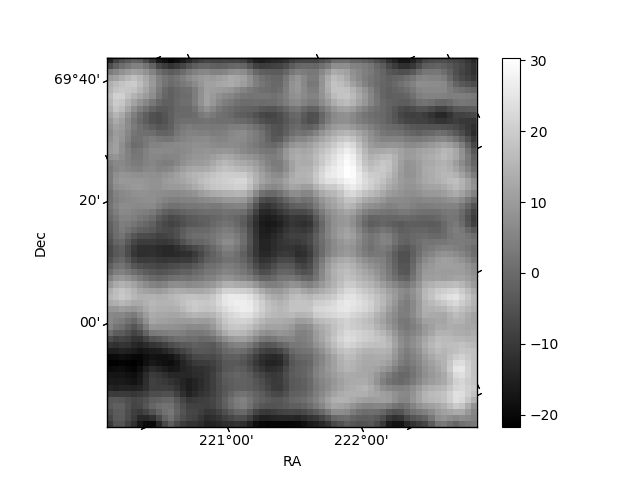
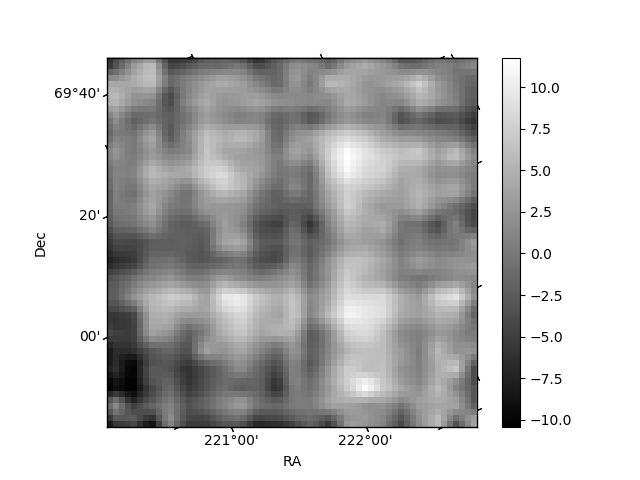
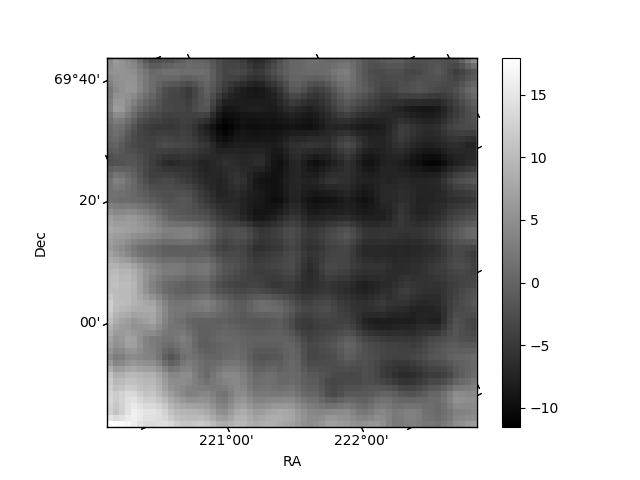
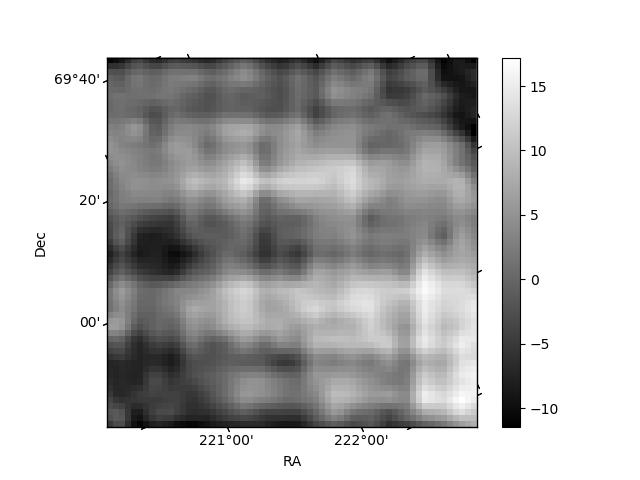
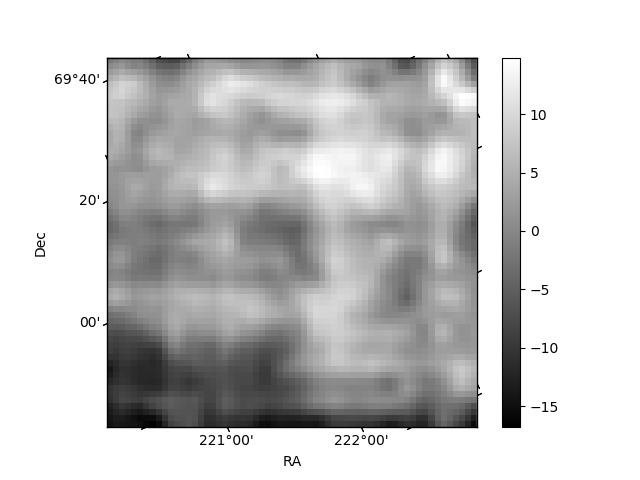
Histogram calculated using DETX and DETY for each event in the final _common_clean file
| Quadrant A | 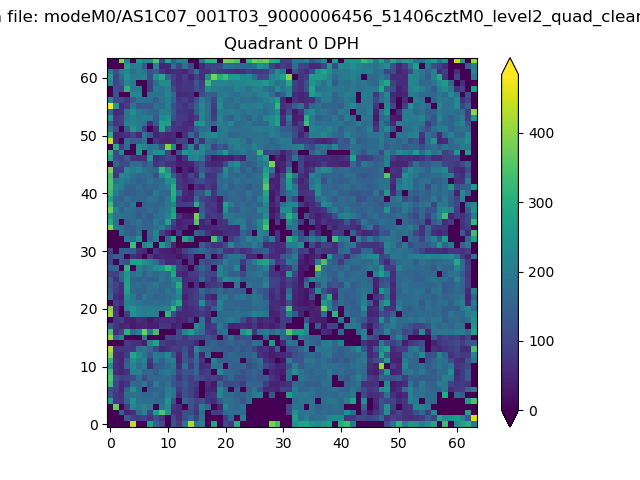 |
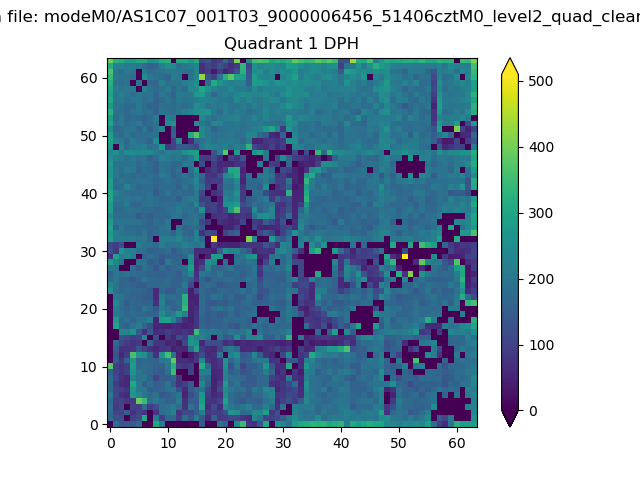 |
Quadrant B |
|---|---|---|---|
| Quadrant D | 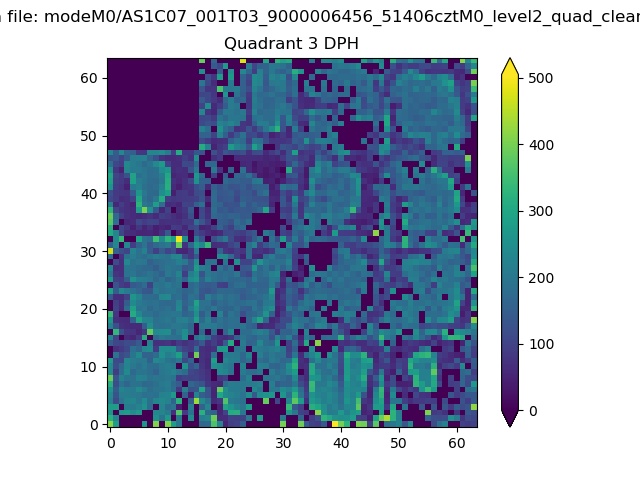 |
 |
Quadrant C |
| Plot type | Count rate plots | Images |
|---|---|---|
| Comparison with Poisson distribution Blue bars denote a histogram of data divided into 1 sec bins. Red curve is a Poisson curve with rate = median count rate of data. |
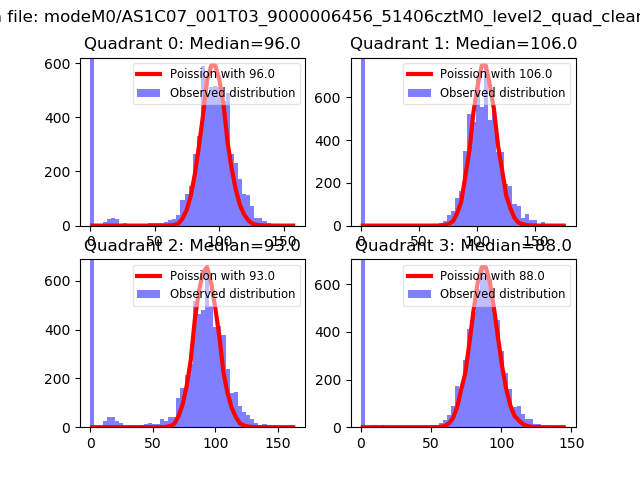 |
 |
| Quadrant-wise count rates Data is divided into 100 sec bins |
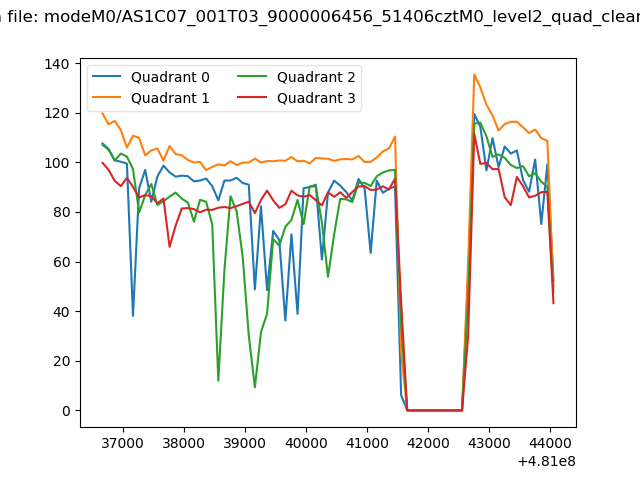 |
|
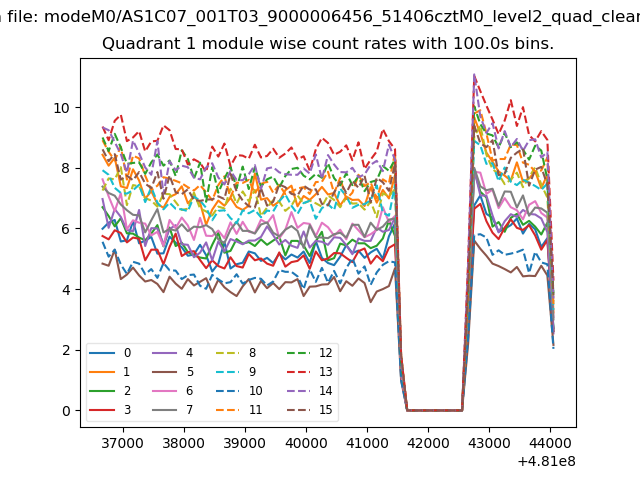
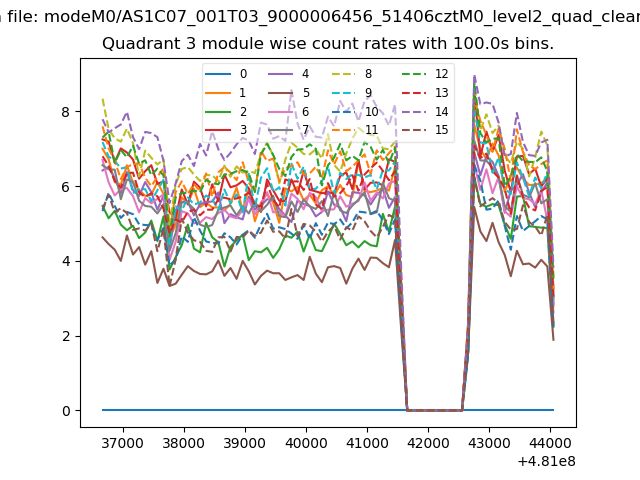
| Module-wise count rates for Quadrant A Data is divided into 100 sec bins |
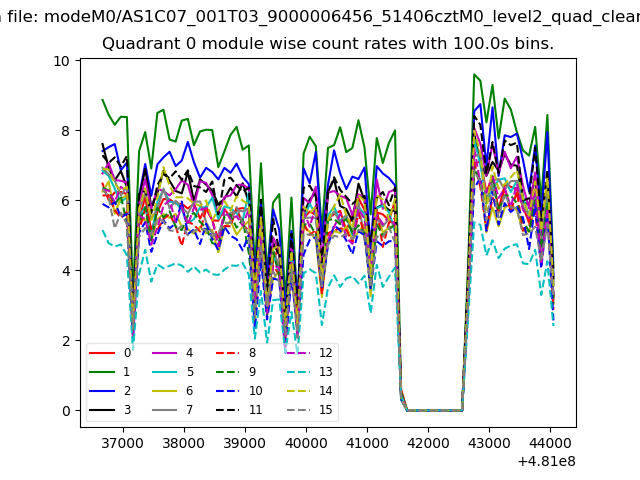 |
 |
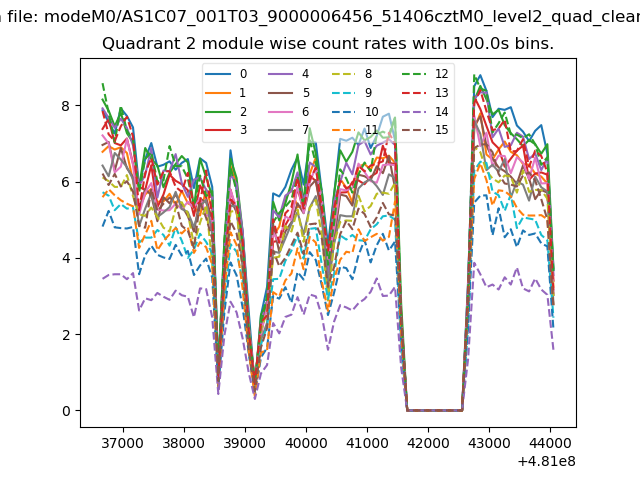
| Module-wise count rates for Quadrant B Data is divided into 100 sec bins |
 |
 |
| Module-wise count rates for Quadrant C Data is divided into 100 sec bins |
 |
 |
| Module-wise count rates for Quadrant D Data is divided into 100 sec bins |
 |
 |
| Parameter | Plot |
|---|---|
| CZT HV Monitor | 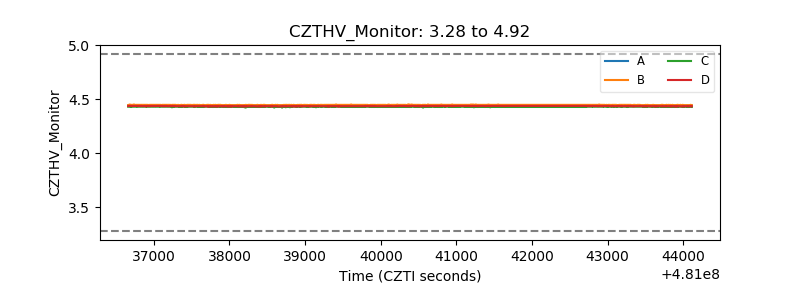 |
| D_VDD |  |
| Temperature 1 |  |
| Veto HV Monitor | 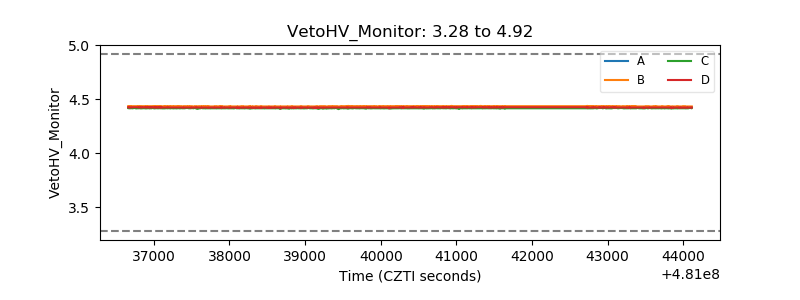 |
| Veto LLD | 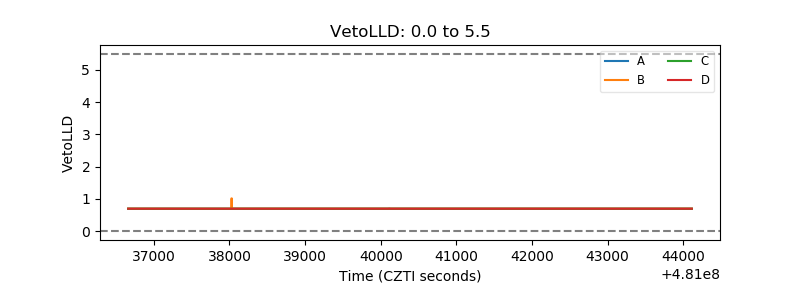 |
| Alpha Counter | 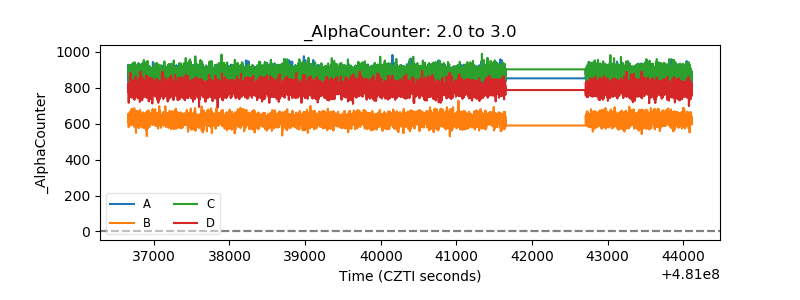 |
| _CPM_Rate | 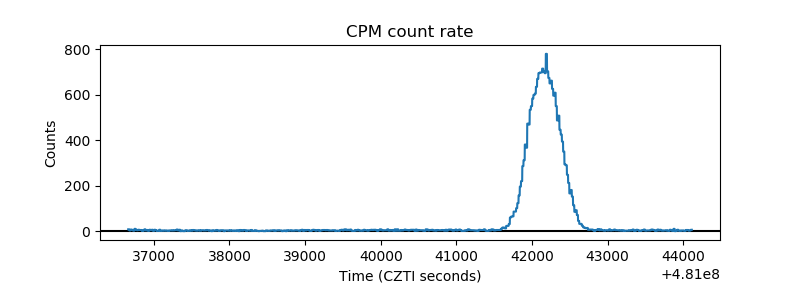 |
| CZT Counter | 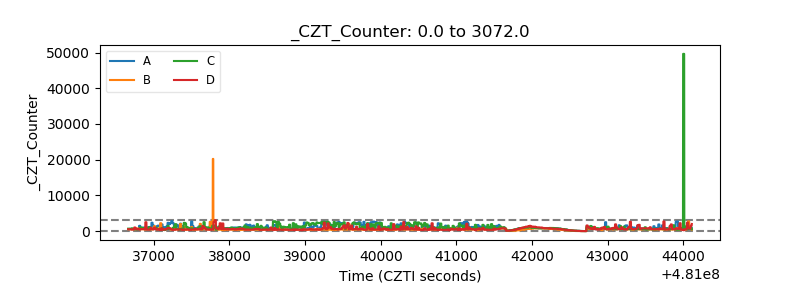 |
| +2.5 Volts monitor | 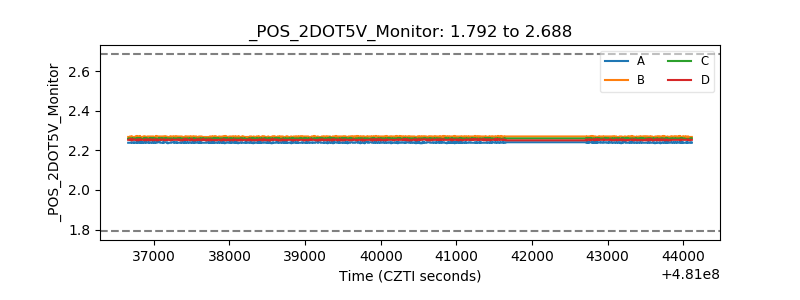 |
| +5 Volts monitor | 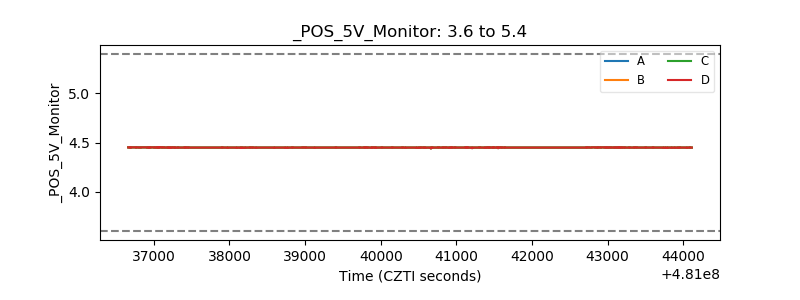 |
| _ROLL_ROT | 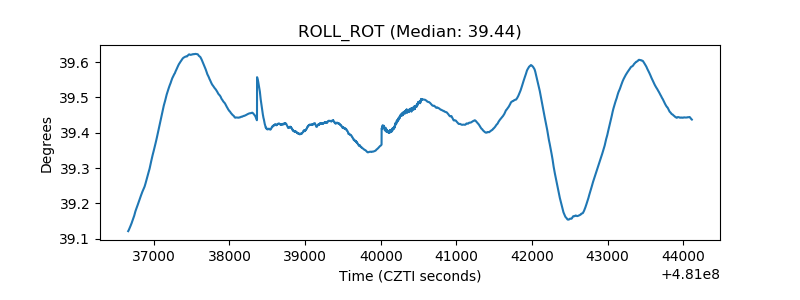 |
| _Roll_DEC | 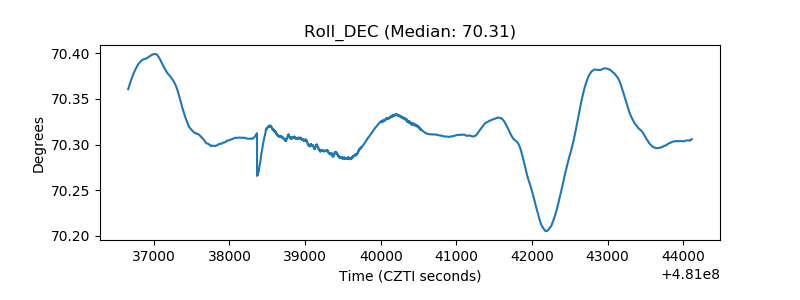 |
| _Roll_RA | 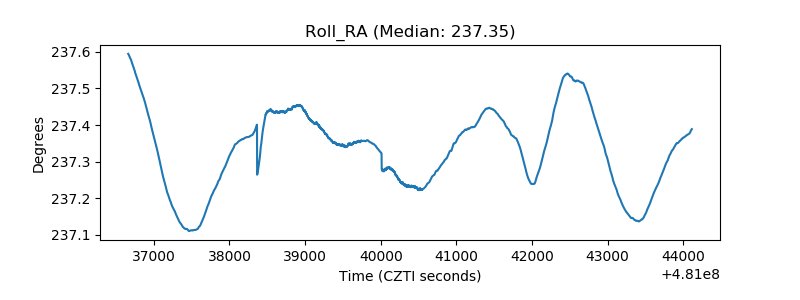 |
| Veto Counter | 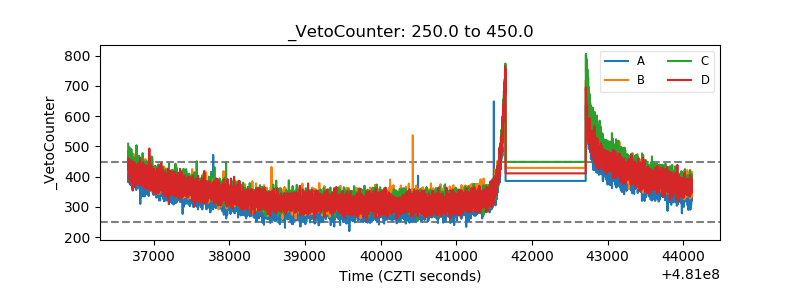 |