| Param | Original file | Final file |
|---|---|---|
| Filename | modeM0/AS1C07_001T03_9000006456_51407cztM0_level2.fits | modeM0/AS1C07_001T03_9000006456_51407cztM0_level2_quad_clean.evt |
| Size (bytes) | 629,789,760 | 94,230,720 |
| Size | 600.6 MB | 89.9 MB |
| Events in quadrant A | 5,465,790 | 615,344 |
| Events in quadrant B | 4,304,030 | 700,304 |
| Events in quadrant C | 7,307,138 | 540,112 |
| Events in quadrant D | 5,733,155 | 544,518 |
| Mode SS | |||
|---|---|---|---|
| Quadrant | BADHDUFLAG | Total packets | Discarded packets |
| A | 0 | 132 | 0 |
| B | 0 | 132 | 0 |
| C | 0 | 132 | 0 |
| D | 0 | 132 | 0 |
| Mode M0 | |||
|---|---|---|---|
| Quadrant | BADHDUFLAG | Total packets | Discarded packets |
| A | 0 | 20782 | 2 |
| B | 0 | 17143 | 2 |
| C | 0 | 26141 | 6 |
| D | 0 | 21586 | 2 |
| Mode M9 | |||
|---|---|---|---|
| Quadrant | BADHDUFLAG | Total packets | Discarded packets |
| A | 0 | 18 | 0 |
| B | 0 | 19 | 0 |
| C | 0 | 19 | 0 |
| D | 0 | 19 | 0 |
| Quadrant | Total seconds | Saturated seconds | Saturation percentage |
|---|---|---|---|
| A | 6491 | 497 | 7.656756% |
| B | 6491 | 216 | 3.327684% |
| C | 6490 | 1272 | 19.599384% |
| D | 6490 | 667 | 10.277350% |
Noise dominated data is calculated using 1-second bins in cleaned event files. If a bin has >2000 counts, and if more than 50% of those come from <1% of pixels, then it is considered to be noise-dominated and hence unusable.
| Quadrant | # 1 sec bins | Bins with >0 counts | Bins with >2000 counts | High rate bins dominated by noise | Noise dominated (total time) | Noise dominated (detector-on time) | Marked lightcurve |
|---|---|---|---|---|---|---|---|
| A | 7651 | 6492 | 333 | 333 | 4.35% | 5.13% | 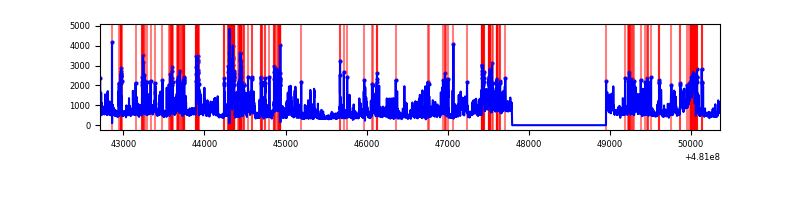 |
| B | 7651 | 6492 | 55 | 55 | 0.72% | 0.85% | 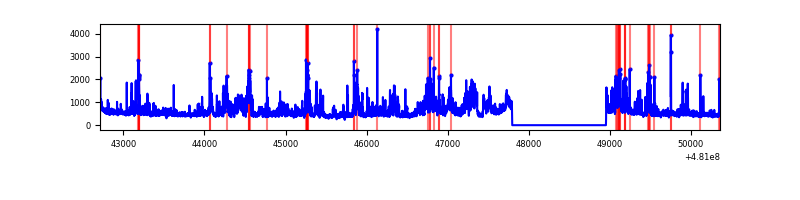 |
| C | 7650 | 6491 | 927 | 927 | 12.12% | 14.28% | 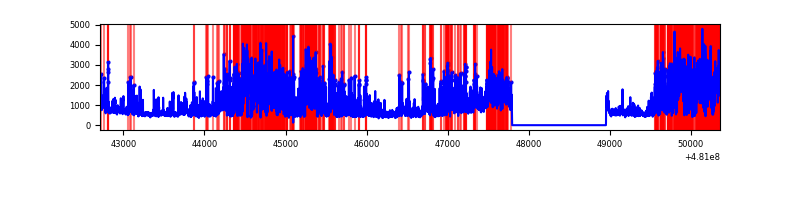 |
| D | 7650 | 6491 | 591 | 591 | 7.73% | 9.10% | 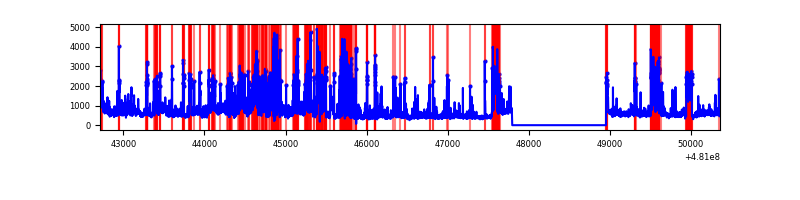 |
Top three noisy pixels from each quadrant. If the there are fewer than three noisy pixels in the level2.evt file, extra rows are filled as -1
| Pixel properties | Quadrant properties | ||||||
|---|---|---|---|---|---|---|---|
| Quadrant | DetID | PixID | Counts | Sigma | Mean | Median | Sigma |
| A | 4 | 175 | 557114 | 3212.74 | 701 | 684 | 173.2 |
| A | 8 | 249 | 541539 | 3122.81 | 701 | 684 | 173.2 |
| A | 15 | 174 | 479623 | 2765.32 | 701 | 684 | 173.2 |
| B | 10 | 254 | 754682 | 5080.14 | 709 | 684 | 148.4 |
| B | 5 | 172 | 131823 | 883.56 | 709 | 684 | 148.4 |
| B | 5 | 185 | 102641 | 686.95 | 709 | 684 | 148.4 |
| C | 15 | 179 | 2100753 | 11695.78 | 657 | 651 | 179.6 |
| C | 4 | 12 | 1097147 | 6106.55 | 657 | 651 | 179.6 |
| C | 10 | 171 | 438369 | 2437.72 | 657 | 651 | 179.6 |
| D | 3 | 12 | 1393214 | 7380.48 | 677 | 652 | 188.7 |
| D | 8 | 176 | 841442 | 4456.13 | 677 | 652 | 188.7 |
| D | 2 | 216 | 287317 | 1519.31 | 677 | 652 | 188.7 |
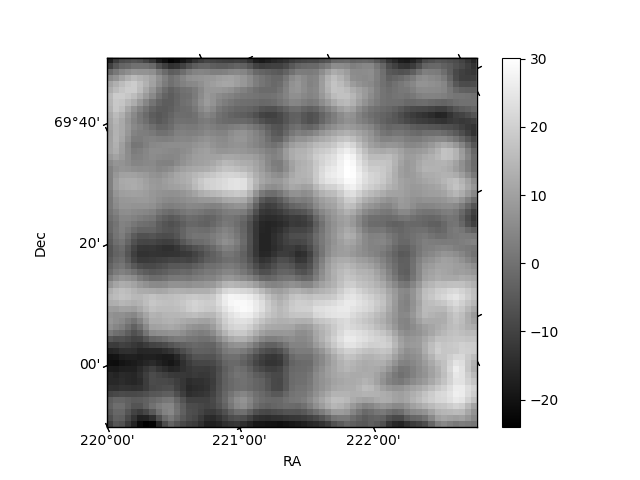
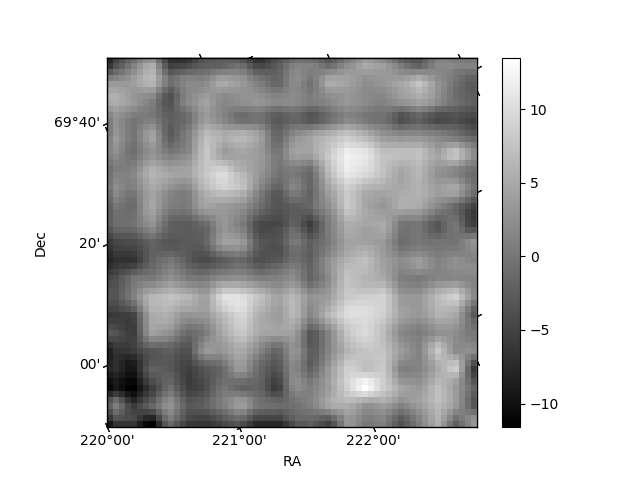
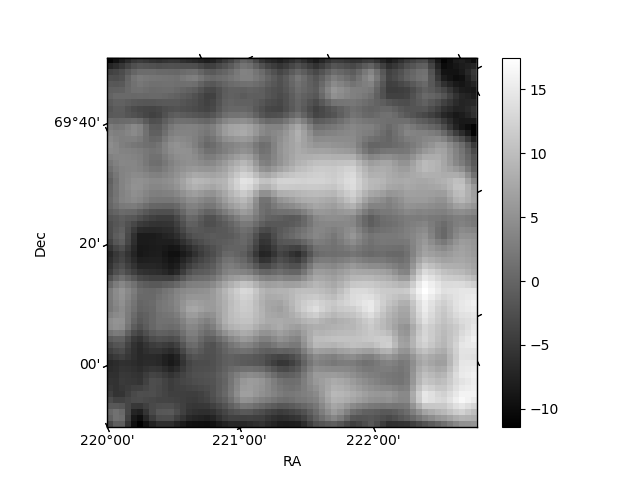
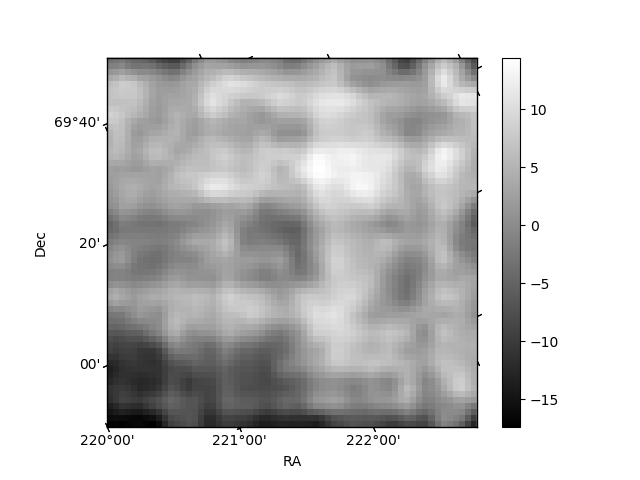
Histogram calculated using DETX and DETY for each event in the final _common_clean file
| Quadrant A | 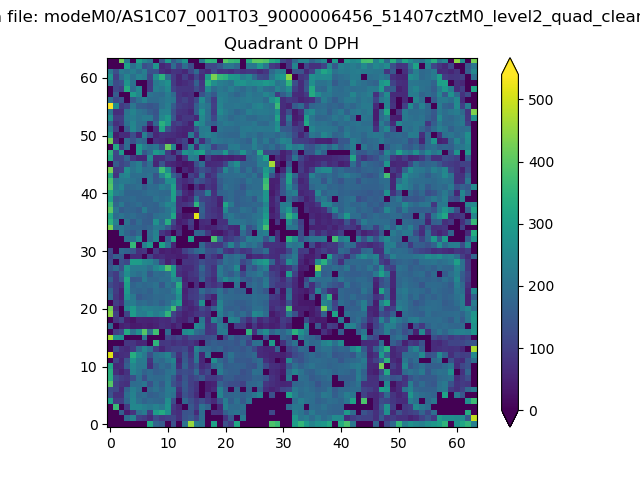 |
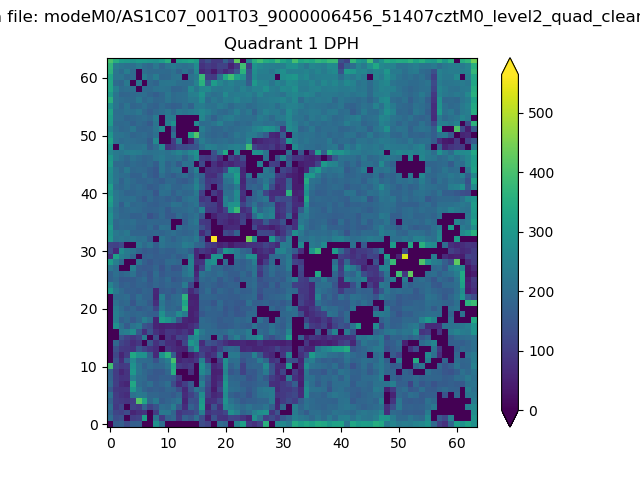 |
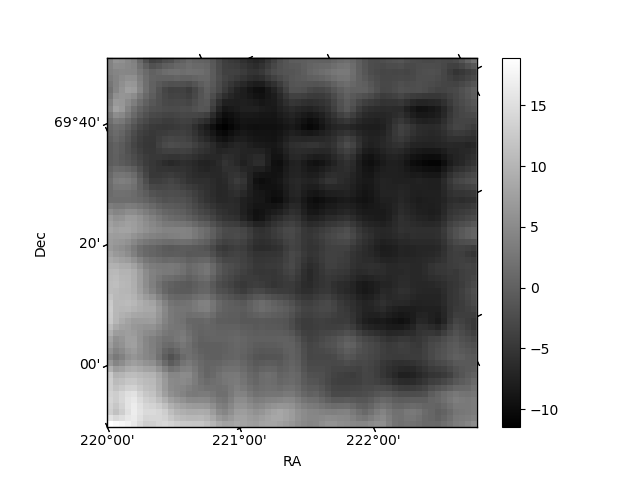
Quadrant B |
|---|---|---|---|
| Quadrant D | 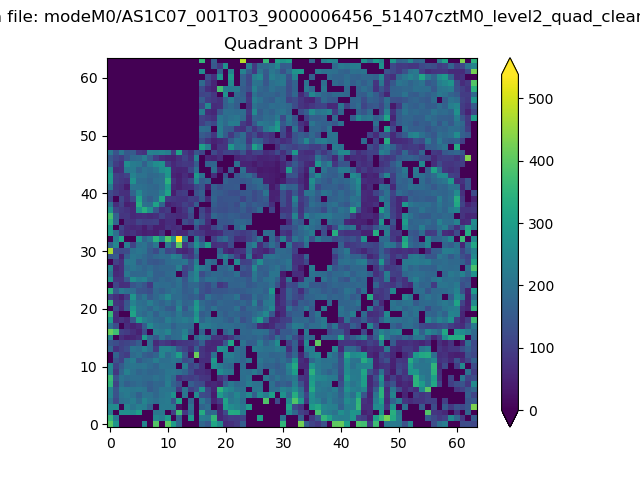 |
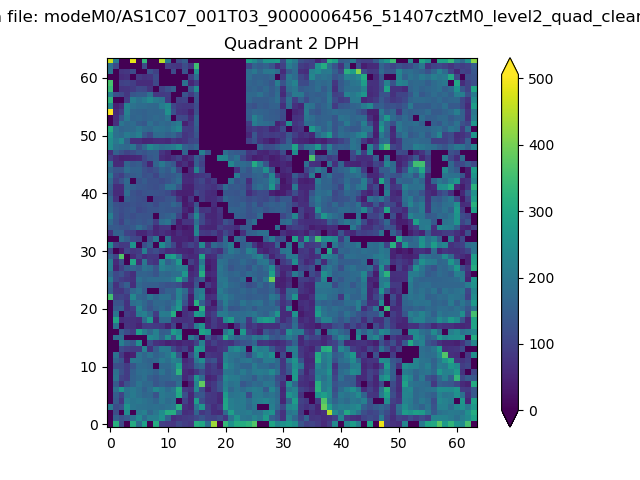 |
Quadrant C |
| Plot type | Count rate plots | Images |
|---|---|---|
| Comparison with Poisson distribution Blue bars denote a histogram of data divided into 1 sec bins. Red curve is a Poisson curve with rate = median count rate of data. |
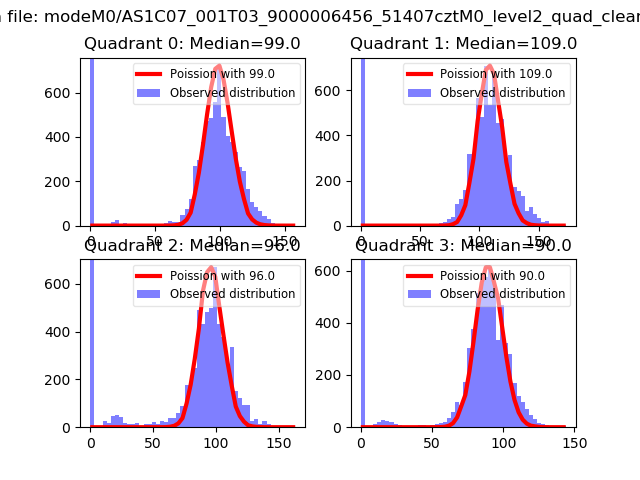 |
 |
| Quadrant-wise count rates Data is divided into 100 sec bins |
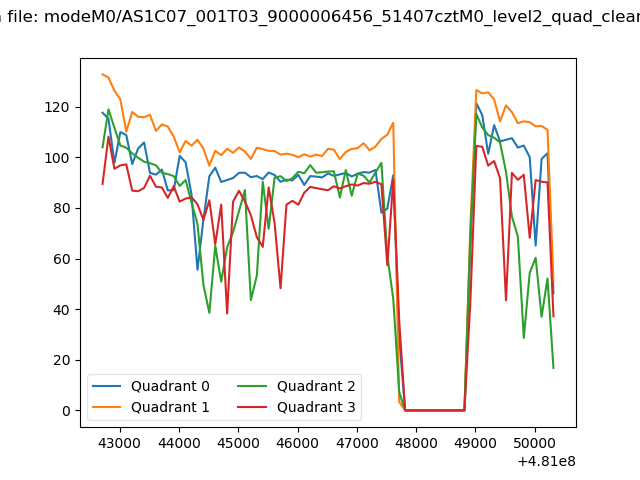 |
|
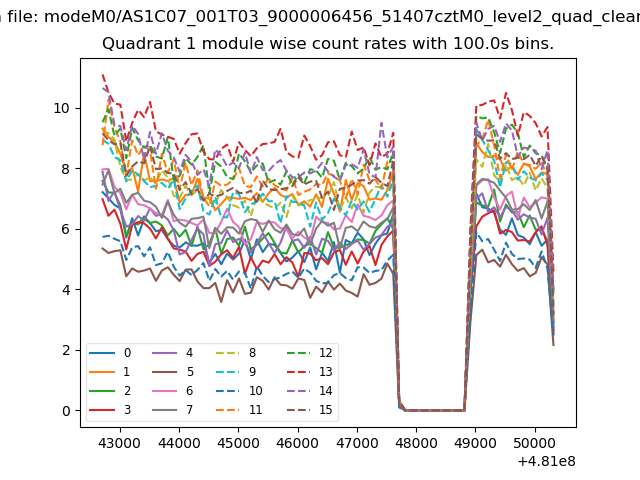
| Module-wise count rates for Quadrant A Data is divided into 100 sec bins |
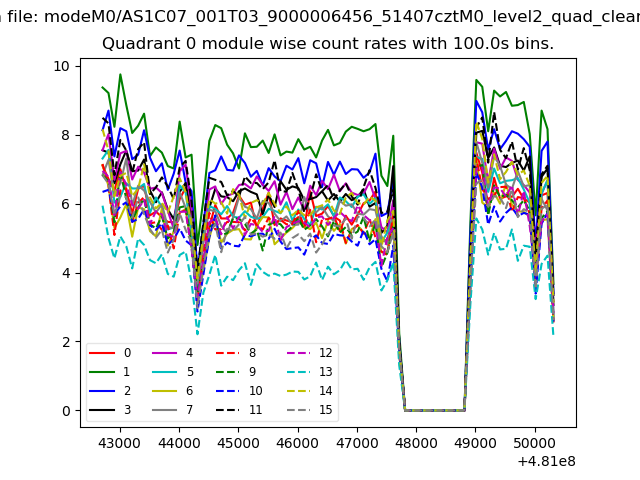 |
 |
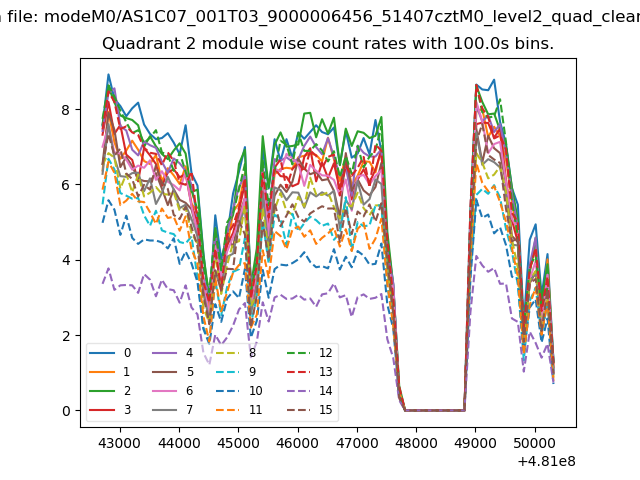
| Module-wise count rates for Quadrant B Data is divided into 100 sec bins |
 |
 |
| Module-wise count rates for Quadrant C Data is divided into 100 sec bins |
 |
 |
| Module-wise count rates for Quadrant D Data is divided into 100 sec bins |
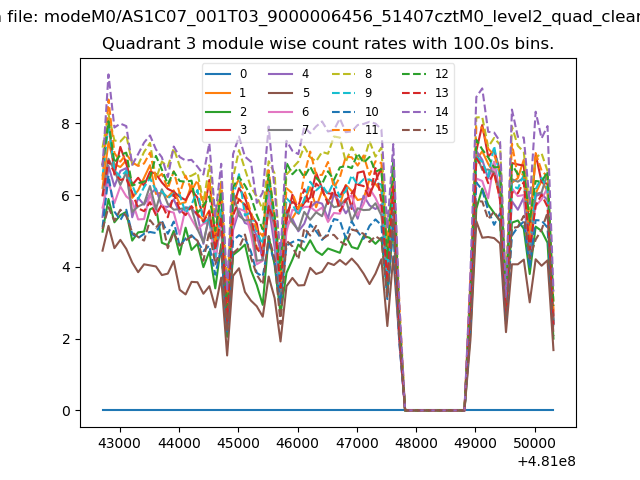 |
 |
| Parameter | Plot |
|---|---|
| CZT HV Monitor | 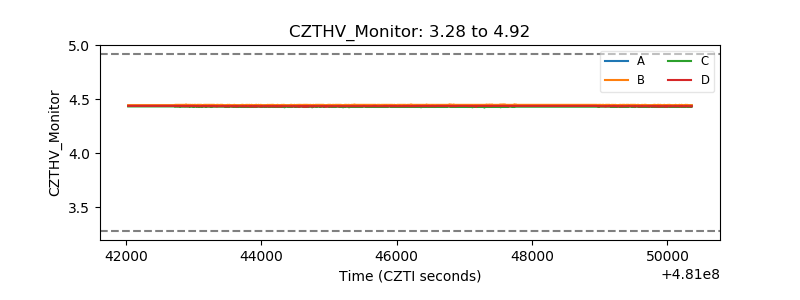 |
| D_VDD | 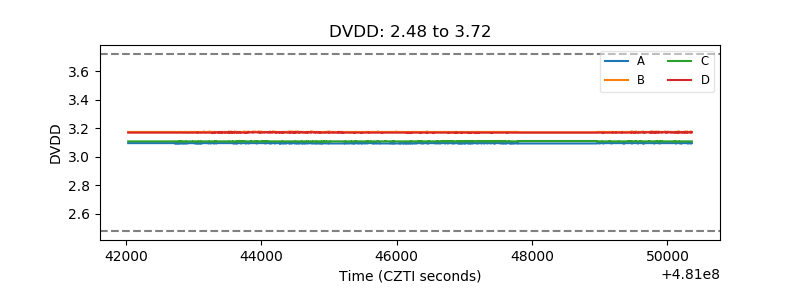 |
| Temperature 1 | 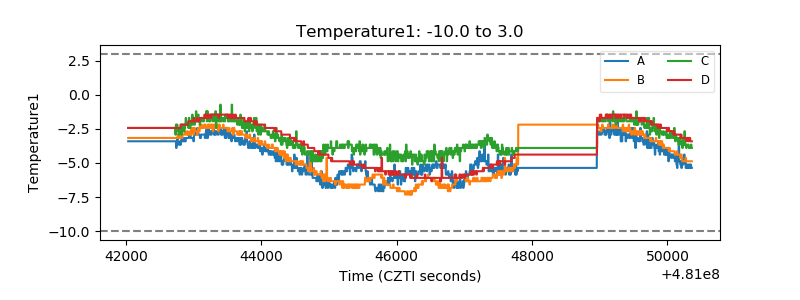 |
| Veto HV Monitor | 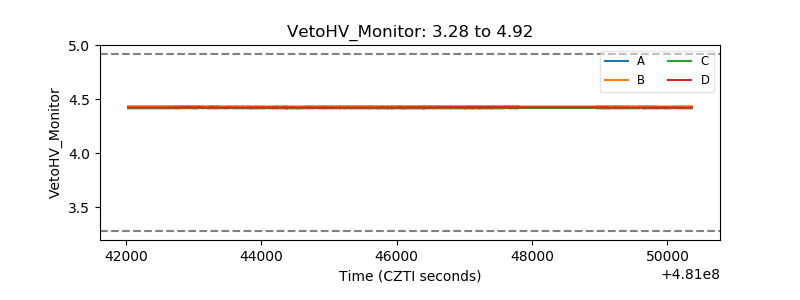 |
| Veto LLD | 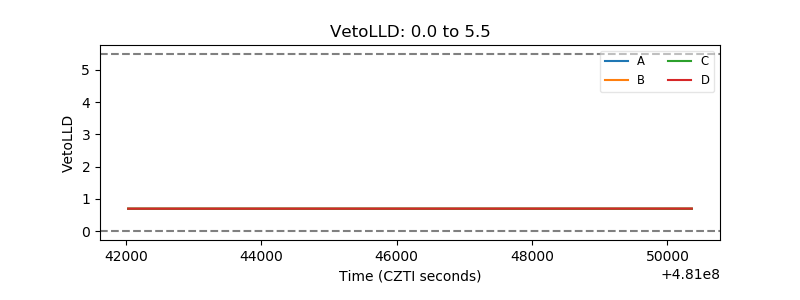 |
| Alpha Counter | 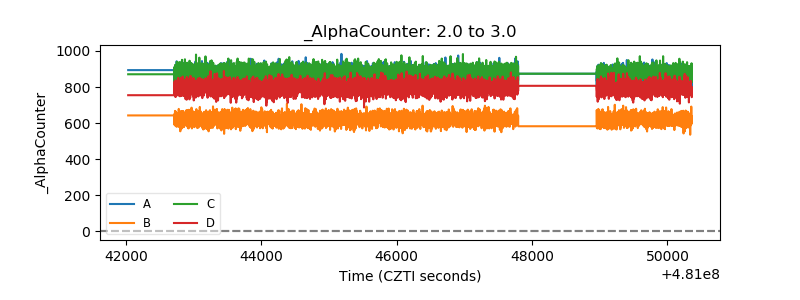 |
| _CPM_Rate | 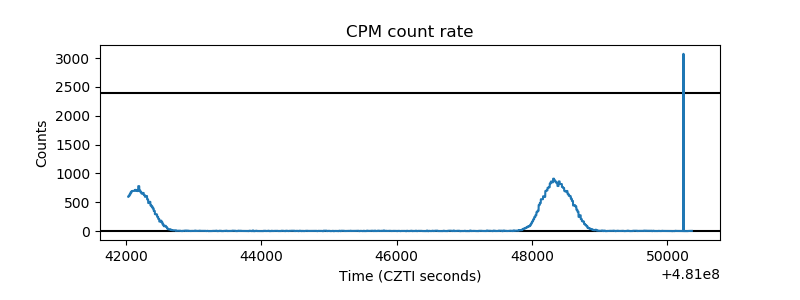 |
| CZT Counter | 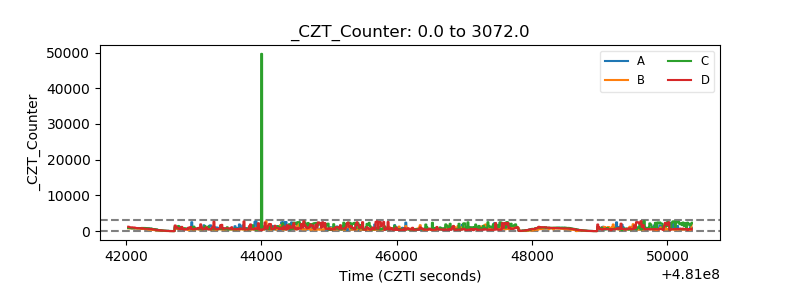 |
| +2.5 Volts monitor | 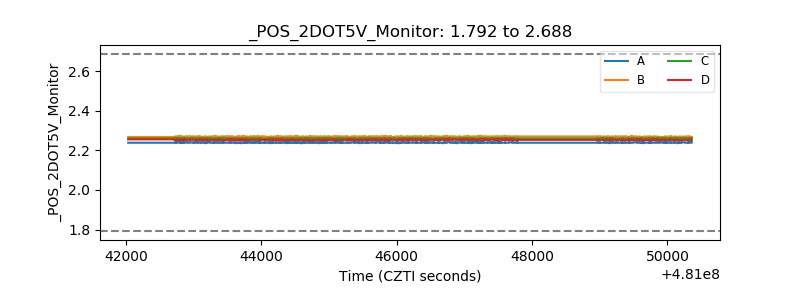 |
| +5 Volts monitor | 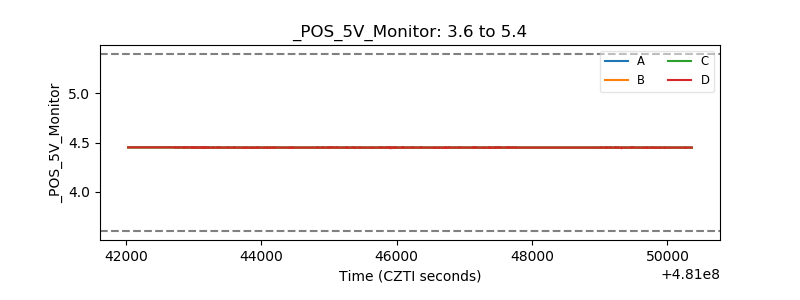 |
| _ROLL_ROT | 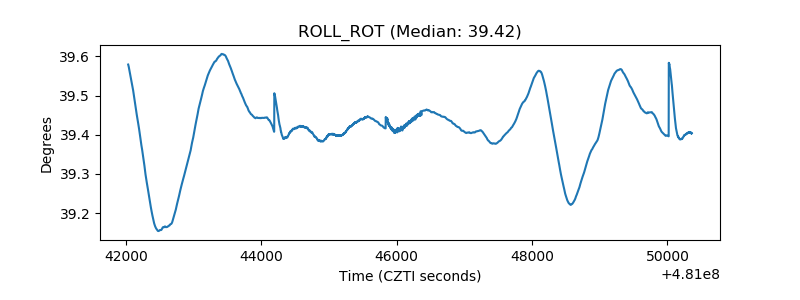 |
| _Roll_DEC | 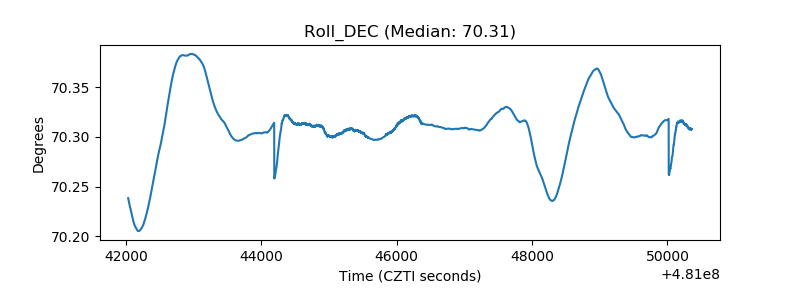 |
| _Roll_RA | 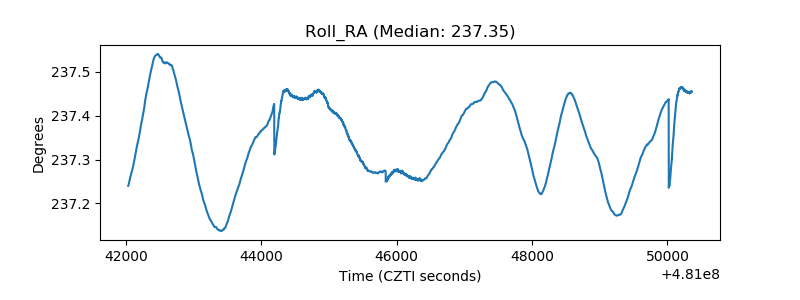 |
| Veto Counter | 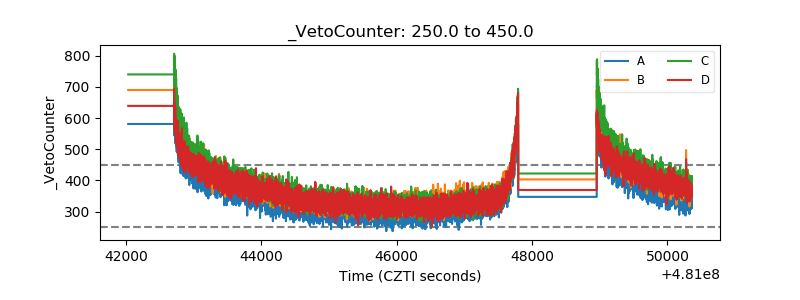 |