| Param | Original file | Final file |
|---|---|---|
| Filename | modeM0/AS1C07_001T03_9000006456_51409cztM0_level2.fits | modeM0/AS1C07_001T03_9000006456_51409cztM0_level2_quad_clean.evt |
| Size (bytes) | 627,762,240 | 88,905,600 |
| Size | 598.7 MB | 84.8 MB |
| Events in quadrant A | 5,357,575 | 596,292 |
| Events in quadrant B | 4,232,245 | 660,579 |
| Events in quadrant C | 9,097,964 | 426,407 |
| Events in quadrant D | 4,053,533 | 562,054 |
| Mode SS | |||
|---|---|---|---|
| Quadrant | BADHDUFLAG | Total packets | Discarded packets |
| A | 0 | 130 | 0 |
| B | 0 | 130 | 0 |
| C | 0 | 130 | 0 |
| D | 0 | 130 | 0 |
| Mode M0 | |||
|---|---|---|---|
| Quadrant | BADHDUFLAG | Total packets | Discarded packets |
| A | 0 | 20267 | 1 |
| B | 0 | 17002 | 1 |
| C | 0 | 31339 | 1 |
| D | 0 | 16626 | 1 |
| Mode M9 | |||
|---|---|---|---|
| Quadrant | BADHDUFLAG | Total packets | Discarded packets |
| A | 0 | 11 | 0 |
| B | 0 | 11 | 0 |
| C | 0 | 11 | 0 |
| D | 0 | 11 | 0 |
| Quadrant | Total seconds | Saturated seconds | Saturation percentage |
|---|---|---|---|
| A | 6402 | 448 | 6.997813% |
| B | 6403 | 360 | 5.622365% |
| C | 6402 | 2220 | 34.676664% |
| D | 6402 | 277 | 4.326773% |
Noise dominated data is calculated using 1-second bins in cleaned event files. If a bin has >2000 counts, and if more than 50% of those come from <1% of pixels, then it is considered to be noise-dominated and hence unusable.
| Quadrant | # 1 sec bins | Bins with >0 counts | Bins with >2000 counts | High rate bins dominated by noise | Noise dominated (total time) | Noise dominated (detector-on time) | Marked lightcurve |
|---|---|---|---|---|---|---|---|
| A | 7492 | 6403 | 261 | 261 | 3.48% | 4.08% | 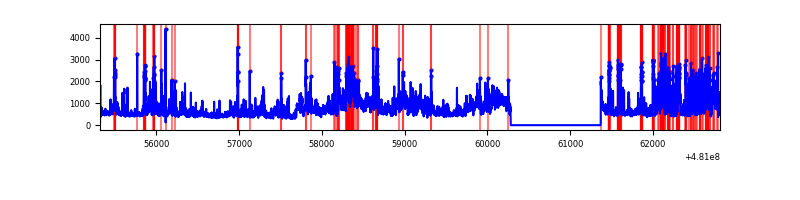 |
| B | 7493 | 6404 | 161 | 161 | 2.15% | 2.51% | 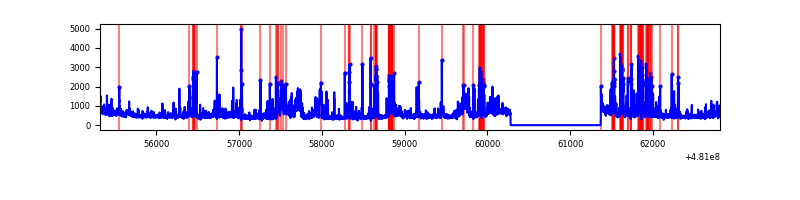 |
| C | 7492 | 6403 | 1798 | 1798 | 24.00% | 28.08% | 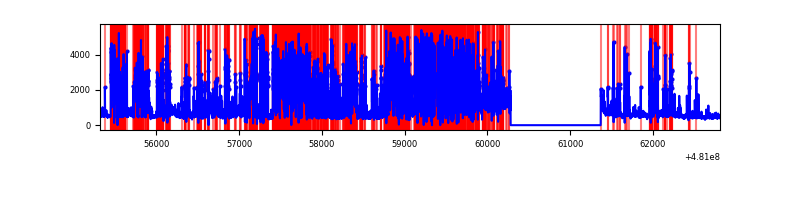 |
| D | 7492 | 6403 | 216 | 216 | 2.88% | 3.37% | 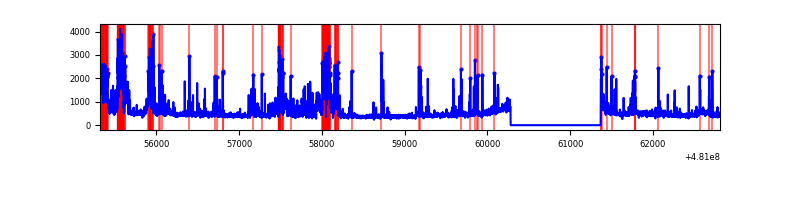 |
Top three noisy pixels from each quadrant. If the there are fewer than three noisy pixels in the level2.evt file, extra rows are filled as -1
| Pixel properties | Quadrant properties | ||||||
|---|---|---|---|---|---|---|---|
| Quadrant | DetID | PixID | Counts | Sigma | Mean | Median | Sigma |
| A | 12 | 3 | 932657 | 5662.29 | 669 | 651 | 164.6 |
| A | 4 | 175 | 538042 | 3264.85 | 669 | 651 | 164.6 |
| A | 15 | 174 | 288541 | 1749.04 | 669 | 651 | 164.6 |
| B | 6 | 51 | 611682 | 4278.51 | 675 | 654 | 142.8 |
| B | 5 | 172 | 456053 | 3188.77 | 675 | 654 | 142.8 |
| B | 5 | 185 | 86921 | 604.06 | 675 | 654 | 142.8 |
| C | 4 | 12 | 5549400 | 36064.19 | 552 | 547 | 153.9 |
| C | 15 | 179 | 300774 | 1951.29 | 552 | 547 | 153.9 |
| C | 12 | 250 | 203480 | 1318.94 | 552 | 547 | 153.9 |
| D | 8 | 176 | 546669 | 2901.49 | 664 | 638 | 188.2 |
| D | 6 | 42 | 404137 | 2144.11 | 664 | 638 | 188.2 |
| D | 15 | 108 | 98994 | 522.64 | 664 | 638 | 188.2 |
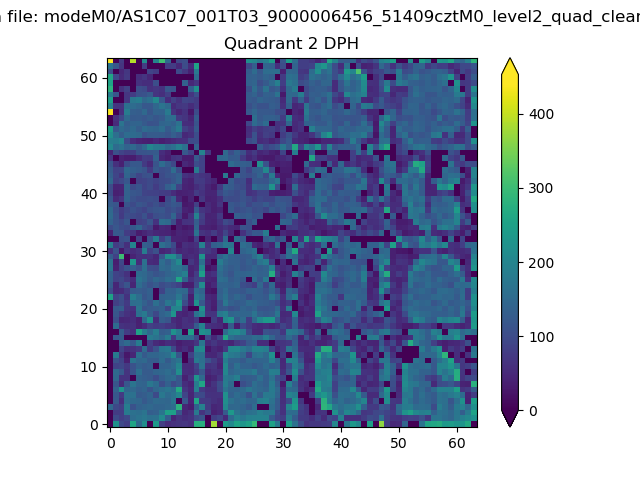
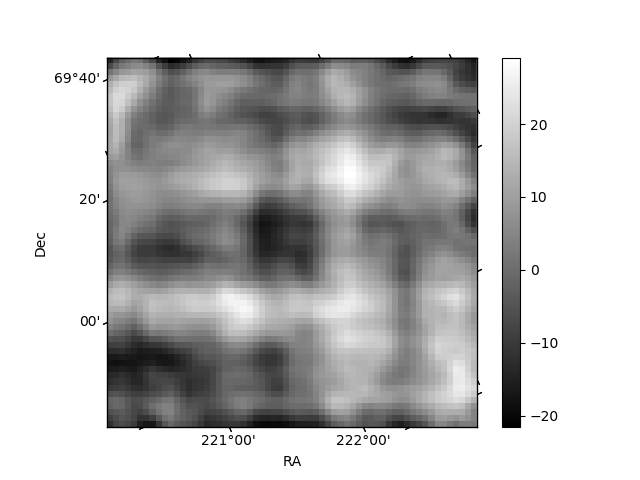
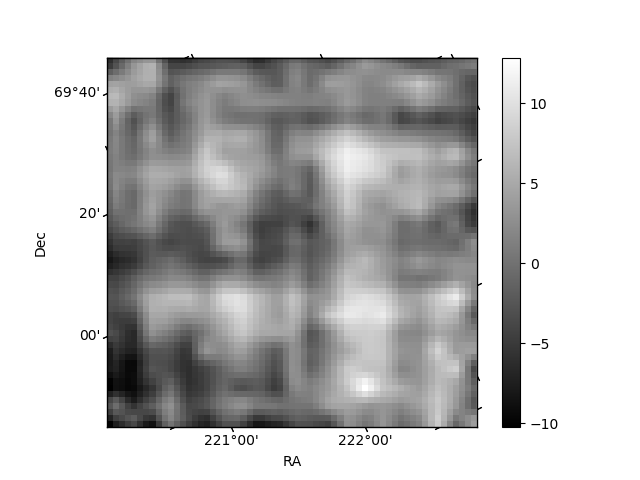
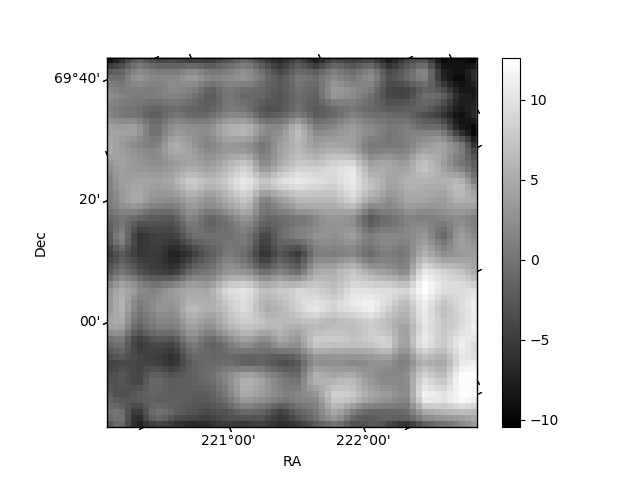
Histogram calculated using DETX and DETY for each event in the final _common_clean file
| Quadrant A | 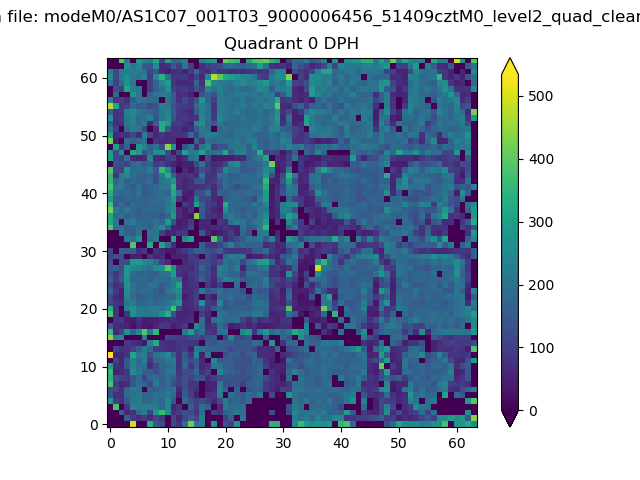 |
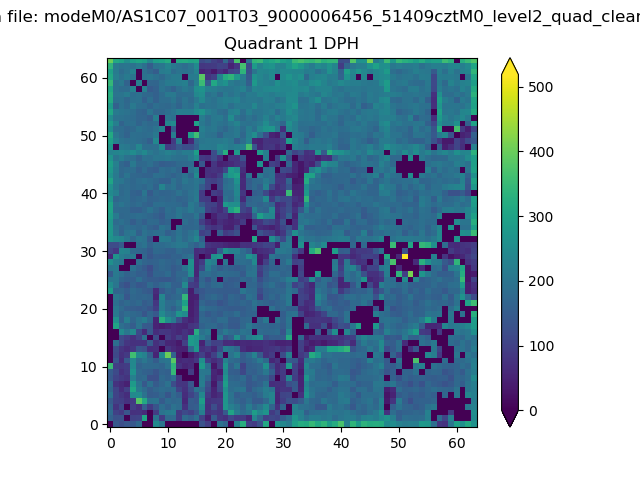 |
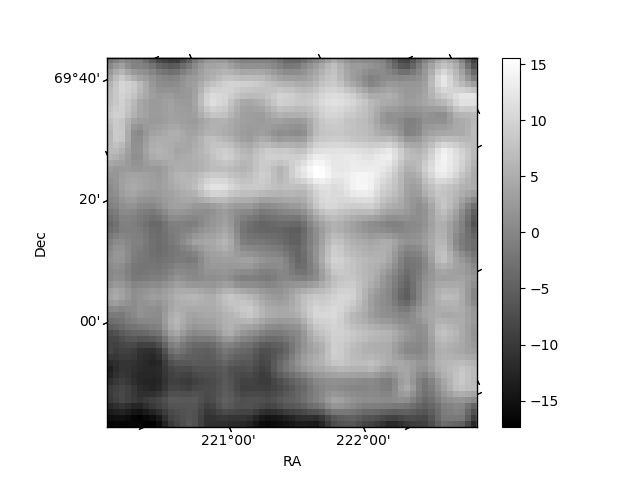
Quadrant B |
|---|---|---|---|
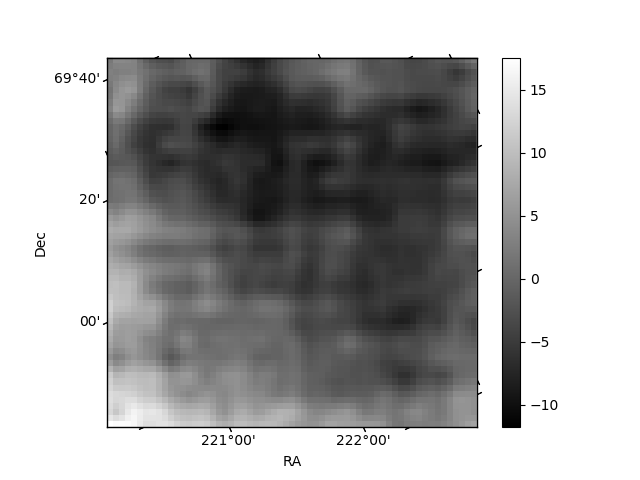
| Quadrant D | 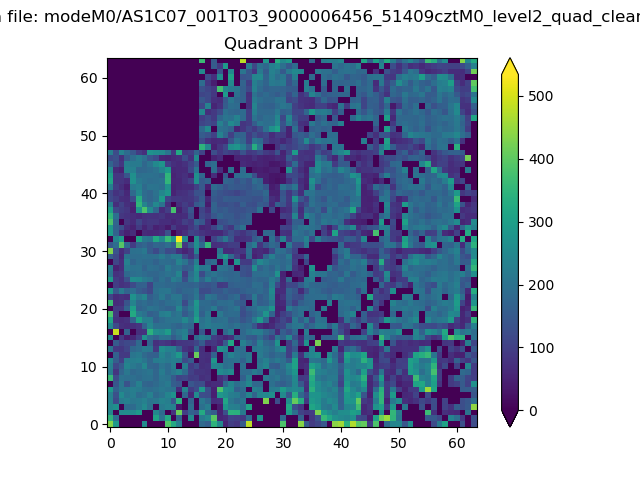 |
 |
Quadrant C |
| Plot type | Count rate plots | Images |
|---|---|---|
| Comparison with Poisson distribution Blue bars denote a histogram of data divided into 1 sec bins. Red curve is a Poisson curve with rate = median count rate of data. |
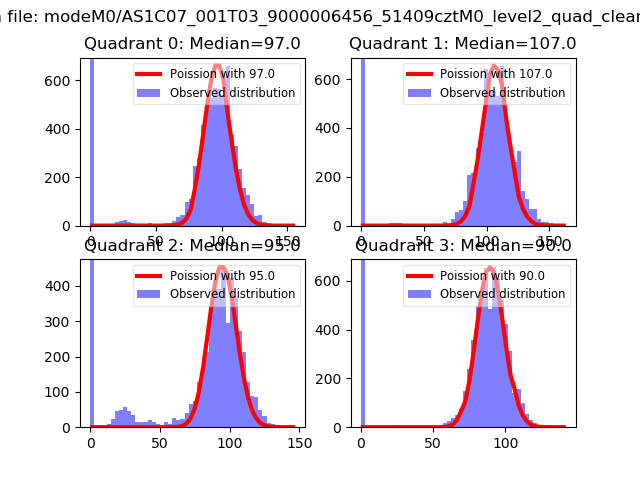 |
 |
| Quadrant-wise count rates Data is divided into 100 sec bins |
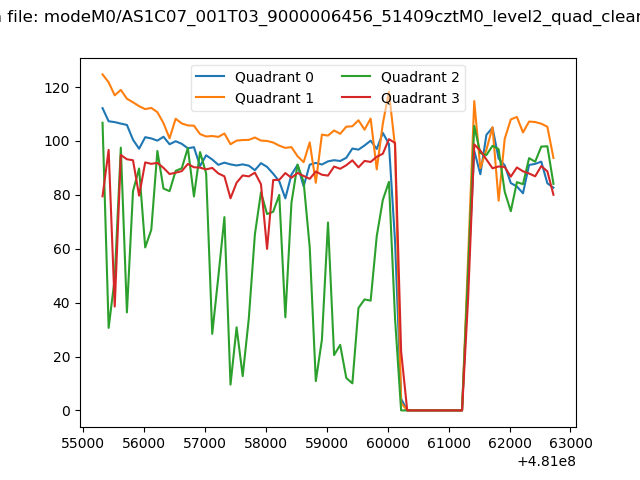 |
|
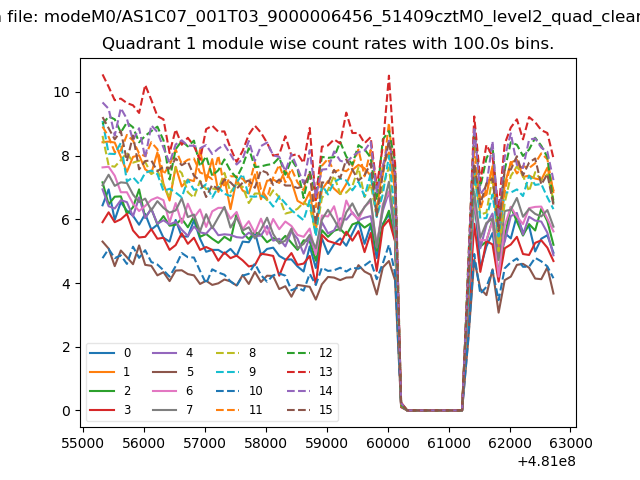
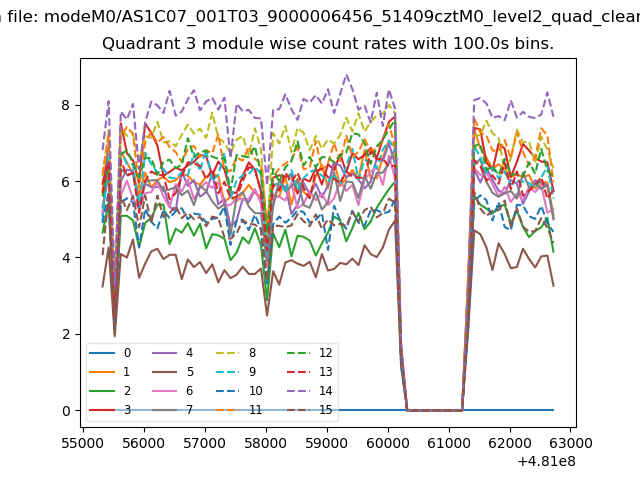
| Module-wise count rates for Quadrant A Data is divided into 100 sec bins |
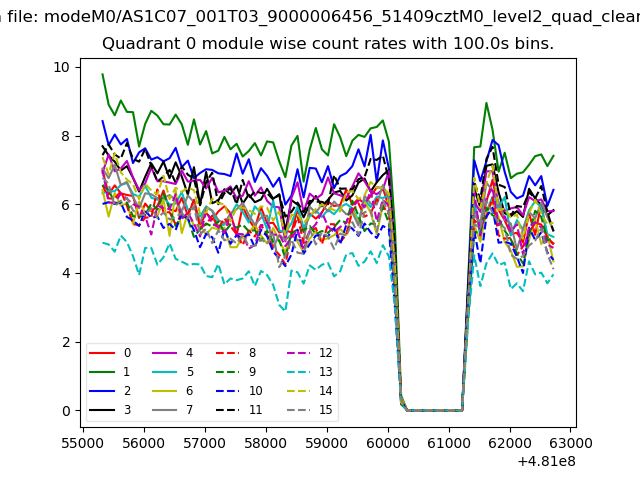 |
 |
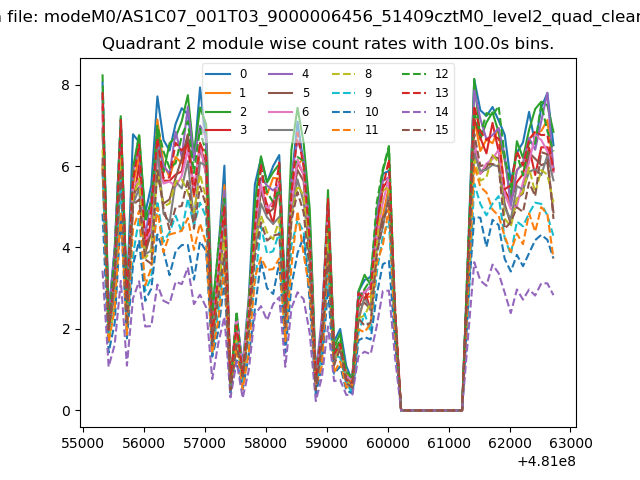
| Module-wise count rates for Quadrant B Data is divided into 100 sec bins |
 |
 |
| Module-wise count rates for Quadrant C Data is divided into 100 sec bins |
 |
 |
| Module-wise count rates for Quadrant D Data is divided into 100 sec bins |
 |
 |
| Parameter | Plot |
|---|---|
| CZT HV Monitor | 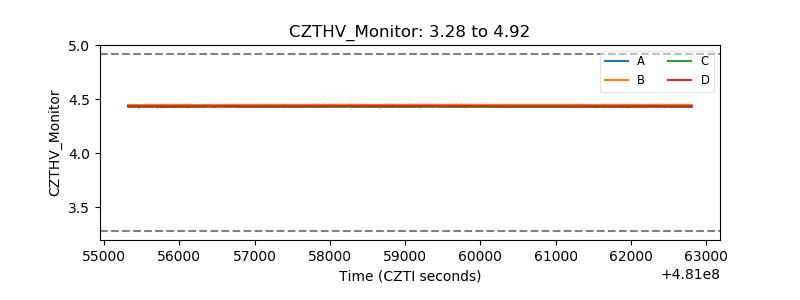 |
| D_VDD | 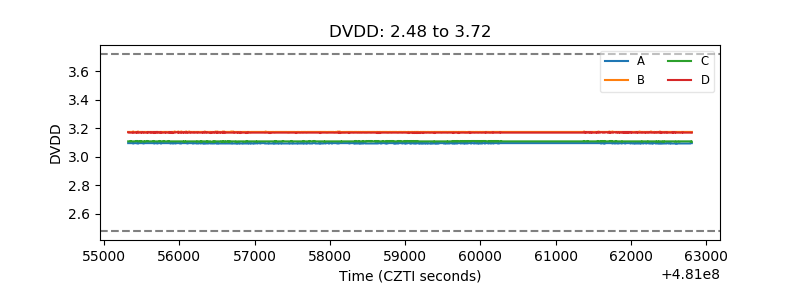 |
| Temperature 1 | 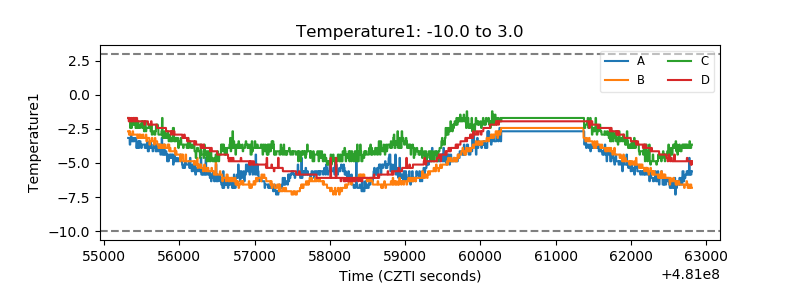 |
| Veto HV Monitor | 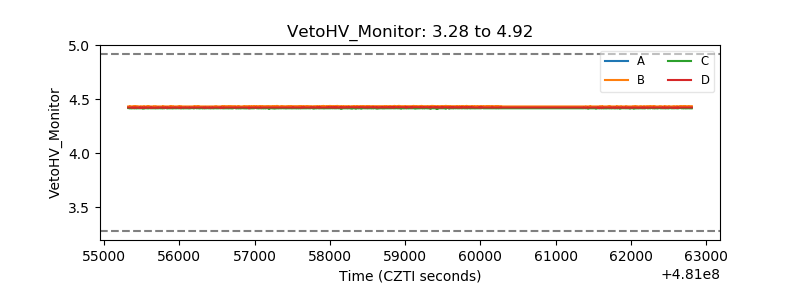 |
| Veto LLD | 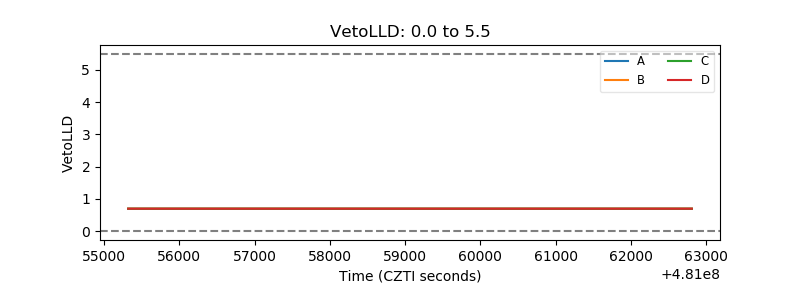 |
| Alpha Counter | 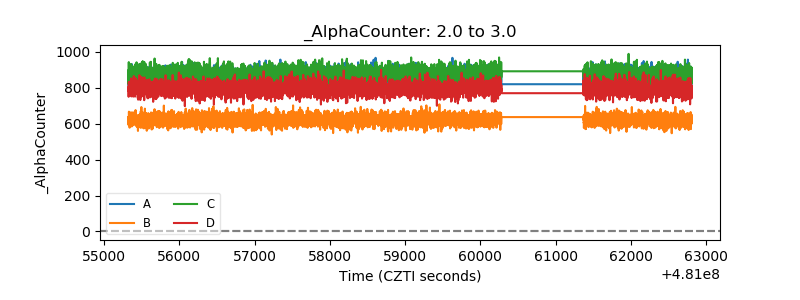 |
| _CPM_Rate | 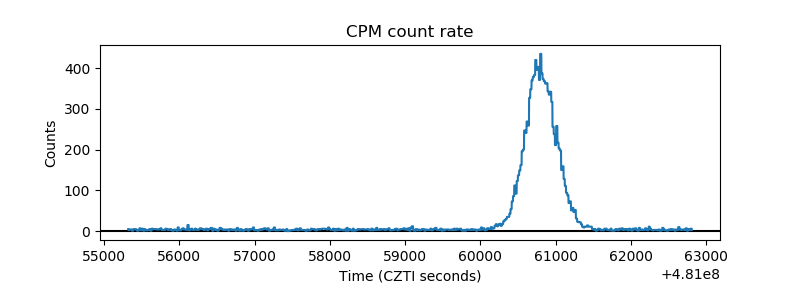 |
| CZT Counter | 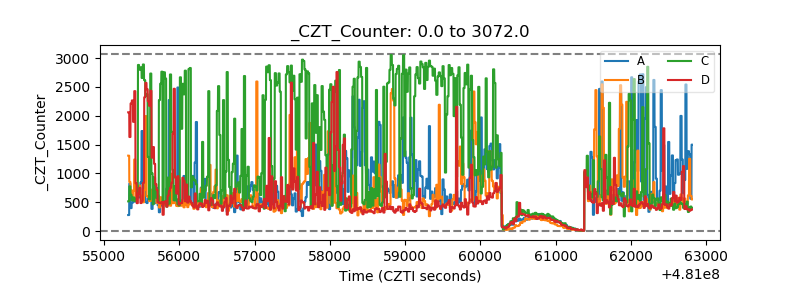 |
| +2.5 Volts monitor | 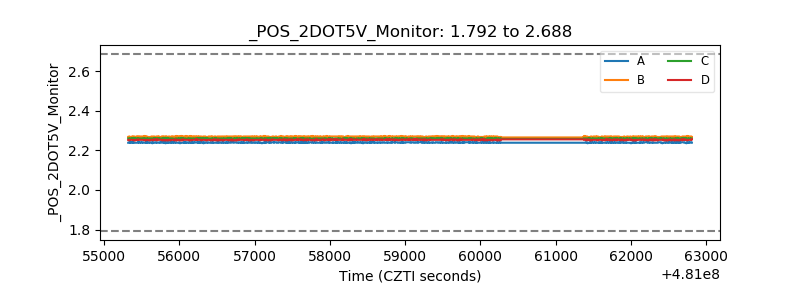 |
| +5 Volts monitor | 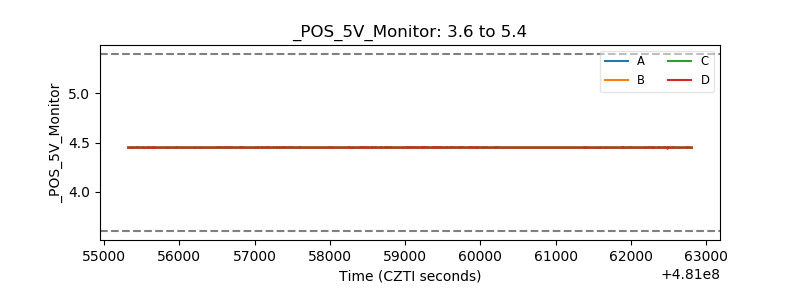 |
| _ROLL_ROT | 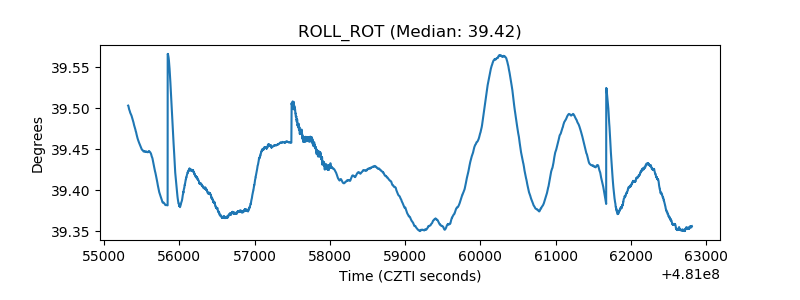 |
| _Roll_DEC | 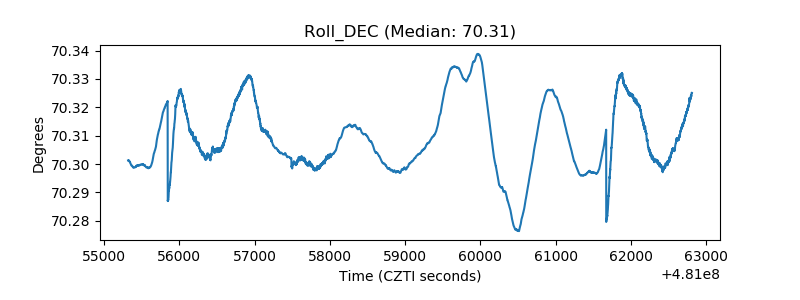 |
| _Roll_RA | 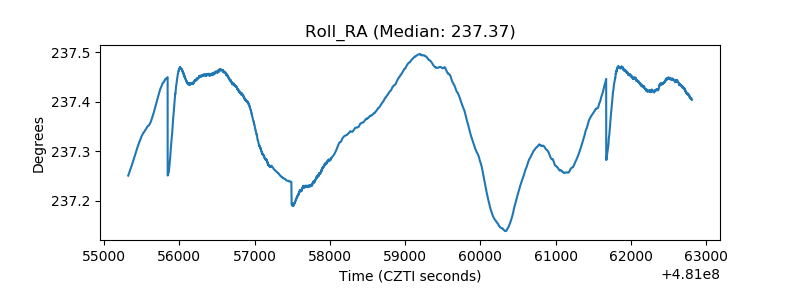 |
| Veto Counter | 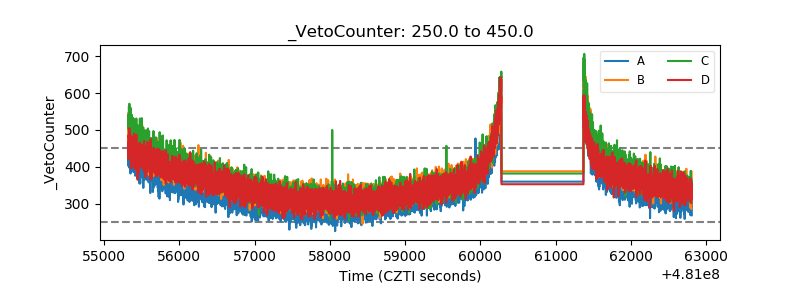 |