| Param | Original file | Final file |
|---|---|---|
| Filename | modeM0/AS1C07_001T03_9000006456_51410cztM0_level2.fits | modeM0/AS1C07_001T03_9000006456_51410cztM0_level2_quad_clean.evt |
| Size (bytes) | 600,154,560 | 96,796,800 |
| Size | 572.4 MB | 92.3 MB |
| Events in quadrant A | 7,179,397 | 587,630 |
| Events in quadrant B | 4,240,561 | 694,000 |
| Events in quadrant C | 6,187,219 | 576,208 |
| Events in quadrant D | 4,077,053 | 595,584 |
| Mode SS | |||
|---|---|---|---|
| Quadrant | BADHDUFLAG | Total packets | Discarded packets |
| A | 0 | 140 | 0 |
| B | 0 | 140 | 0 |
| C | 0 | 140 | 0 |
| D | 0 | 140 | 0 |
| Mode M0 | |||
|---|---|---|---|
| Quadrant | BADHDUFLAG | Total packets | Discarded packets |
| A | 0 | 26145 | 2 |
| B | 0 | 17347 | 2 |
| C | 0 | 23025 | 2 |
| D | 0 | 17100 | 2 |
| Mode M9 | |||
|---|---|---|---|
| Quadrant | BADHDUFLAG | Total packets | Discarded packets |
| A | 0 | 20 | 0 |
| B | 0 | 20 | 0 |
| C | 0 | 20 | 0 |
| D | 0 | 20 | 0 |
| Quadrant | Total seconds | Saturated seconds | Saturation percentage |
|---|---|---|---|
| A | 6855 | 864 | 12.603939% |
| B | 6855 | 357 | 5.207877% |
| C | 6856 | 959 | 13.987748% |
| D | 6856 | 201 | 2.931739% |
Noise dominated data is calculated using 1-second bins in cleaned event files. If a bin has >2000 counts, and if more than 50% of those come from <1% of pixels, then it is considered to be noise-dominated and hence unusable.
| Quadrant | # 1 sec bins | Bins with >0 counts | Bins with >2000 counts | High rate bins dominated by noise | Noise dominated (total time) | Noise dominated (detector-on time) | Marked lightcurve |
|---|---|---|---|---|---|---|---|
| A | 8860 | 6857 | 583 | 583 | 6.58% | 8.50% | 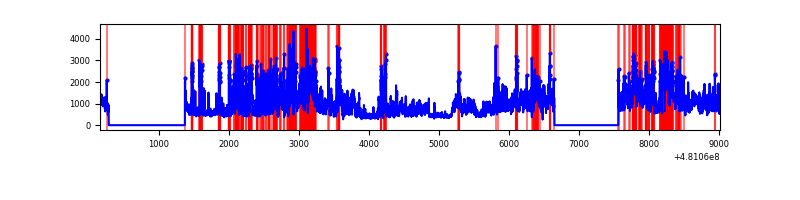 |
| B | 8860 | 6857 | 127 | 127 | 1.43% | 1.85% | 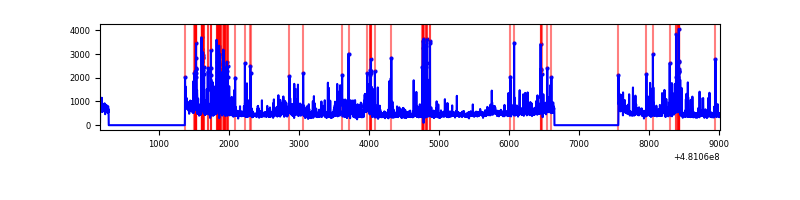 |
| C | 8861 | 6858 | 630 | 630 | 7.11% | 9.19% | 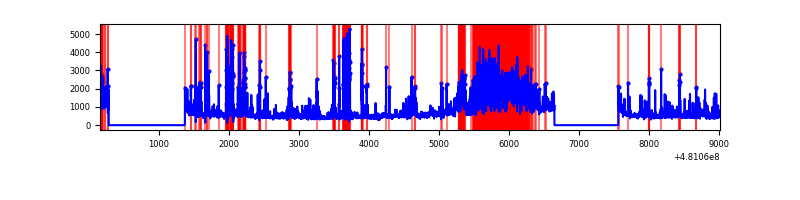 |
| D | 8861 | 6858 | 108 | 108 | 1.22% | 1.57% | 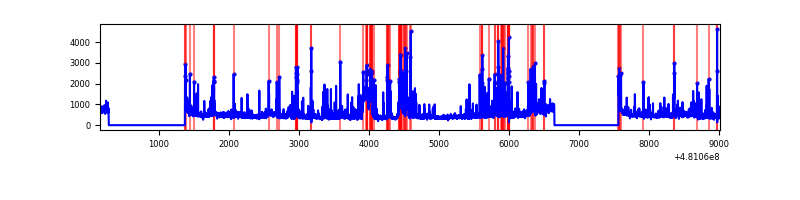 |
Top three noisy pixels from each quadrant. If the there are fewer than three noisy pixels in the level2.evt file, extra rows are filled as -1
| Pixel properties | Quadrant properties | ||||||
|---|---|---|---|---|---|---|---|
| Quadrant | DetID | PixID | Counts | Sigma | Mean | Median | Sigma |
| A | 12 | 3 | 1657668 | 9622.56 | 698 | 680 | 172.2 |
| A | 4 | 175 | 1128103 | 6547.24 | 698 | 680 | 172.2 |
| A | 15 | 174 | 761734 | 4419.64 | 698 | 680 | 172.2 |
| B | 6 | 51 | 398778 | 2600.41 | 721 | 696 | 153.1 |
| B | 10 | 254 | 240662 | 1567.54 | 721 | 696 | 153.1 |
| B | 5 | 185 | 184948 | 1203.6 | 721 | 696 | 153.1 |
| C | 15 | 179 | 1261801 | 6663.8 | 688 | 681 | 189.2 |
| C | 4 | 12 | 1148844 | 6066.93 | 688 | 681 | 189.2 |
| C | 10 | 171 | 382770 | 2018.97 | 688 | 681 | 189.2 |
| D | 3 | 12 | 325528 | 1641.93 | 709 | 684 | 197.8 |
| D | 8 | 176 | 289967 | 1462.18 | 709 | 684 | 197.8 |
| D | 7 | 80 | 143679 | 722.77 | 709 | 684 | 197.8 |
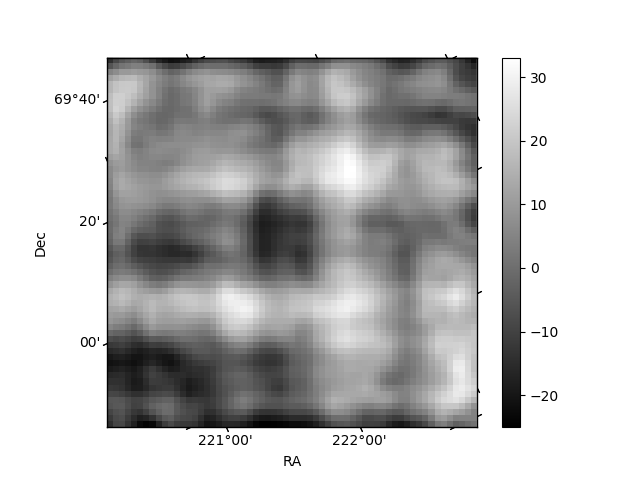
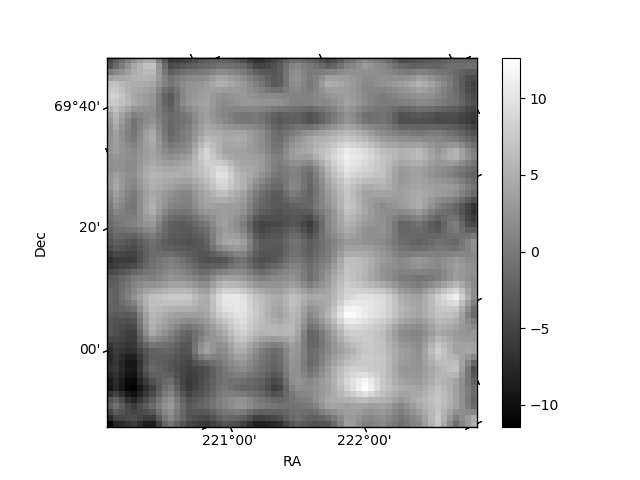
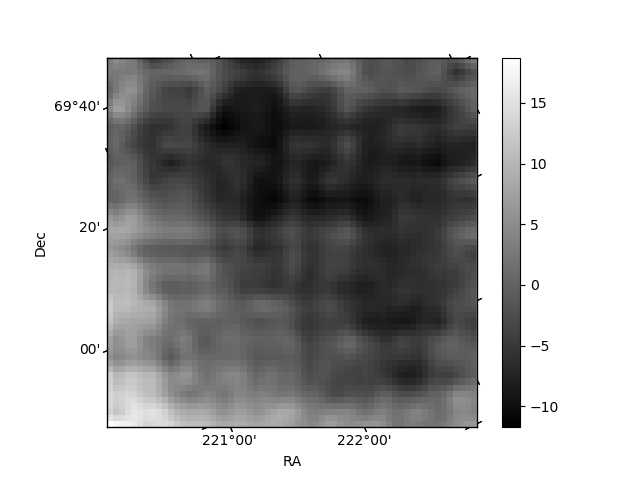
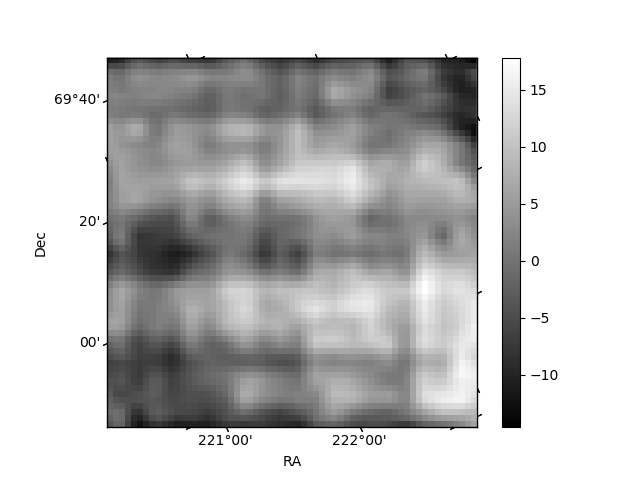
Histogram calculated using DETX and DETY for each event in the final _common_clean file
| Quadrant A | 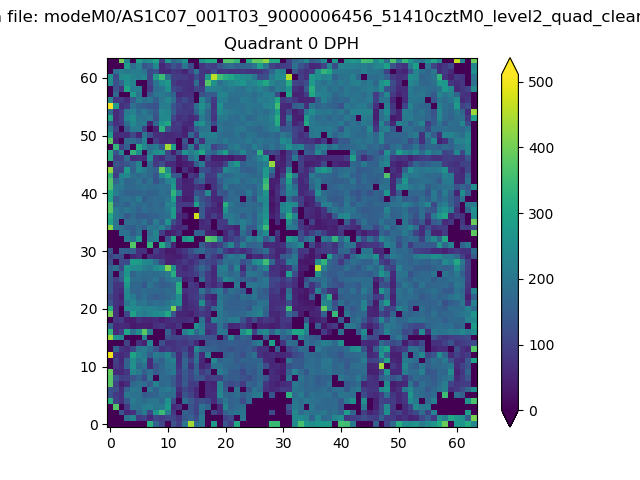 |
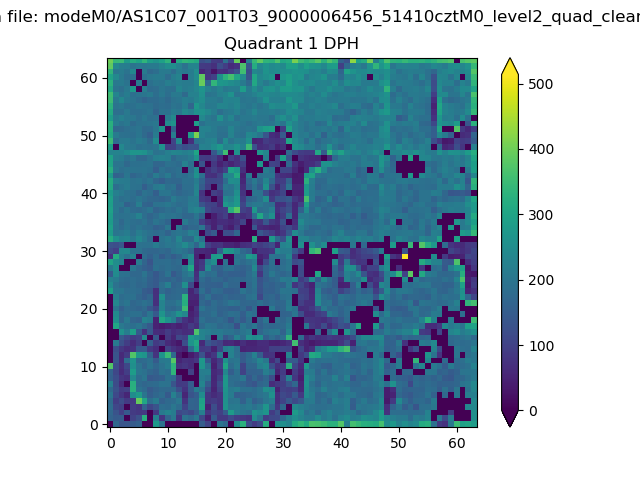 |
Quadrant B |
|---|---|---|---|
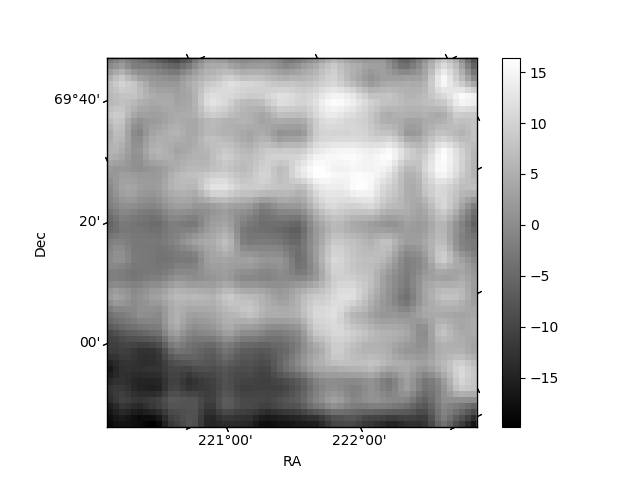
| Quadrant D | 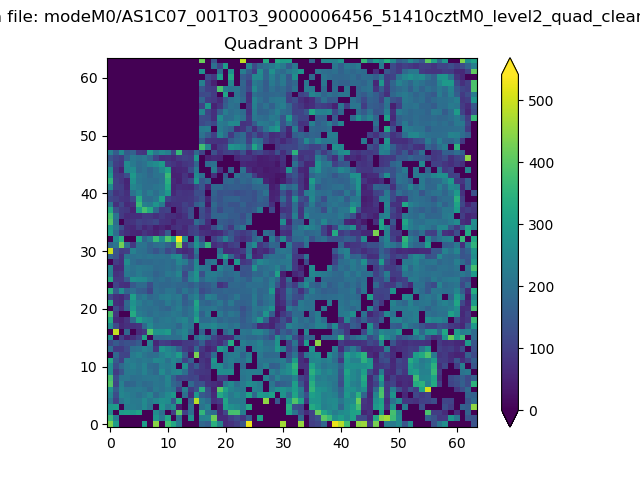 |
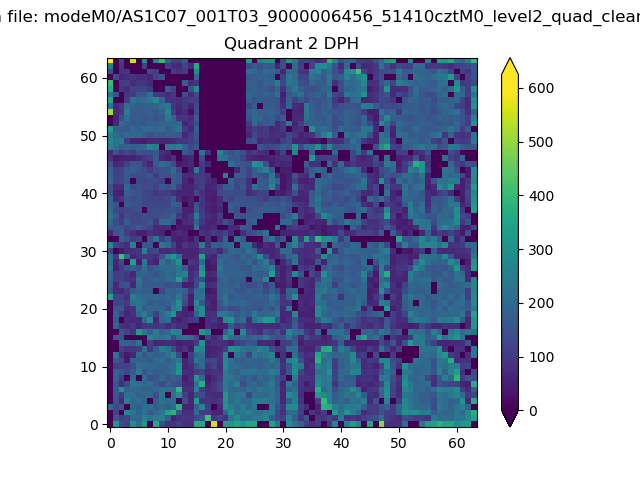 |
Quadrant C |
| Plot type | Count rate plots | Images |
|---|---|---|
| Comparison with Poisson distribution Blue bars denote a histogram of data divided into 1 sec bins. Red curve is a Poisson curve with rate = median count rate of data. |
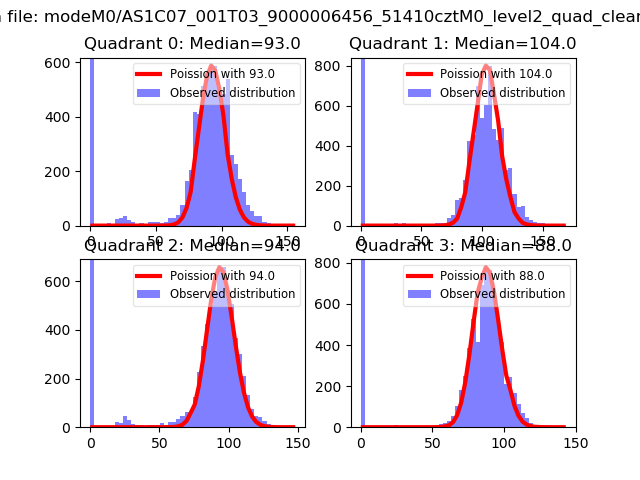 |
 |
| Quadrant-wise count rates Data is divided into 100 sec bins |
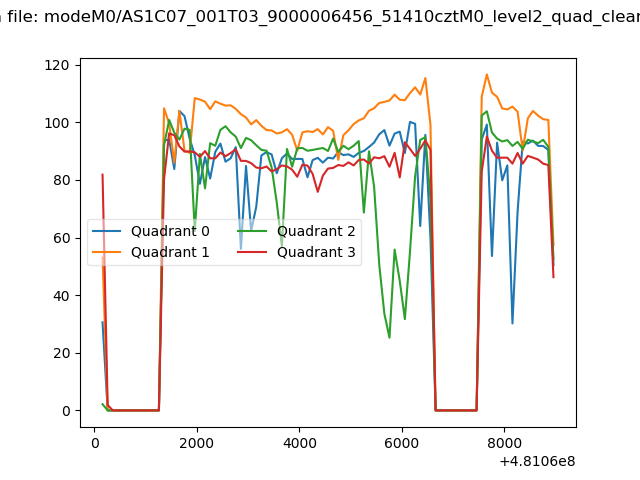 |
|
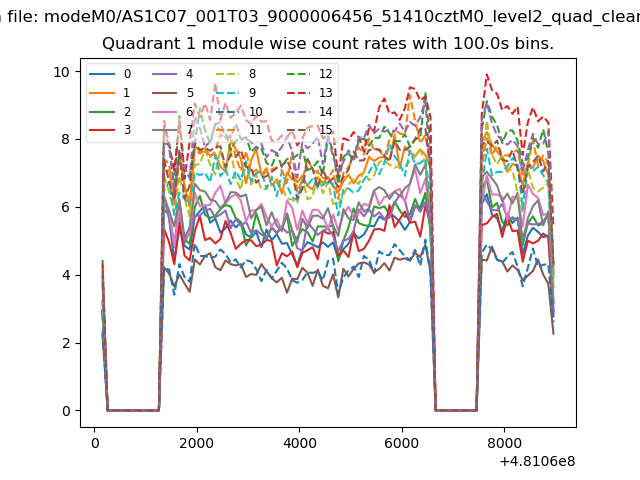
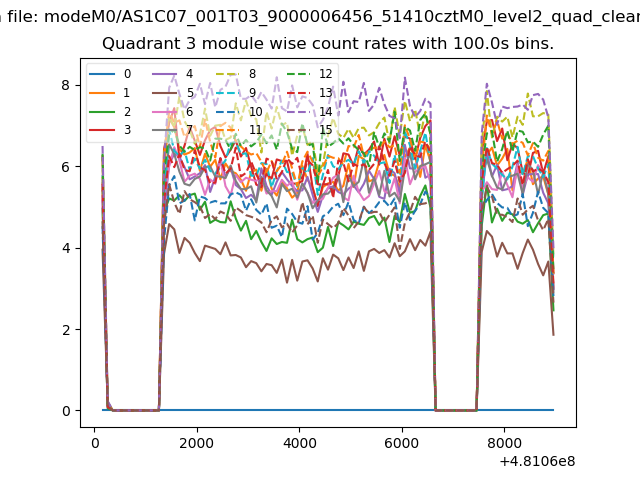
| Module-wise count rates for Quadrant A Data is divided into 100 sec bins |
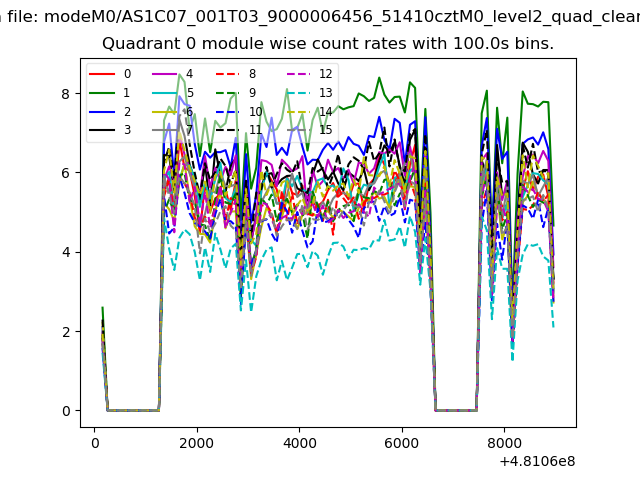 |
 |
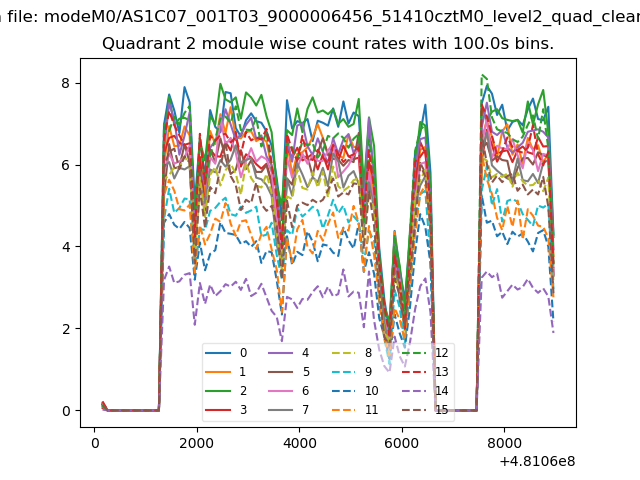
| Module-wise count rates for Quadrant B Data is divided into 100 sec bins |
 |
 |
| Module-wise count rates for Quadrant C Data is divided into 100 sec bins |
 |
 |
| Module-wise count rates for Quadrant D Data is divided into 100 sec bins |
 |
 |
| Parameter | Plot |
|---|---|
| CZT HV Monitor | 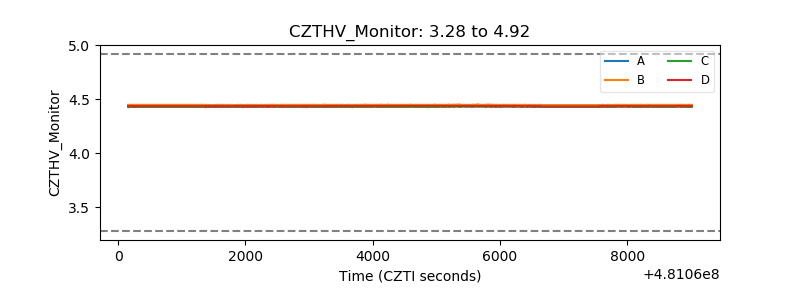 |
| D_VDD | 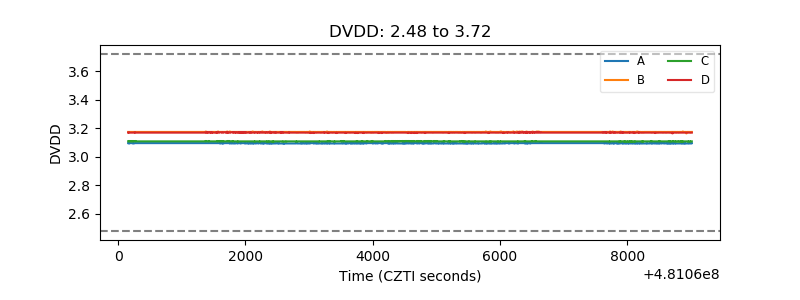 |
| Temperature 1 | 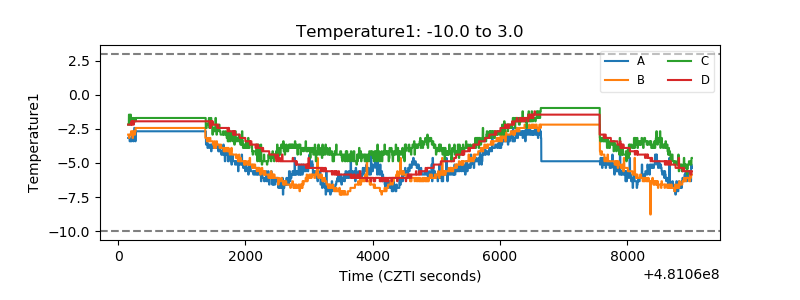 |
| Veto HV Monitor | 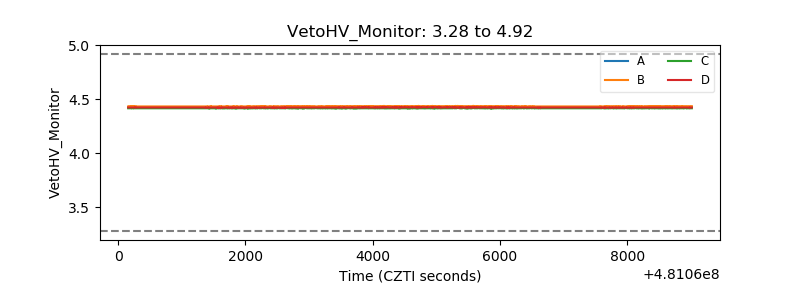 |
| Veto LLD | 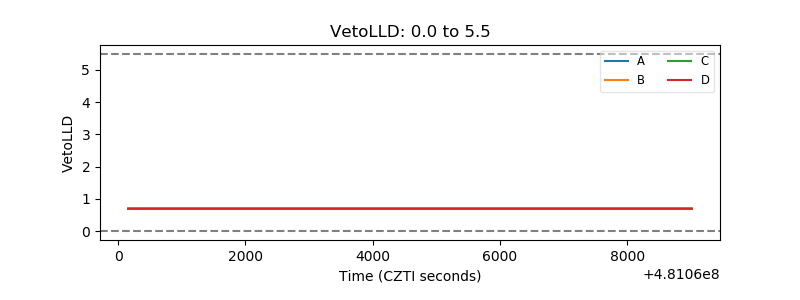 |
| Alpha Counter | 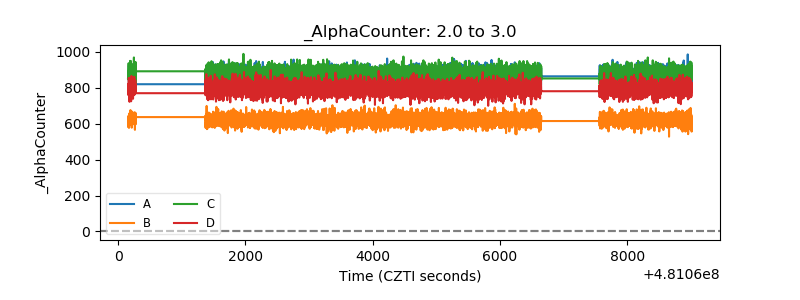 |
| _CPM_Rate | 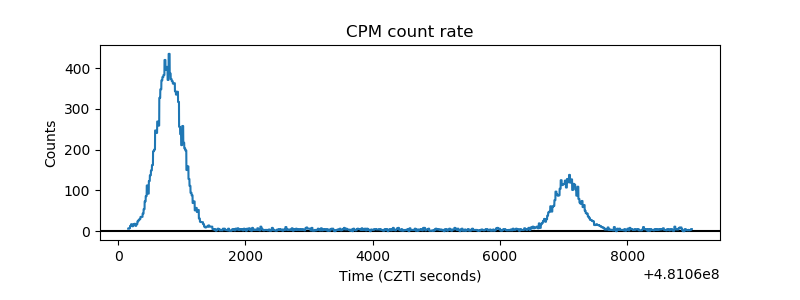 |
| CZT Counter | 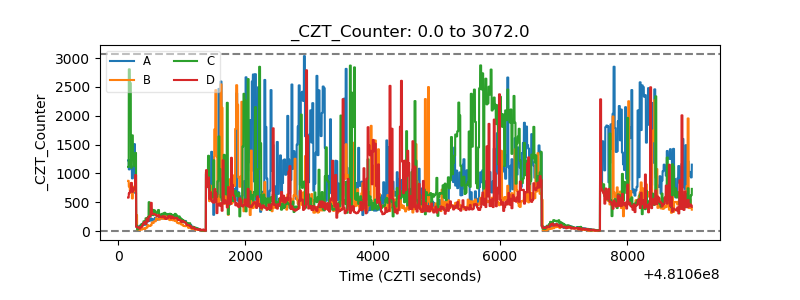 |
| +2.5 Volts monitor | 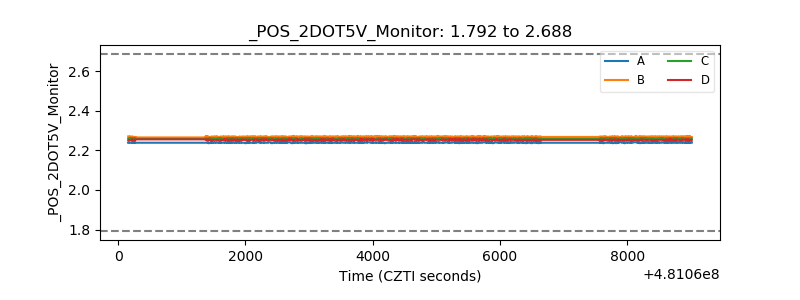 |
| +5 Volts monitor | 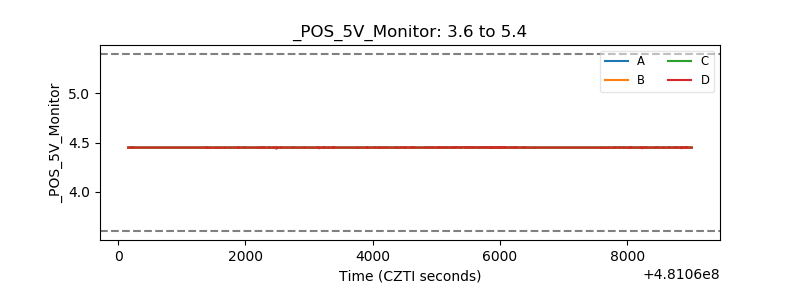 |
| _ROLL_ROT | 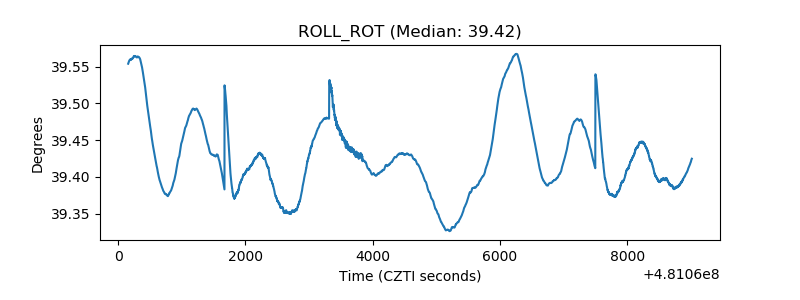 |
| _Roll_DEC | 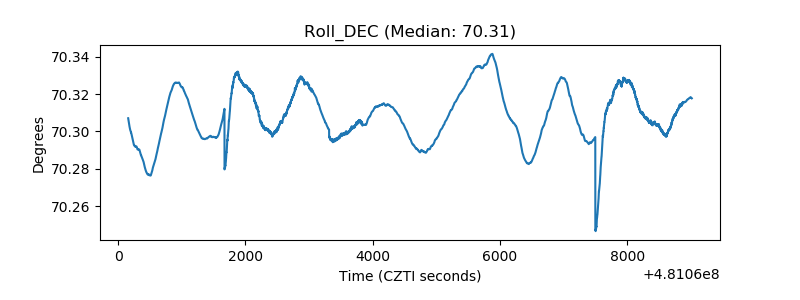 |
| _Roll_RA | 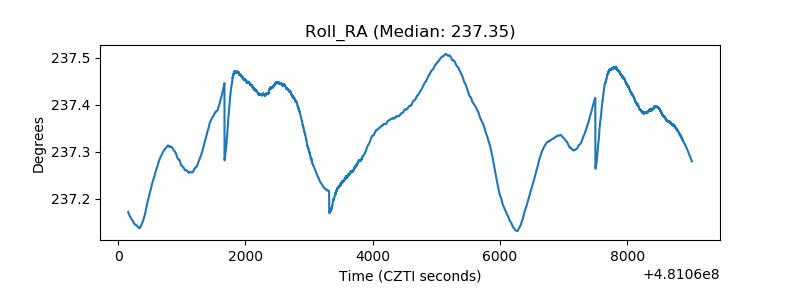 |
| Veto Counter | 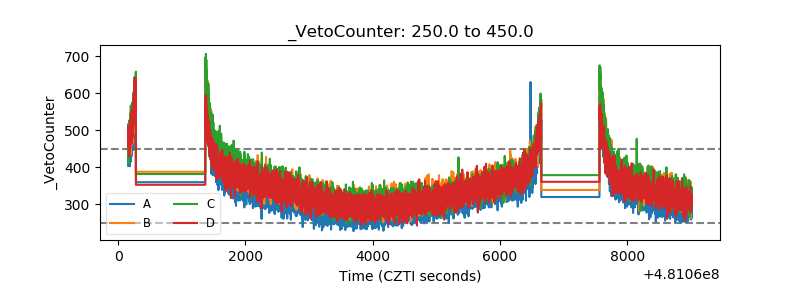 |