| Param | Original file | Final file |
|---|---|---|
| Filename | modeM0/AS1C07_001T03_9000006456_51411cztM0_level2.fits | modeM0/AS1C07_001T03_9000006456_51411cztM0_level2_quad_clean.evt |
| Size (bytes) | 699,125,760 | 95,990,400 |
| Size | 666.7 MB | 91.5 MB |
| Events in quadrant A | 8,224,270 | 615,946 |
| Events in quadrant B | 4,542,480 | 686,464 |
| Events in quadrant C | 8,639,507 | 503,714 |
| Events in quadrant D | 3,924,311 | 606,575 |
| Mode SS | |||
|---|---|---|---|
| Quadrant | BADHDUFLAG | Total packets | Discarded packets |
| A | 0 | 144 | 0 |
| B | 0 | 144 | 0 |
| C | 0 | 144 | 0 |
| D | 0 | 144 | 0 |
| Mode M0 | |||
|---|---|---|---|
| Quadrant | BADHDUFLAG | Total packets | Discarded packets |
| A | 0 | 29428 | 2 |
| B | 0 | 18627 | 2 |
| C | 0 | 30496 | 2 |
| D | 0 | 17023 | 2 |
| Mode M9 | |||
|---|---|---|---|
| Quadrant | BADHDUFLAG | Total packets | Discarded packets |
| A | 0 | 9 | 0 |
| B | 0 | 10 | 0 |
| C | 0 | 10 | 0 |
| D | 0 | 10 | 0 |
| Quadrant | Total seconds | Saturated seconds | Saturation percentage |
|---|---|---|---|
| A | 7090 | 646 | 9.111425% |
| B | 7090 | 491 | 6.925247% |
| C | 7089 | 1945 | 27.436874% |
| D | 7089 | 135 | 1.904359% |
Noise dominated data is calculated using 1-second bins in cleaned event files. If a bin has >2000 counts, and if more than 50% of those come from <1% of pixels, then it is considered to be noise-dominated and hence unusable.
| Quadrant | # 1 sec bins | Bins with >0 counts | Bins with >2000 counts | High rate bins dominated by noise | Noise dominated (total time) | Noise dominated (detector-on time) | Marked lightcurve |
|---|---|---|---|---|---|---|---|
| A | 7630 | 7091 | 419 | 419 | 5.49% | 5.91% | 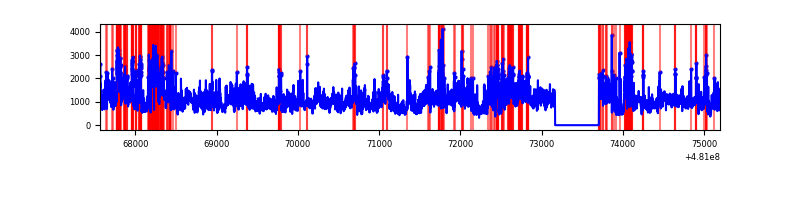 |
| B | 7630 | 7091 | 280 | 280 | 3.67% | 3.95% | 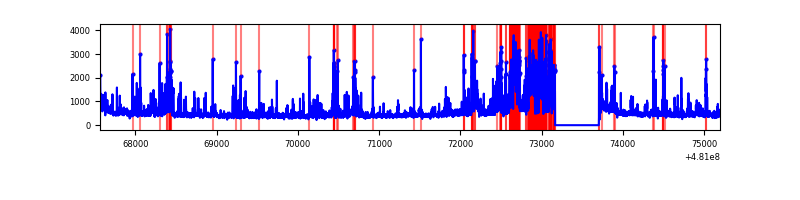 |
| C | 7629 | 7090 | 1436 | 1436 | 18.82% | 20.25% | 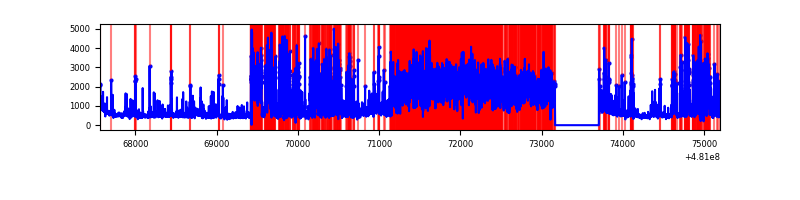 |
| D | 7629 | 7090 | 79 | 79 | 1.04% | 1.11% | 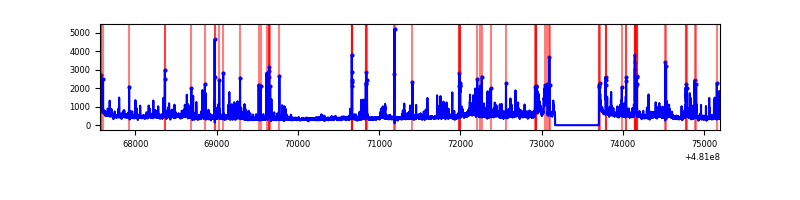 |
Top three noisy pixels from each quadrant. If the there are fewer than three noisy pixels in the level2.evt file, extra rows are filled as -1
| Pixel properties | Quadrant properties | ||||||
|---|---|---|---|---|---|---|---|
| Quadrant | DetID | PixID | Counts | Sigma | Mean | Median | Sigma |
| A | 12 | 3 | 3016471 | 16972.71 | 716 | 696 | 177.7 |
| A | 4 | 175 | 683671 | 3843.77 | 716 | 696 | 177.7 |
| A | 15 | 174 | 467580 | 2627.61 | 716 | 696 | 177.7 |
| B | 5 | 172 | 434782 | 2851.1 | 719 | 693 | 152.3 |
| B | 5 | 185 | 385048 | 2524.45 | 719 | 693 | 152.3 |
| B | 6 | 51 | 332177 | 2177.19 | 719 | 693 | 152.3 |
| C | 15 | 179 | 2856696 | 15644.84 | 662 | 657 | 182.6 |
| C | 4 | 12 | 1278477 | 6999.65 | 662 | 657 | 182.6 |
| C | 1 | 60 | 478163 | 2615.69 | 662 | 657 | 182.6 |
| D | 2 | 249 | 199306 | 983.79 | 720 | 691 | 201.9 |
| D | 3 | 12 | 178830 | 882.37 | 720 | 691 | 201.9 |
| D | 8 | 176 | 174611 | 861.47 | 720 | 691 | 201.9 |
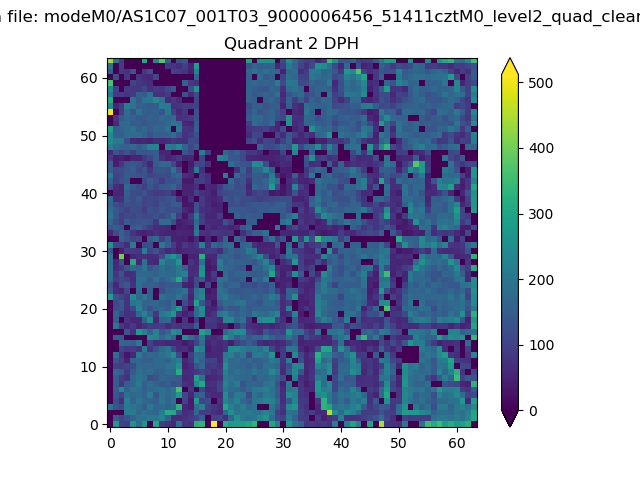
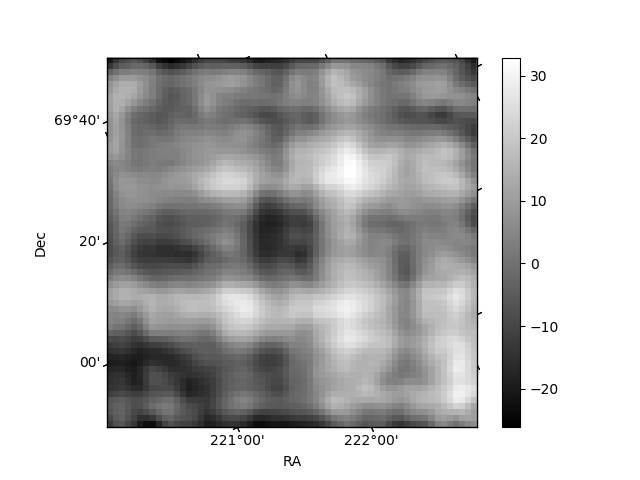
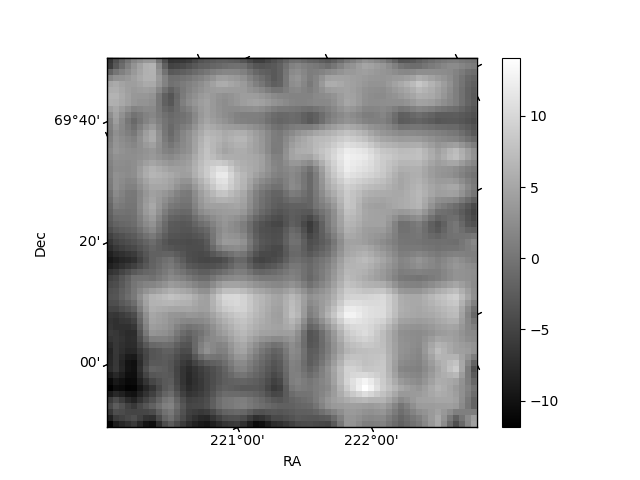
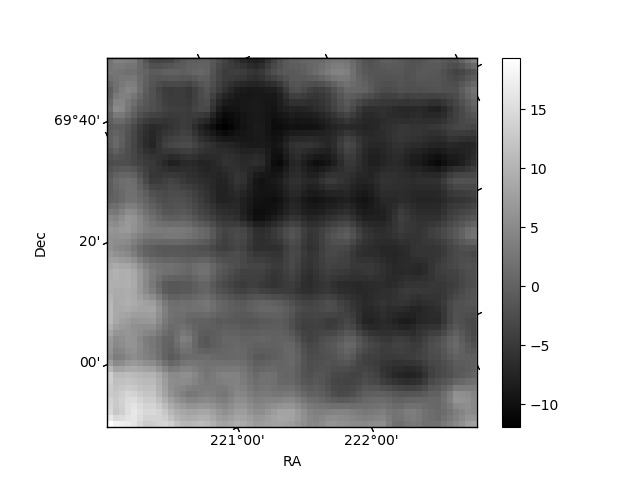
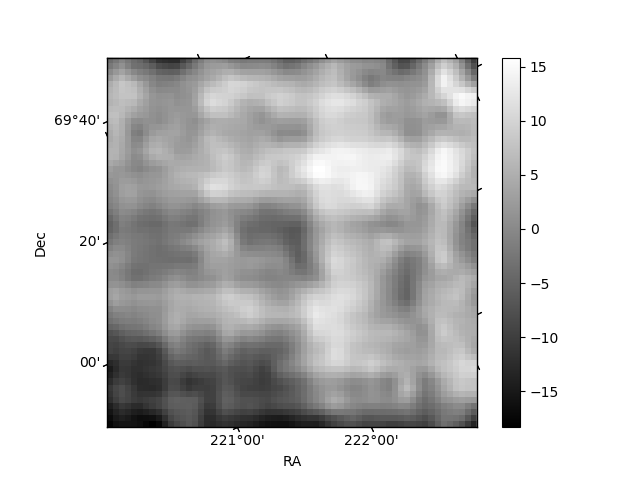
Histogram calculated using DETX and DETY for each event in the final _common_clean file
| Quadrant A | 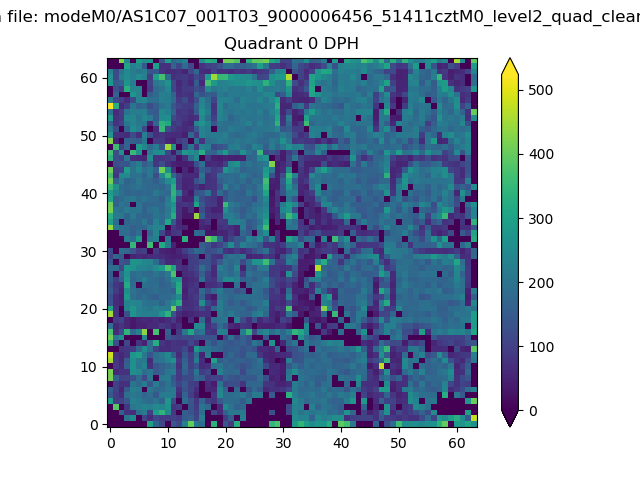 |
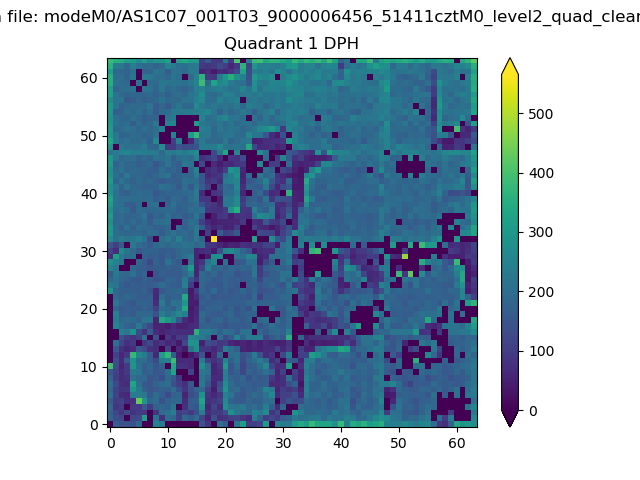 |
Quadrant B |
|---|---|---|---|
| Quadrant D | 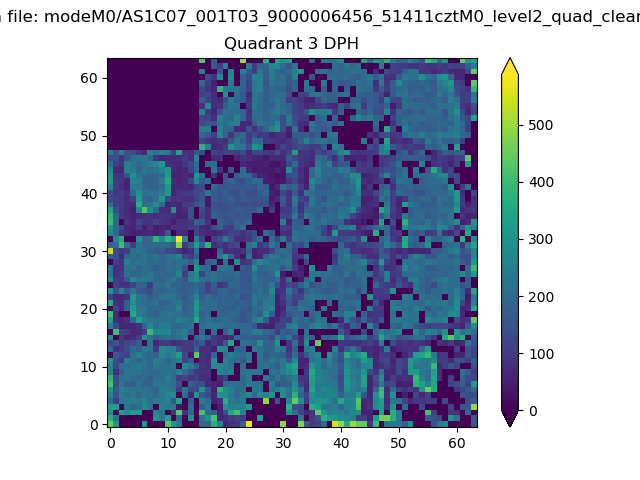 |
 |
Quadrant C |
| Plot type | Count rate plots | Images |
|---|---|---|
| Comparison with Poisson distribution Blue bars denote a histogram of data divided into 1 sec bins. Red curve is a Poisson curve with rate = median count rate of data. |
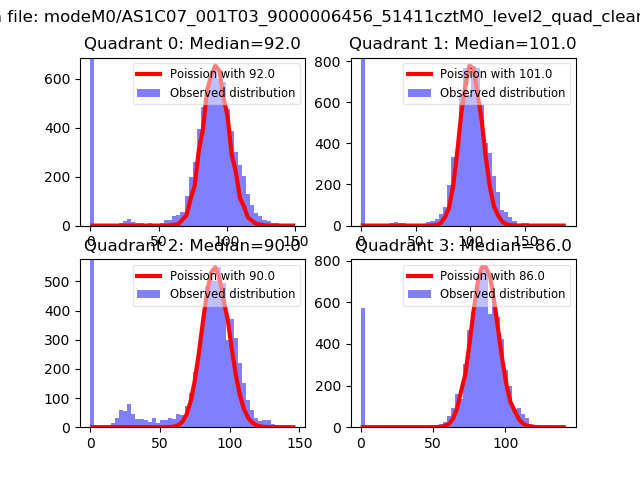 |
 |
| Quadrant-wise count rates Data is divided into 100 sec bins |
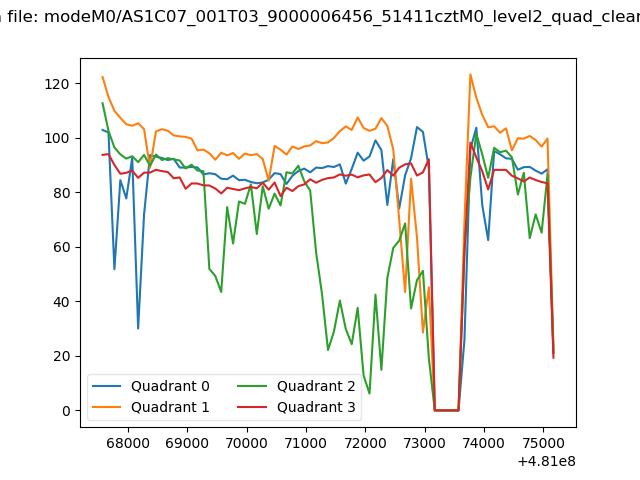 |
|
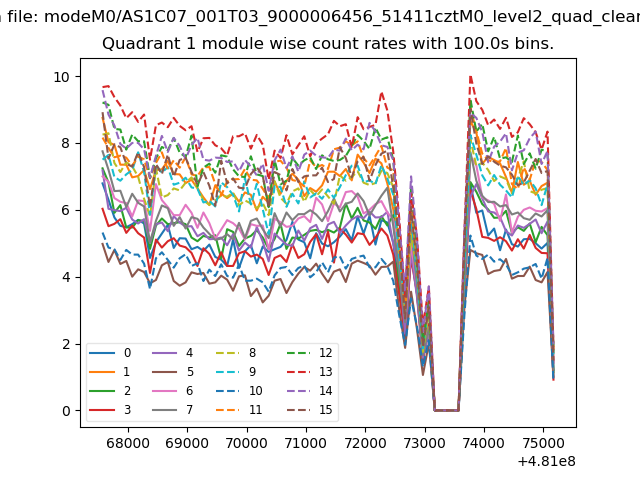
| Module-wise count rates for Quadrant A Data is divided into 100 sec bins |
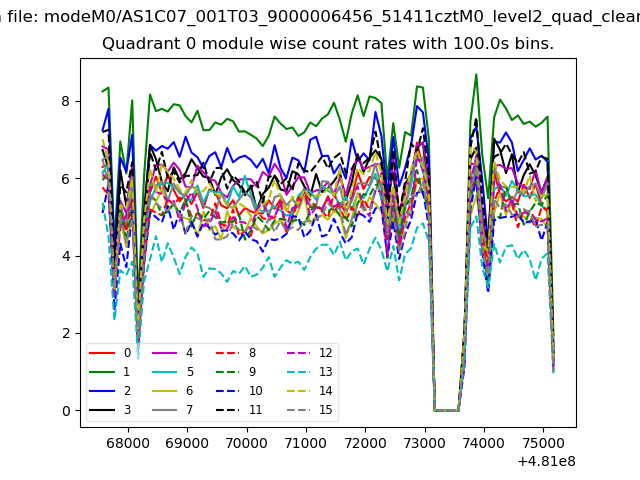 |
 |
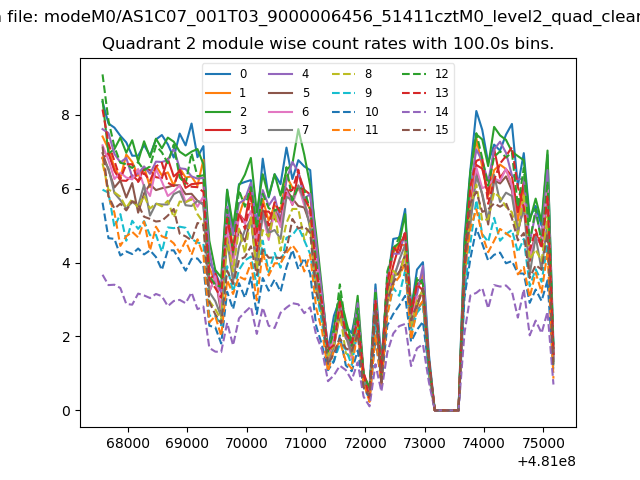
| Module-wise count rates for Quadrant B Data is divided into 100 sec bins |
 |
 |
| Module-wise count rates for Quadrant C Data is divided into 100 sec bins |
 |
 |
| Module-wise count rates for Quadrant D Data is divided into 100 sec bins |
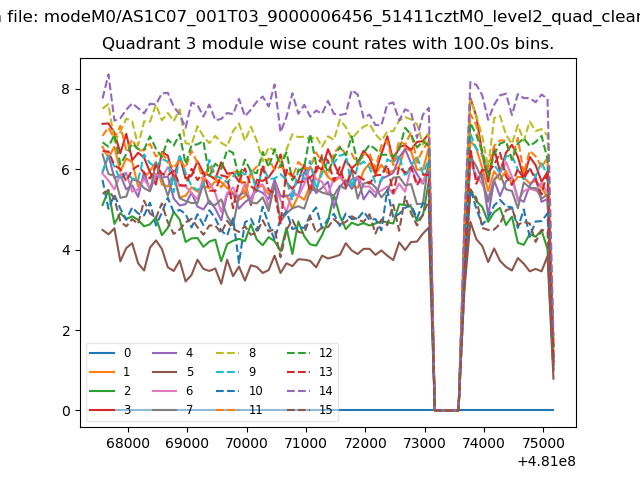 |
 |
| Parameter | Plot |
|---|---|
| CZT HV Monitor | 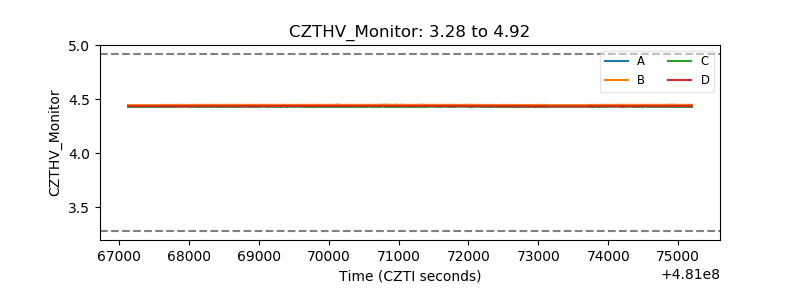 |
| D_VDD | 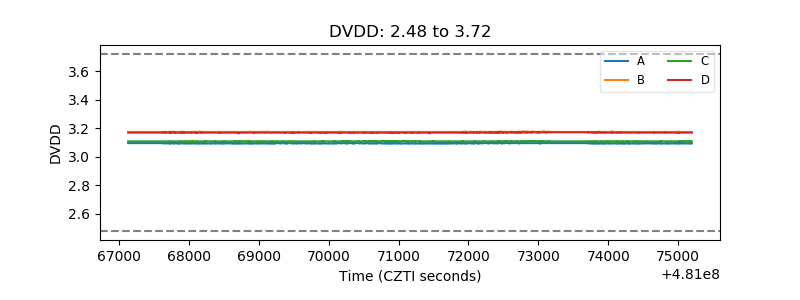 |
| Temperature 1 | 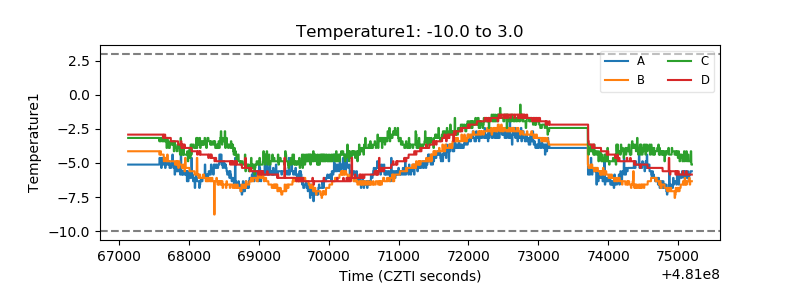 |
| Veto HV Monitor | 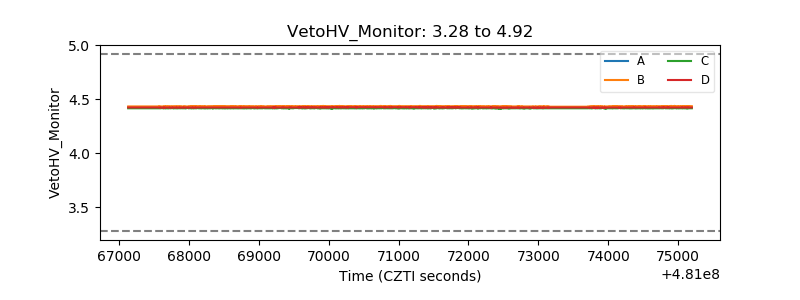 |
| Veto LLD | 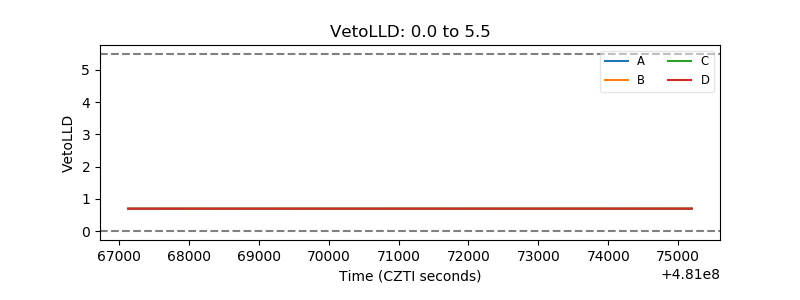 |
| Alpha Counter | 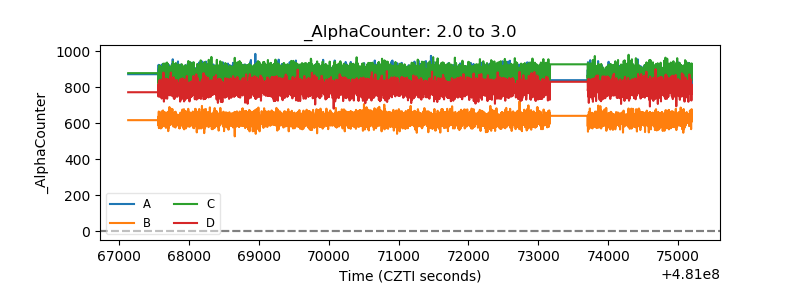 |
| _CPM_Rate | 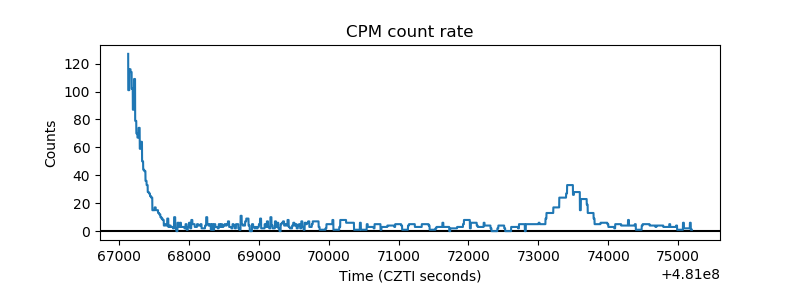 |
| CZT Counter | 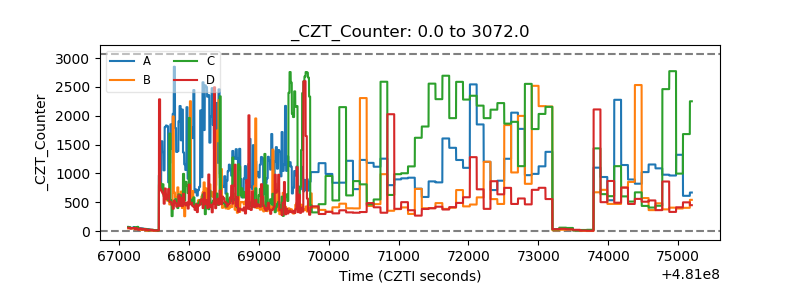 |
| +2.5 Volts monitor |  |
| +5 Volts monitor | 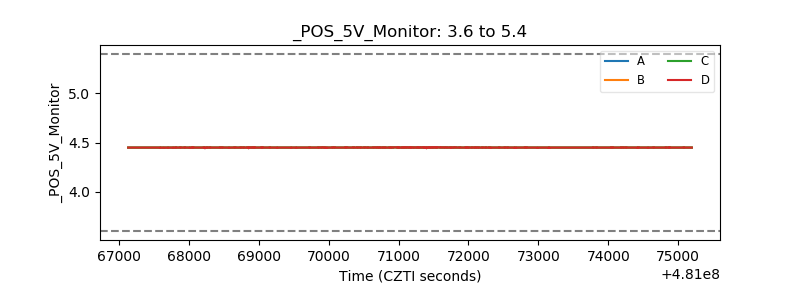 |
| _ROLL_ROT | 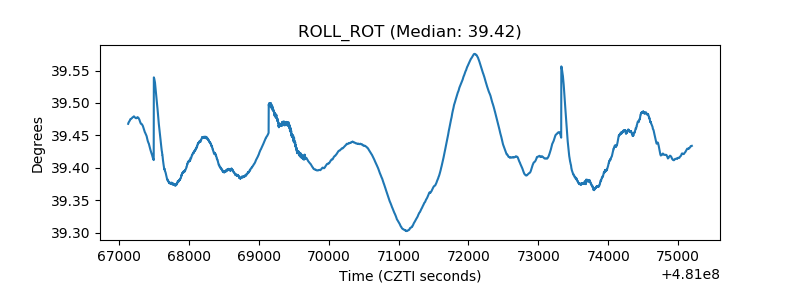 |
| _Roll_DEC | 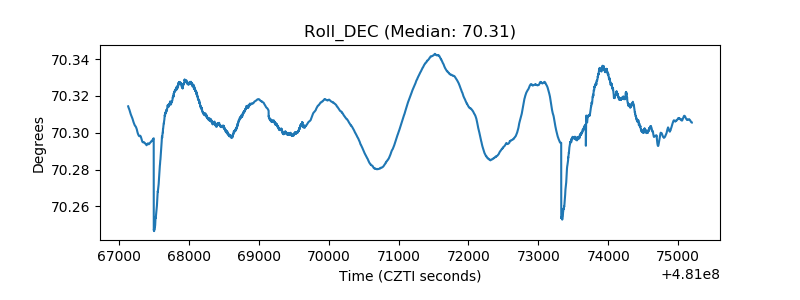 |
| _Roll_RA | 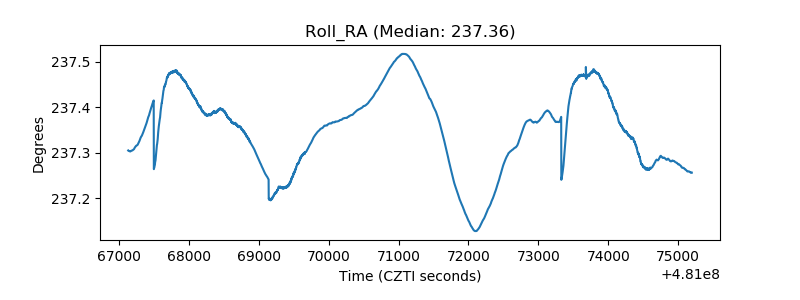 |
| Veto Counter | 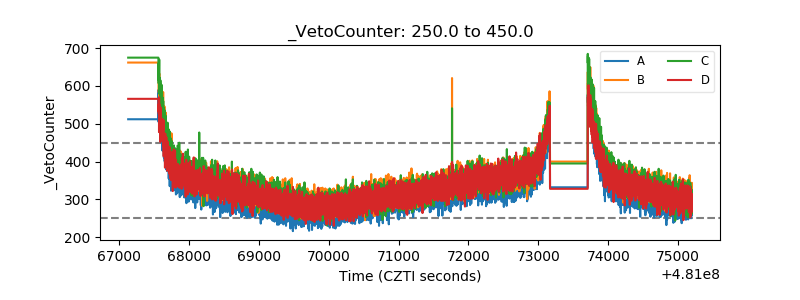 |