| Param | Original file | Final file |
|---|---|---|
| Filename | modeM0/AS1C07_001T03_9000006456_51412cztM0_level2.fits | modeM0/AS1C07_001T03_9000006456_51412cztM0_level2_quad_clean.evt |
| Size (bytes) | 941,074,560 | 98,017,920 |
| Size | 897.5 MB | 93.5 MB |
| Events in quadrant A | 7,871,314 | 713,328 |
| Events in quadrant B | 7,107,446 | 749,440 |
| Events in quadrant C | 14,833,283 | 264,095 |
| Events in quadrant D | 4,402,548 | 683,342 |
| Mode SS | |||
|---|---|---|---|
| Quadrant | BADHDUFLAG | Total packets | Discarded packets |
| A | 0 | 162 | 0 |
| B | 0 | 162 | 0 |
| C | 0 | 162 | 0 |
| D | 0 | 162 | 0 |
| Mode M0 | |||
|---|---|---|---|
| Quadrant | BADHDUFLAG | Total packets | Discarded packets |
| A | 0 | 29033 | 1 |
| B | 0 | 26727 | 1 |
| C | 0 | 49471 | 1 |
| D | 0 | 19096 | 1 |
| Mode M9 | |||
|---|---|---|---|
| Quadrant | BADHDUFLAG | Total packets | Discarded packets |
| A | 0 | 5 | 0 |
| B | 0 | 5 | 0 |
| C | 0 | 5 | 0 |
| D | 0 | 5 | 0 |
| Quadrant | Total seconds | Saturated seconds | Saturation percentage |
|---|---|---|---|
| A | 8020 | 469 | 5.847880% |
| B | 8021 | 824 | 10.273033% |
| C | 8021 | 5390 | 67.198604% |
| D | 8021 | 144 | 1.795287% |
Noise dominated data is calculated using 1-second bins in cleaned event files. If a bin has >2000 counts, and if more than 50% of those come from <1% of pixels, then it is considered to be noise-dominated and hence unusable.
| Quadrant | # 1 sec bins | Bins with >0 counts | Bins with >2000 counts | High rate bins dominated by noise | Noise dominated (total time) | Noise dominated (detector-on time) | Marked lightcurve |
|---|---|---|---|---|---|---|---|
| A | 8560 | 8021 | 254 | 254 | 2.97% | 3.17% | 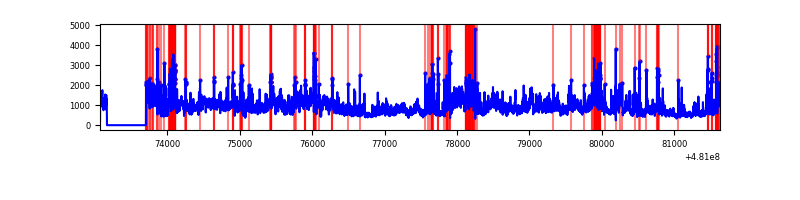 |
| B | 8561 | 8022 | 417 | 417 | 4.87% | 5.20% | 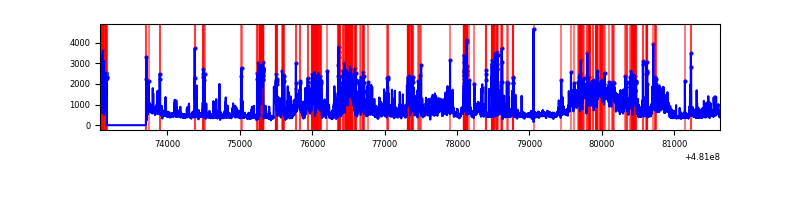 |
| C | 8560 | 8021 | 4216 | 4216 | 49.25% | 52.56% | 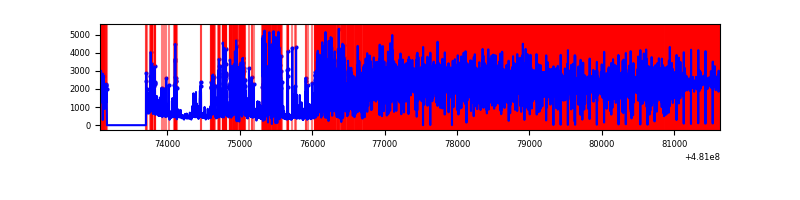 |
| D | 8561 | 8022 | 108 | 108 | 1.26% | 1.35% | 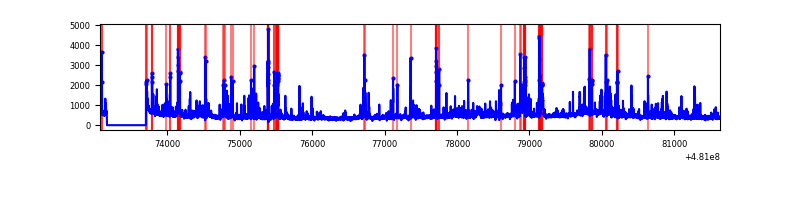 |
Top three noisy pixels from each quadrant. If the there are fewer than three noisy pixels in the level2.evt file, extra rows are filled as -1
| Pixel properties | Quadrant properties | ||||||
|---|---|---|---|---|---|---|---|
| Quadrant | DetID | PixID | Counts | Sigma | Mean | Median | Sigma |
| A | 12 | 3 | 2675714 | 13025.81 | 830 | 807 | 205.4 |
| A | 15 | 174 | 398330 | 1935.79 | 830 | 807 | 205.4 |
| A | 10 | 253 | 336706 | 1635.7 | 830 | 807 | 205.4 |
| B | 10 | 254 | 2336658 | 13357.44 | 823 | 793 | 174.9 |
| B | 6 | 51 | 392367 | 2239.18 | 823 | 793 | 174.9 |
| B | 3 | 214 | 294066 | 1677.06 | 823 | 793 | 174.9 |
| C | 15 | 179 | 9038066 | 66945.49 | 486 | 481 | 135.0 |
| C | 4 | 12 | 2545601 | 18852.86 | 486 | 481 | 135.0 |
| C | 10 | 171 | 407530 | 3015.2 | 486 | 481 | 135.0 |
| D | 3 | 12 | 172023 | 752.09 | 822 | 790 | 227.7 |
| D | 2 | 153 | 123907 | 540.75 | 822 | 790 | 227.7 |
| D | 2 | 249 | 122975 | 536.66 | 822 | 790 | 227.7 |
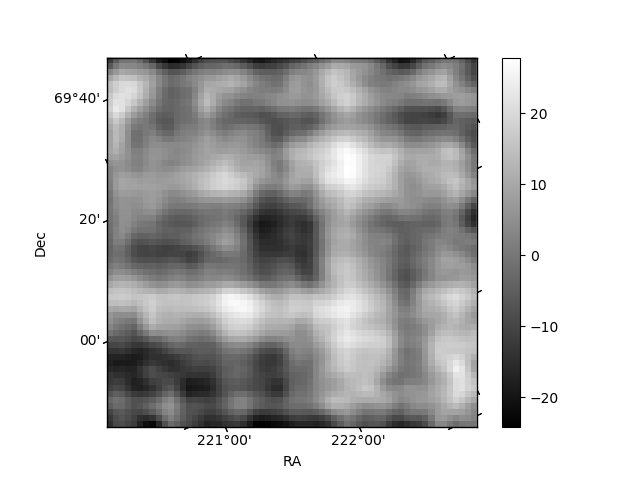
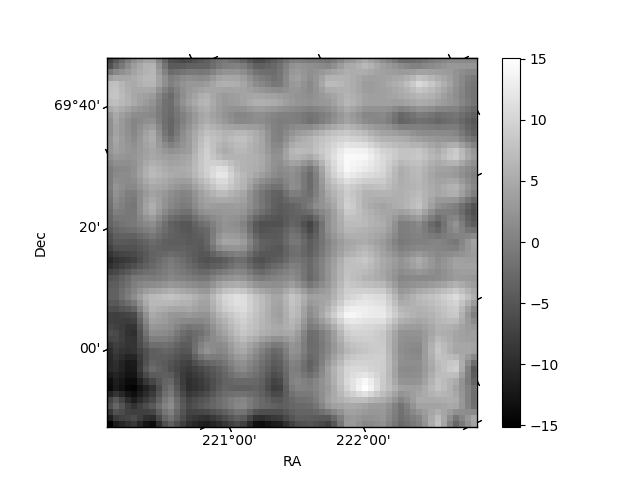
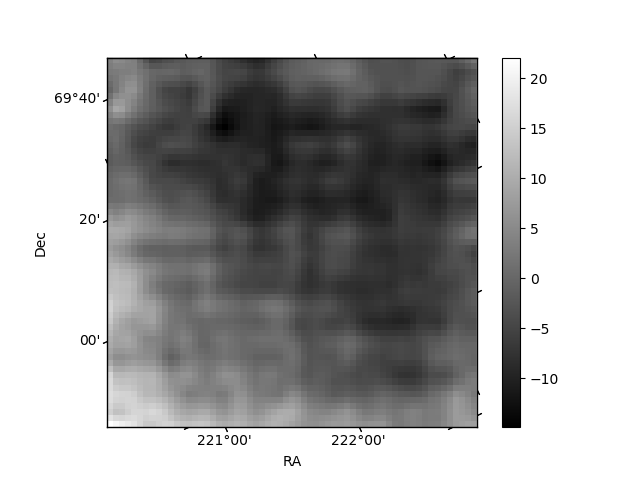
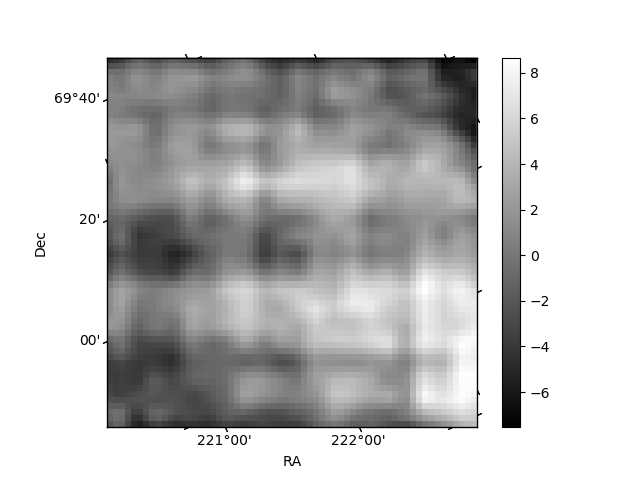
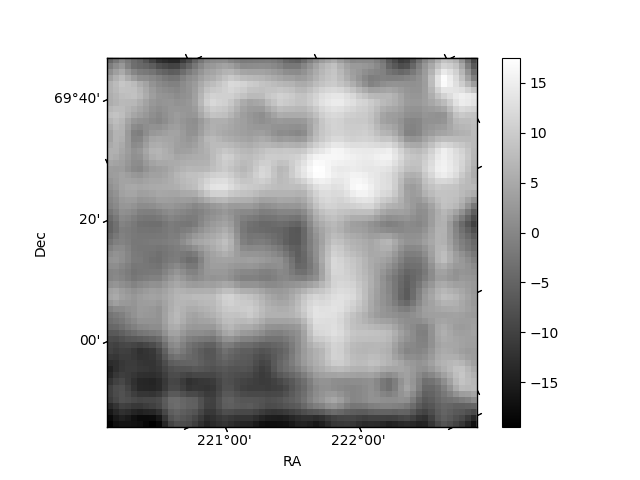
Histogram calculated using DETX and DETY for each event in the final _common_clean file
| Quadrant A | 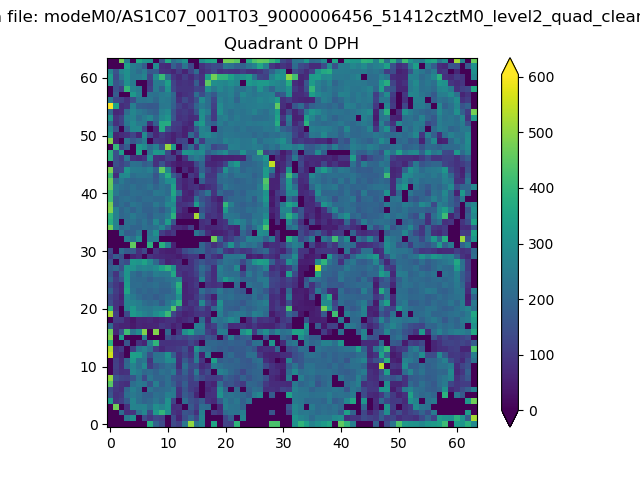 |
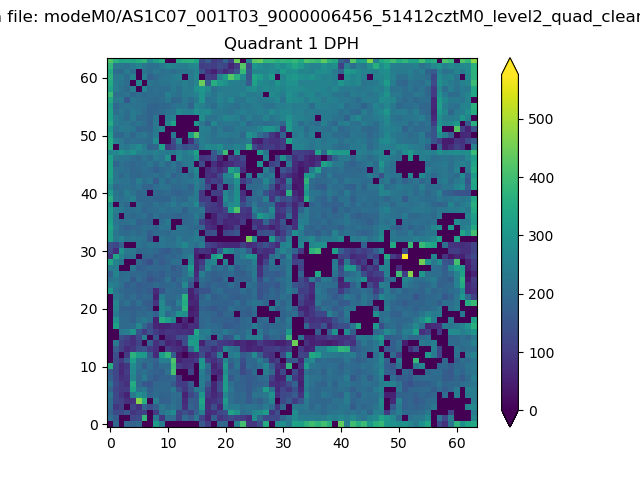 |
Quadrant B |
|---|---|---|---|
| Quadrant D | 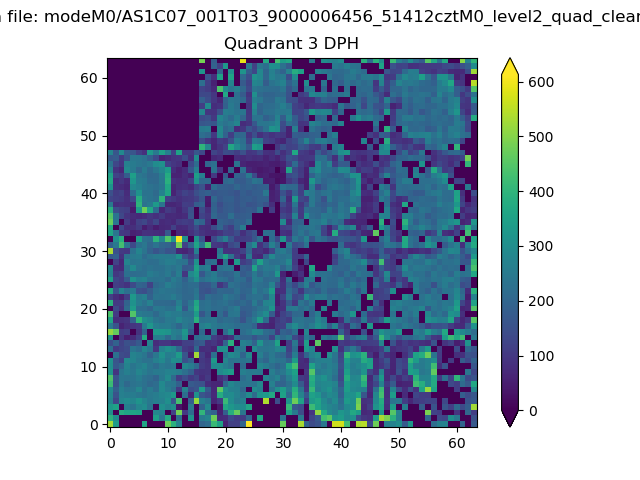 |
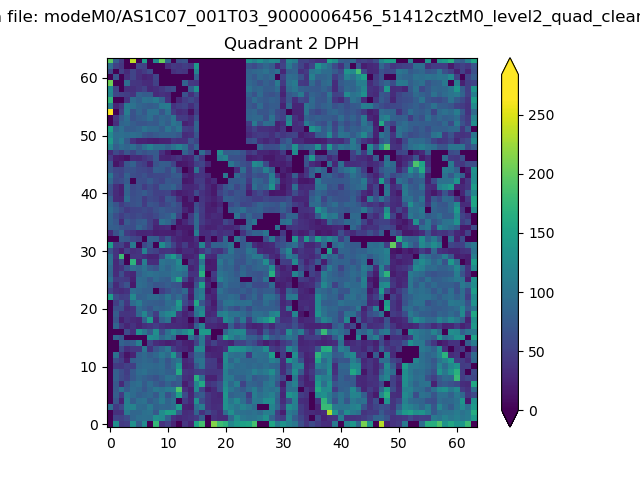 |
Quadrant C |
| Plot type | Count rate plots | Images |
|---|---|---|
| Comparison with Poisson distribution Blue bars denote a histogram of data divided into 1 sec bins. Red curve is a Poisson curve with rate = median count rate of data. |
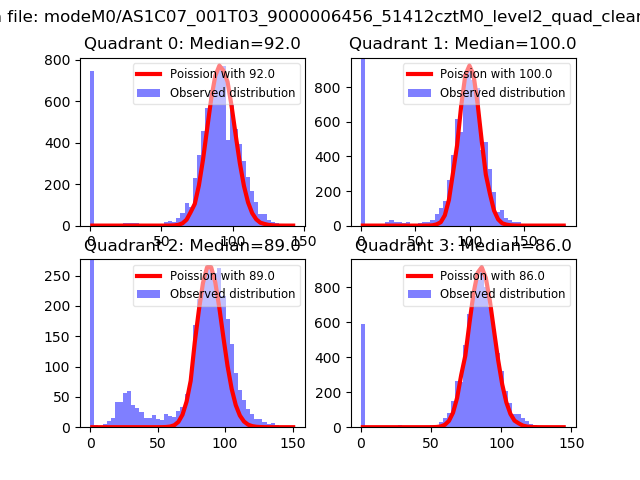 |
 |
| Quadrant-wise count rates Data is divided into 100 sec bins |
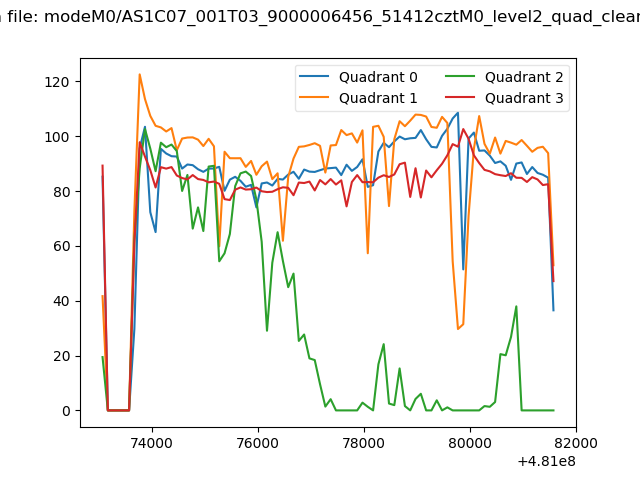 |
|
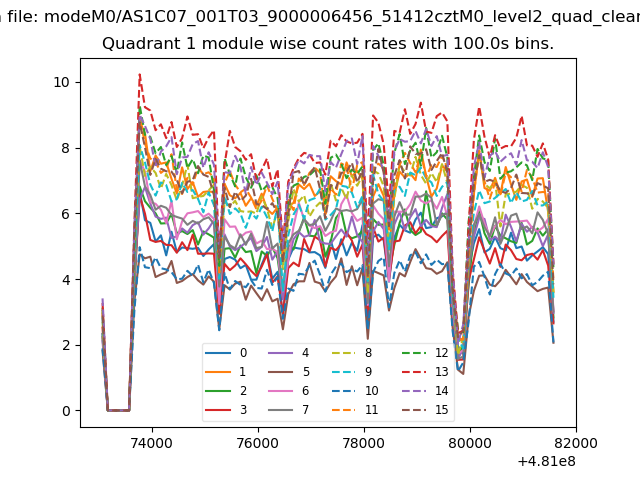
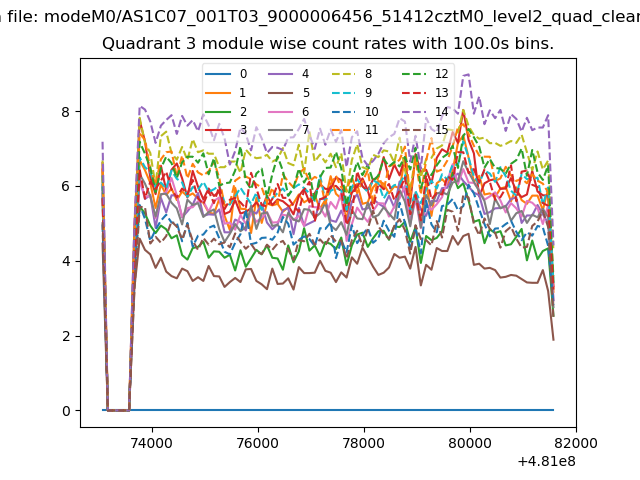
| Module-wise count rates for Quadrant A Data is divided into 100 sec bins |
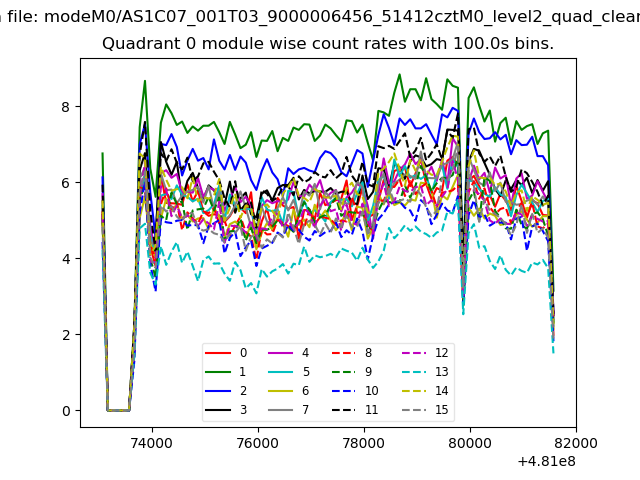 |
 |
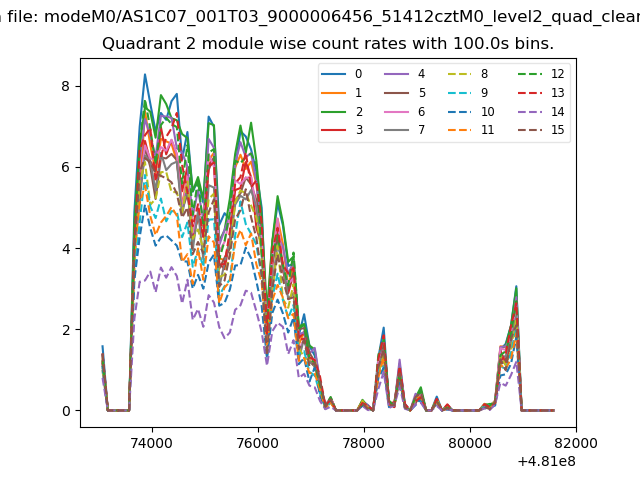
| Module-wise count rates for Quadrant B Data is divided into 100 sec bins |
 |
 |
| Module-wise count rates for Quadrant C Data is divided into 100 sec bins |
 |
 |
| Module-wise count rates for Quadrant D Data is divided into 100 sec bins |
 |
 |
| Parameter | Plot |
|---|---|
| CZT HV Monitor | 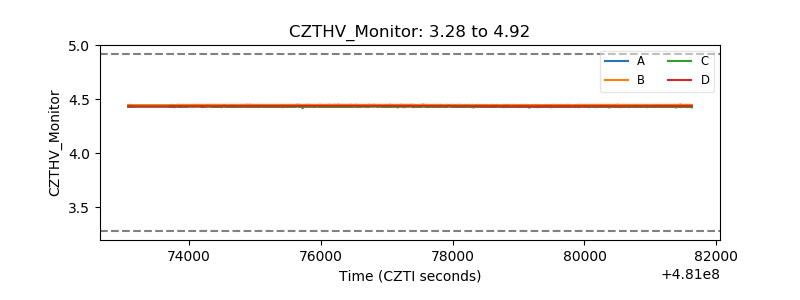 |
| D_VDD | 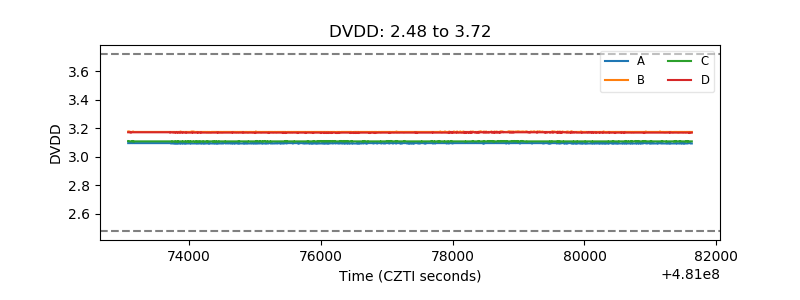 |
| Temperature 1 | 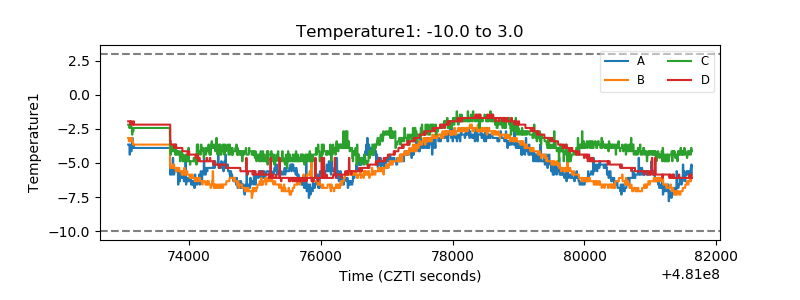 |
| Veto HV Monitor | 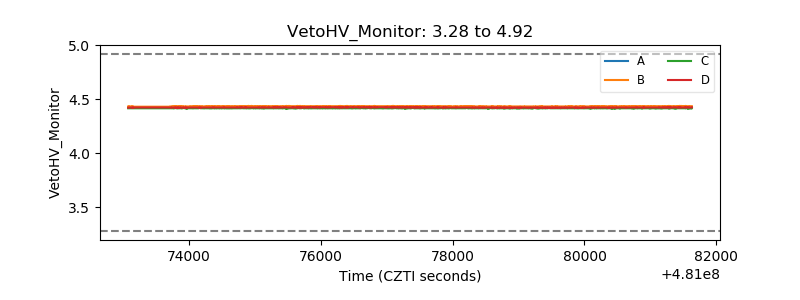 |
| Veto LLD | 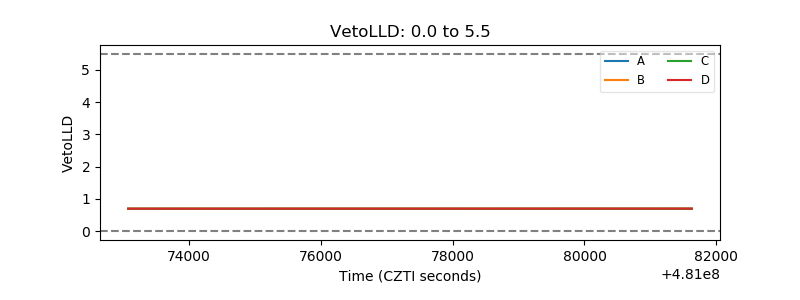 |
| Alpha Counter | 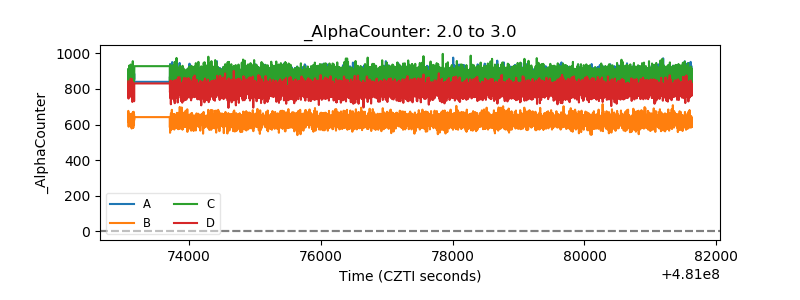 |
| _CPM_Rate | 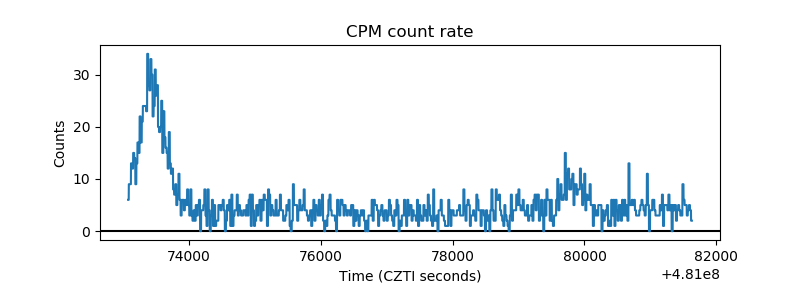 |
| CZT Counter | 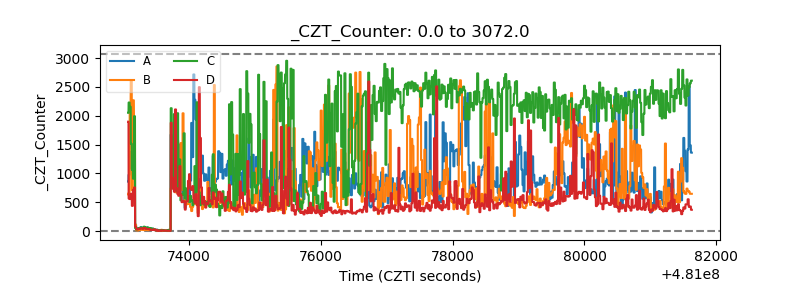 |
| +2.5 Volts monitor | 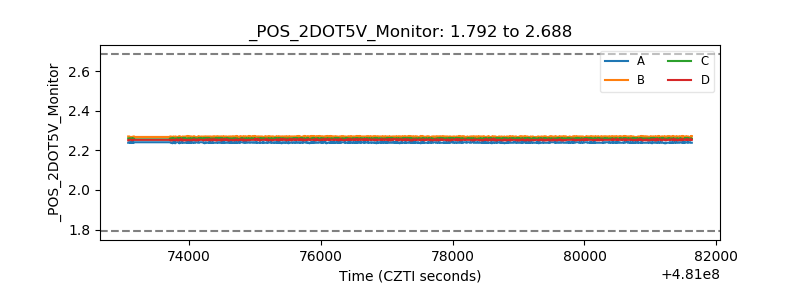 |
| +5 Volts monitor | 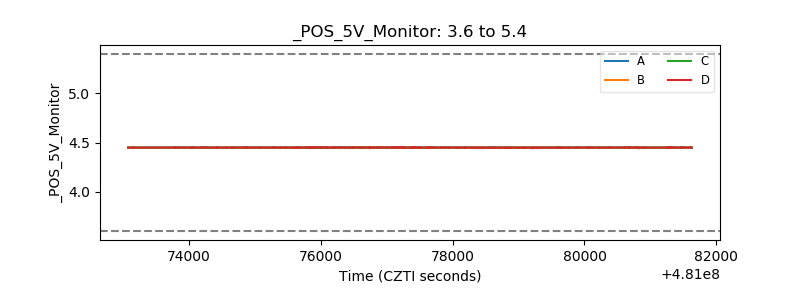 |
| _ROLL_ROT | 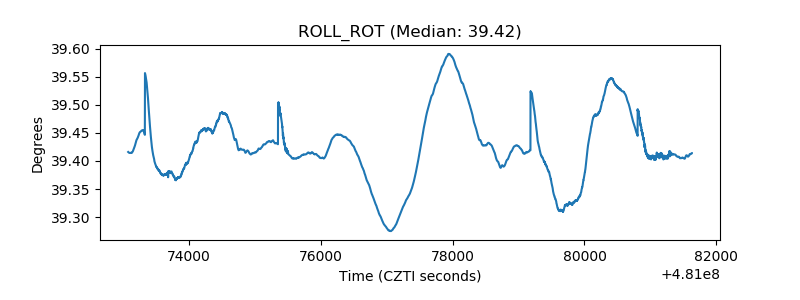 |
| _Roll_DEC | 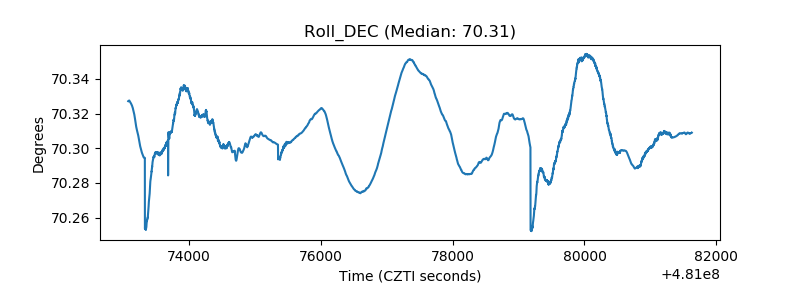 |
| _Roll_RA | 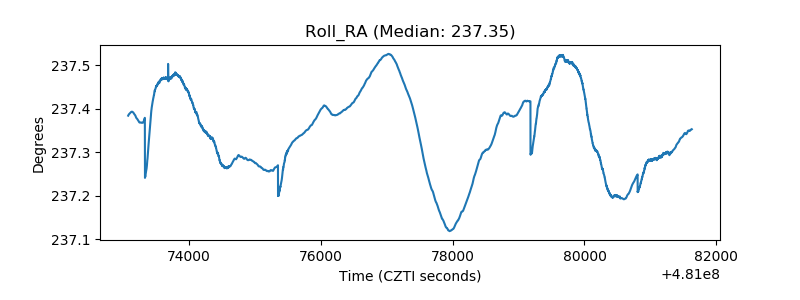 |
| Veto Counter | 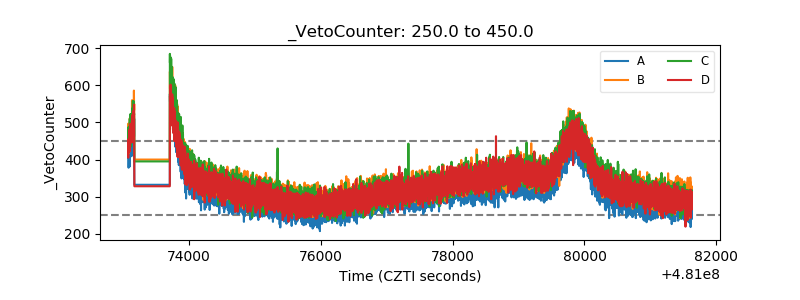 |