| Param | Original file | Final file |
|---|---|---|
| Filename | modeM0/AS1A13_090T01_9000006458cztM0_level2.fits | modeM0/AS1A13_090T01_9000006458cztM0_level2_quad_clean.evt |
| Size (bytes) | 4,805,458,560 | 6,605,712,000 |
| Size | 4.5 GB | 6.2 GB |
| Events in quadrant A | 28,368,376 | 42,141,031 |
| Events in quadrant B | 27,802,000 | 47,554,860 |
| Events in quadrant C | 24,941,969 | 35,194,278 |
| Events in quadrant D | 22,268,574 | 33,220,757 |
| Mode M0 | |||
|---|---|---|---|
| Quadrant | BADHDUFLAG | Total packets | Discarded packets |
| A | 0 | 2265206 | 0 |
| B | 0 | 1787807 | 0 |
| C | 0 | 2388084 | 0 |
| D | 0 | 2575117 | 0 |
| Mode M9 | |||
|---|---|---|---|
| Quadrant | BADHDUFLAG | Total packets | Discarded packets |
| A | 0 | 679 | 0 |
| B | 0 | 680 | 0 |
| C | 0 | 680 | 0 |
| D | 0 | 680 | 0 |
| Mode SS | |||
|---|---|---|---|
| Quadrant | BADHDUFLAG | Total packets | Discarded packets |
| A | 0 | 12301 | 0 |
| B | 0 | 12452 | 0 |
| C | 0 | 12436 | 0 |
| D | 0 | 12434 | 0 |
| Quadrant | Total seconds | Saturated seconds | Saturation percentage |
|---|---|---|---|
| A | 612409 | 86132 | 14.064457% |
| B | 612967 | 58634 | 9.565605% |
| C | 612361 | 146901 | 23.989281% |
| D | 612662 | 144899 | 23.650724% |
Noise dominated data is calculated using 1-second bins in cleaned event files. If a bin has >2000 counts, and if more than 50% of those come from <1% of pixels, then it is considered to be noise-dominated and hence unusable.
| Quadrant | # 1 sec bins | Bins with >0 counts | Bins with >2000 counts | High rate bins dominated by noise | Noise dominated (total time) | Noise dominated (detector-on time) | Marked lightcurve |
|---|---|---|---|---|---|---|---|
| A | 777732 | 612274 | 0 | 0 | 0.00% | 0.00% | 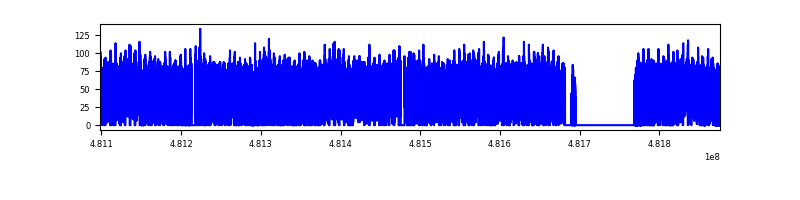 |
| B | 777733 | 613549 | 0 | 0 | 0.00% | 0.00% | 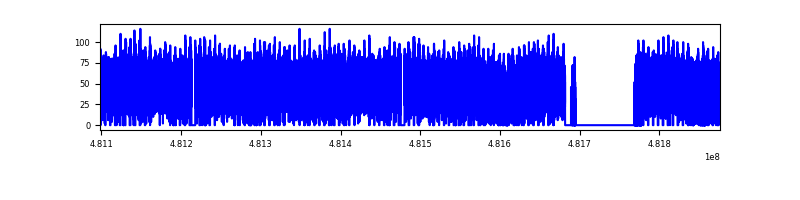 |
| C | 777725 | 600092 | 0 | 0 | 0.00% | 0.00% | 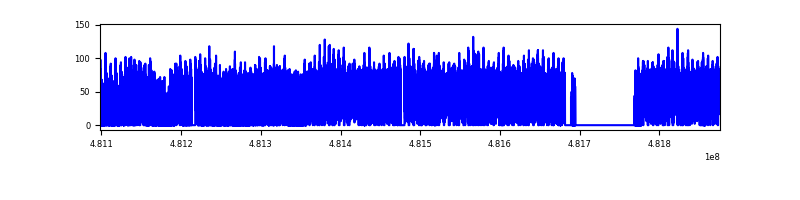 |
| D | 777732 | 605693 | 0 | 0 | 0.00% | 0.00% | 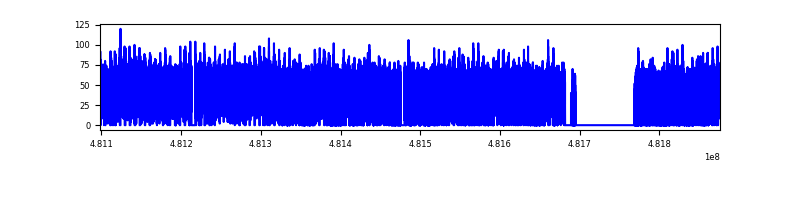 |
Top three noisy pixels from each quadrant. If the there are fewer than three noisy pixels in the level2.evt file, extra rows are filled as -1
| Pixel properties | Quadrant properties | ||||||
|---|---|---|---|---|---|---|---|
| Quadrant | DetID | PixID | Counts | Sigma | Mean | Median | Sigma |
| A | 14 | 188 | 29722 | 9.33 | 7495 | 6917 | 2443.5 |
| A | 9 | 255 | 28957 | 9.02 | 7495 | 6917 | 2443.5 |
| A | 14 | 95 | 23808 | 6.91 | 7495 | 6917 | 2443.5 |
| B | 3 | 25 | 22862 | 9.32 | 7386 | 6969 | 1706.1 |
| B | 9 | 173 | 22372 | 9.03 | 7386 | 6969 | 1706.1 |
| B | 2 | 245 | 22272 | 8.97 | 7386 | 6969 | 1706.1 |
| C | 15 | 175 | 19800 | 6.08 | 6704 | 6106 | 2252.3 |
| C | 2 | 31 | 19752 | 6.06 | 6704 | 6106 | 2252.3 |
| C | 15 | 127 | 19749 | 6.06 | 6704 | 6106 | 2252.3 |
| D | 6 | 218 | 28411 | 10.63 | 6394 | 5667 | 2139.9 |
| D | 3 | 30 | 22008 | 7.64 | 6394 | 5667 | 2139.9 |
| D | 15 | 11 | 20212 | 6.8 | 6394 | 5667 | 2139.9 |
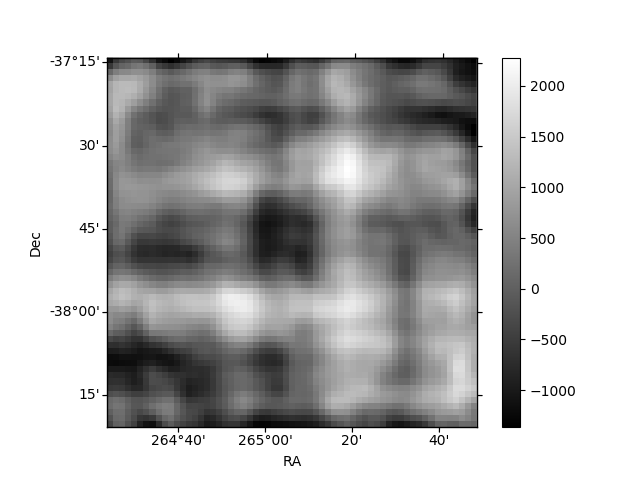
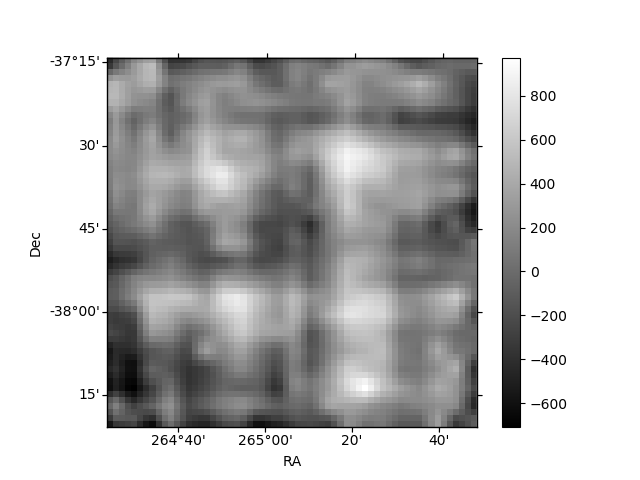
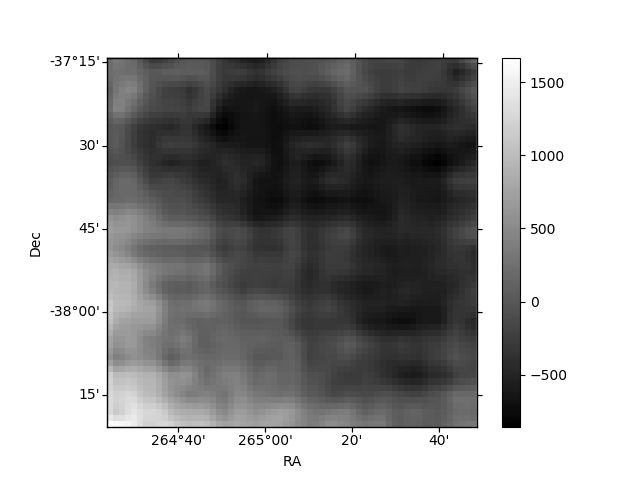
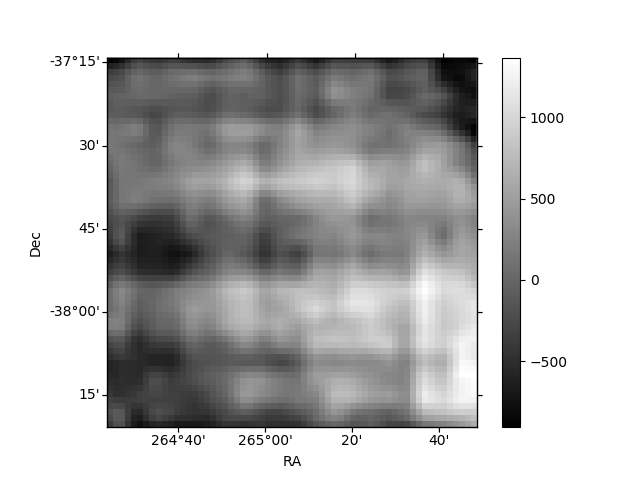
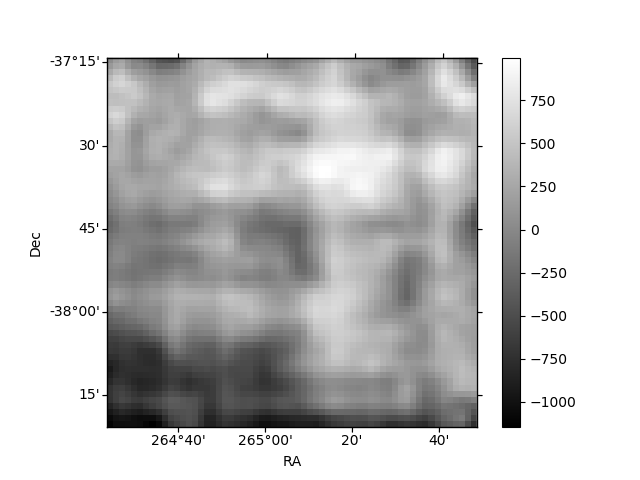
Histogram calculated using DETX and DETY for each event in the final _common_clean file
| Quadrant A | 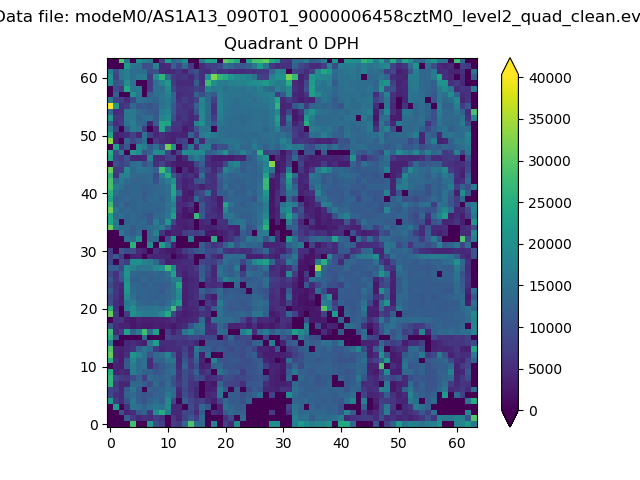 |
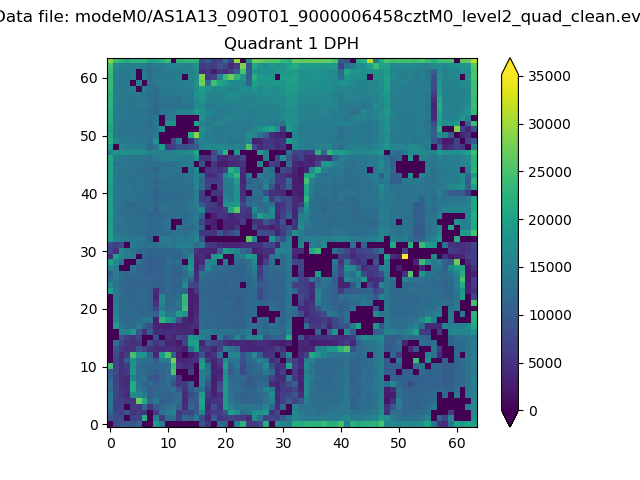 |
Quadrant B |
|---|---|---|---|
| Quadrant D | 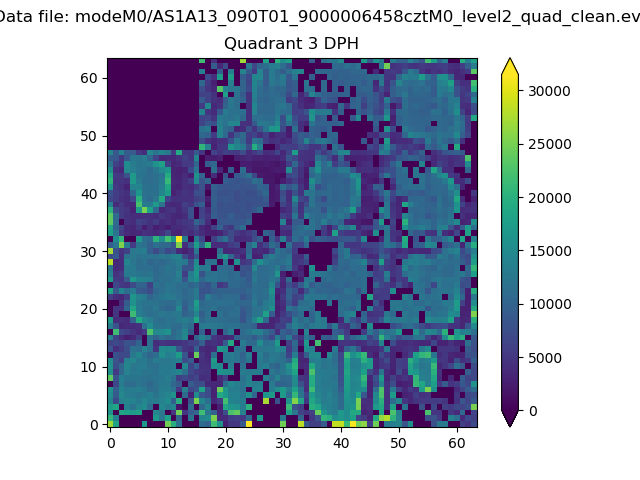 |
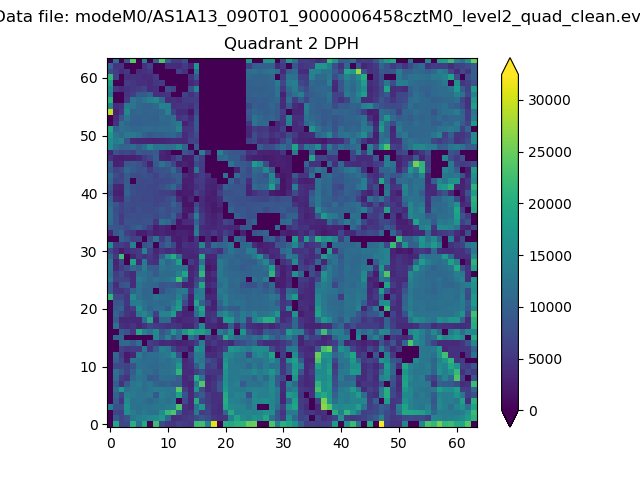 |
Quadrant C |
| Plot type | Count rate plots | Images |
|---|---|---|
| Comparison with Poisson distribution Blue bars denote a histogram of data divided into 1 sec bins. Red curve is a Poisson curve with rate = median count rate of data. |
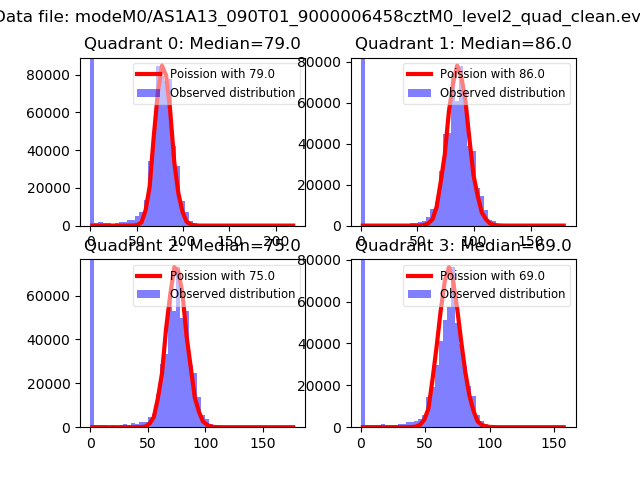 |
 |
| Quadrant-wise count rates Data is divided into 100 sec bins |
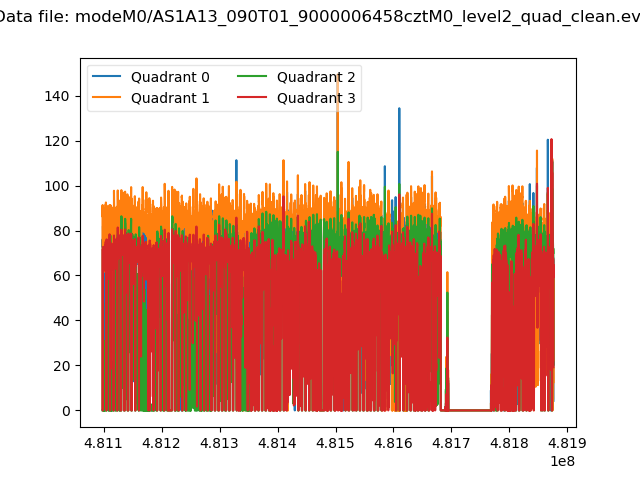 |
|
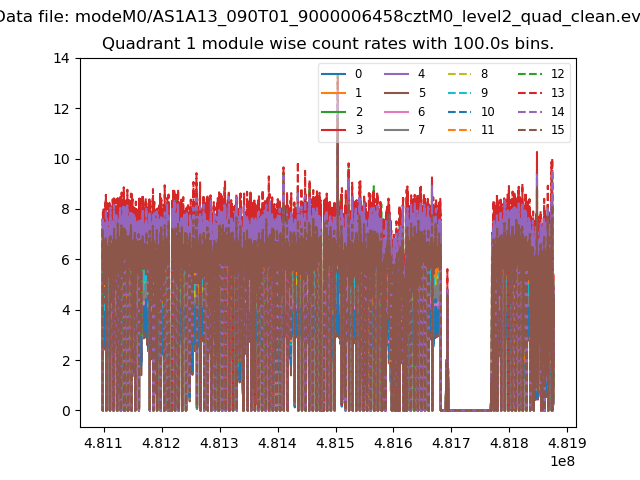
| Module-wise count rates for Quadrant A Data is divided into 100 sec bins |
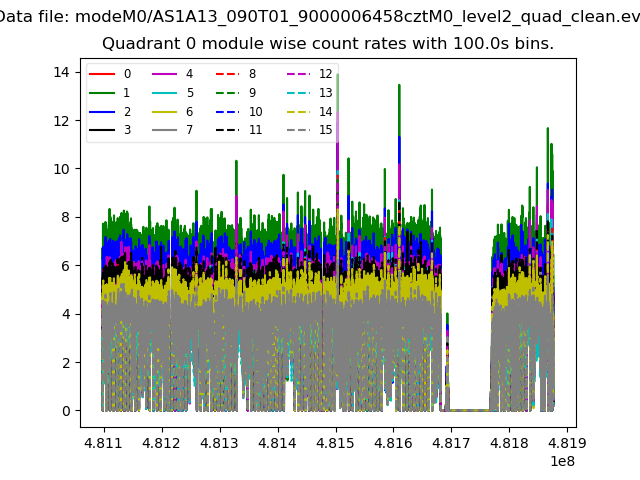 |
 |
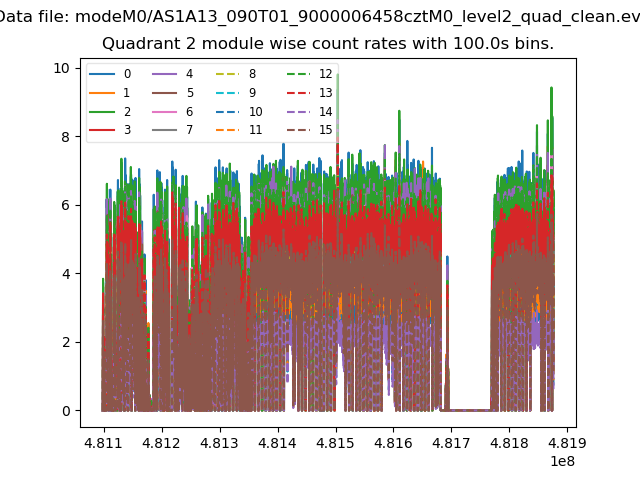
| Module-wise count rates for Quadrant B Data is divided into 100 sec bins |
 |
 |
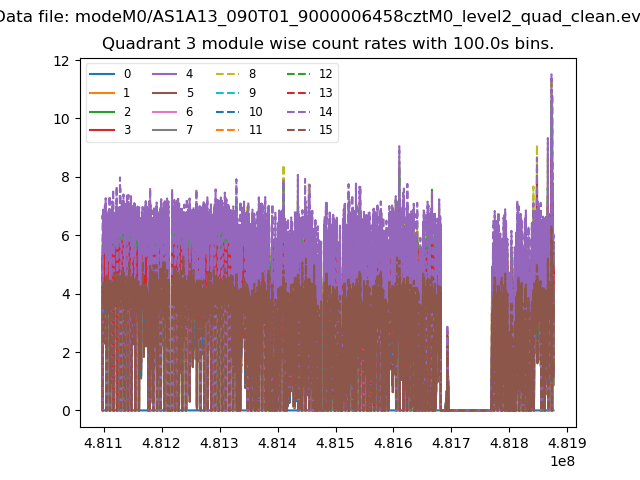
| Module-wise count rates for Quadrant C Data is divided into 100 sec bins |
 |
 |
| Module-wise count rates for Quadrant D Data is divided into 100 sec bins |
 |
 |
| Parameter | Plot |
|---|---|
| CZT HV Monitor | 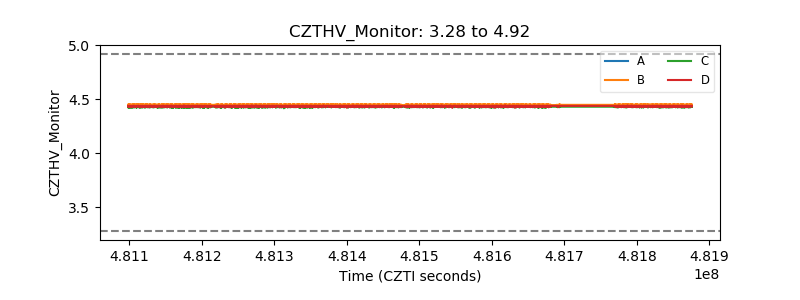 |
| D_VDD | 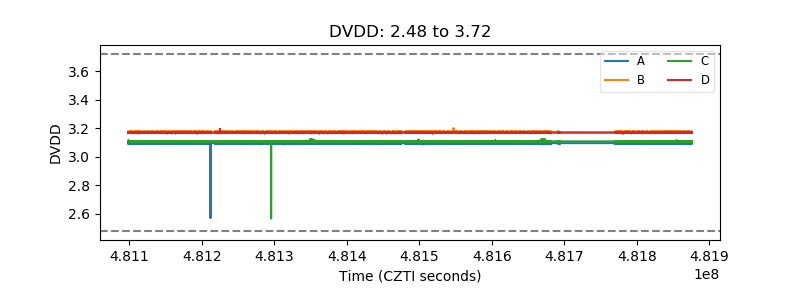 |
| Temperature 1 | 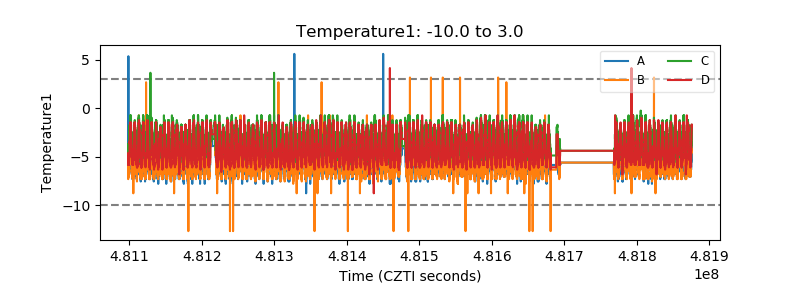 |
| Veto HV Monitor | 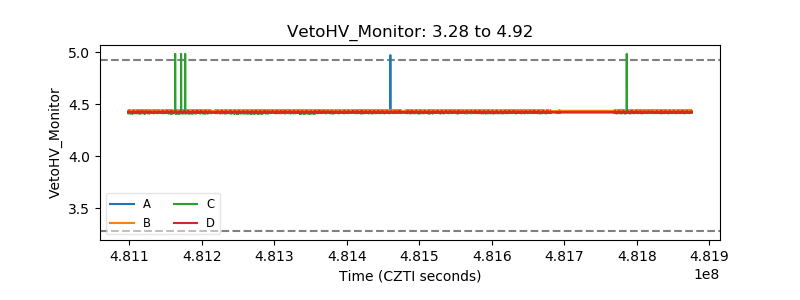 |
| Veto LLD | 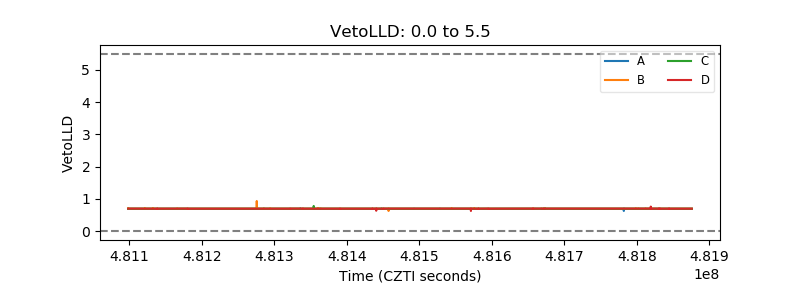 |
| Alpha Counter | 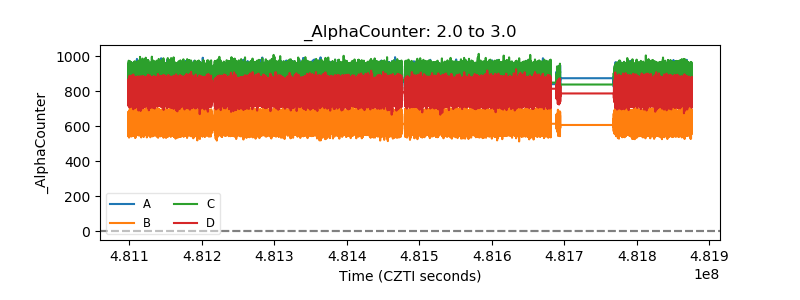 |
| _CPM_Rate | 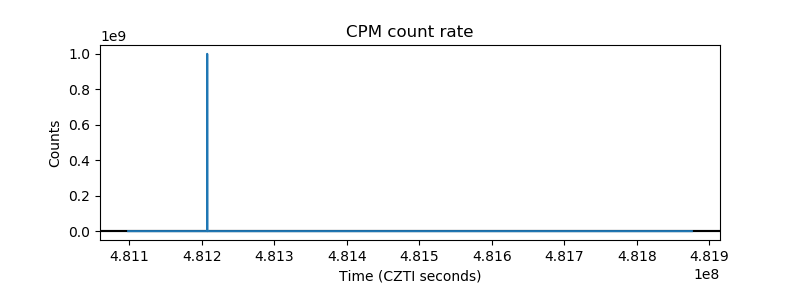 |
| CZT Counter | 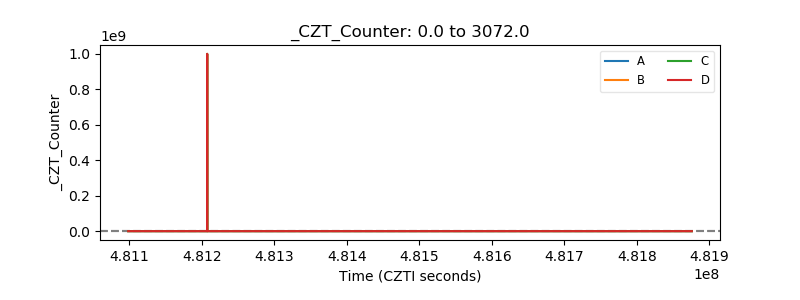 |
| +2.5 Volts monitor | 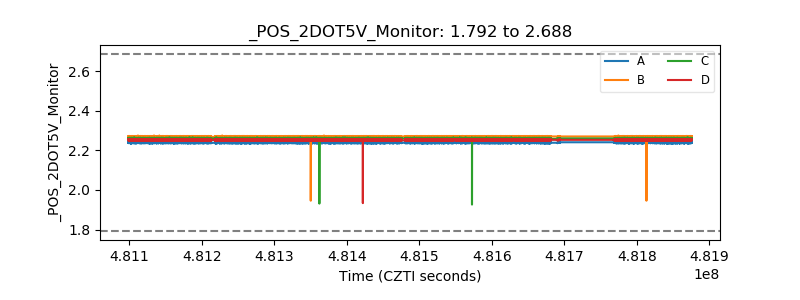 |
| +5 Volts monitor | 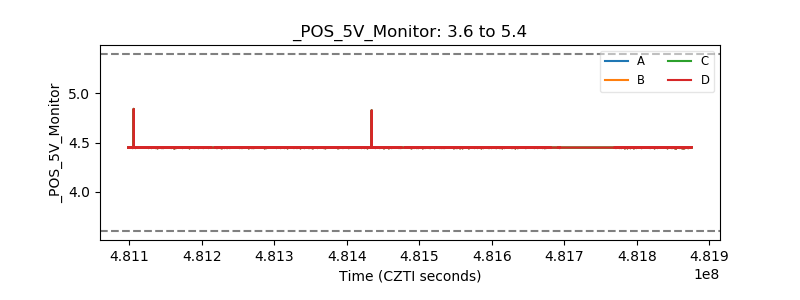 |
| _ROLL_ROT | 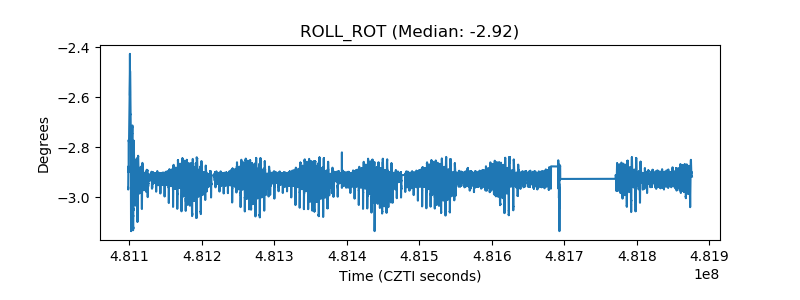 |
| _Roll_DEC | 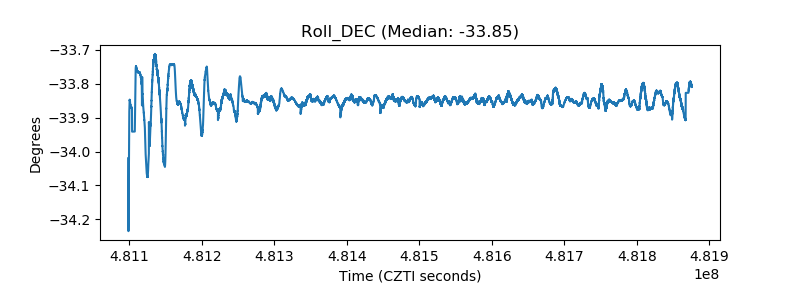 |
| _Roll_RA | 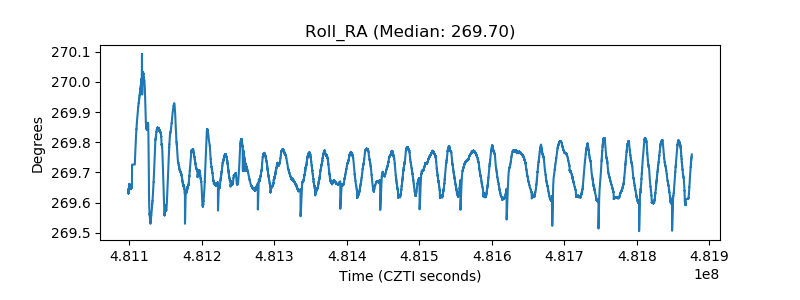 |
| Veto Counter | 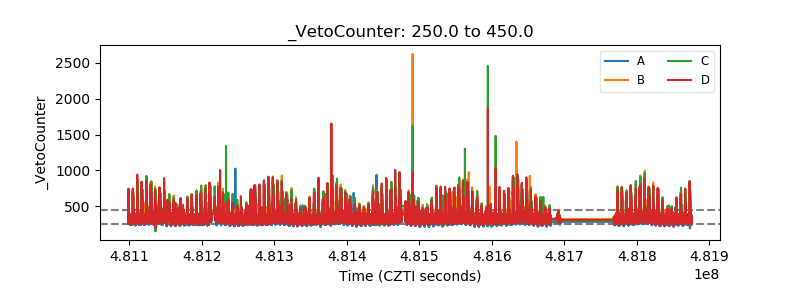 |