| Param | Original file | Final file |
|---|---|---|
| Filename | modeM0/AS1A13_090T01_9000006458_51417cztM0_level2.fits | modeM0/AS1A13_090T01_9000006458_51417cztM0_level2_quad_clean.evt |
| Size (bytes) | 878,135,040 | 83,059,200 |
| Size | 837.5 MB | 79.2 MB |
| Events in quadrant A | 5,837,467 | 609,731 |
| Events in quadrant B | 4,998,859 | 700,221 |
| Events in quadrant C | 16,746,912 | 114,889 |
| Events in quadrant D | 4,357,249 | 583,701 |
| Mode M0 | |||
|---|---|---|---|
| Quadrant | BADHDUFLAG | Total packets | Discarded packets |
| A | 0 | 22242 | 2 |
| B | 0 | 19848 | 2 |
| C | 0 | 54620 | 2 |
| D | 0 | 18130 | 2 |
| Mode M9 | |||
|---|---|---|---|
| Quadrant | BADHDUFLAG | Total packets | Discarded packets |
| A | 0 | 8 | 0 |
| B | 0 | 8 | 0 |
| C | 0 | 8 | 0 |
| D | 0 | 8 | 0 |
| Mode SS | |||
|---|---|---|---|
| Quadrant | BADHDUFLAG | Total packets | Discarded packets |
| A | 0 | 150 | 0 |
| B | 0 | 150 | 0 |
| C | 0 | 150 | 0 |
| D | 0 | 150 | 0 |
| Quadrant | Total seconds | Saturated seconds | Saturation percentage |
|---|---|---|---|
| A | 7279 | 878 | 12.062096% |
| B | 7279 | 486 | 6.676741% |
| C | 7279 | 6191 | 85.052892% |
| D | 7279 | 424 | 5.824976% |
Noise dominated data is calculated using 1-second bins in cleaned event files. If a bin has >2000 counts, and if more than 50% of those come from <1% of pixels, then it is considered to be noise-dominated and hence unusable.
| Quadrant | # 1 sec bins | Bins with >0 counts | Bins with >2000 counts | High rate bins dominated by noise | Noise dominated (total time) | Noise dominated (detector-on time) | Marked lightcurve |
|---|---|---|---|---|---|---|---|
| A | 7919 | 7283 | 487 | 487 | 6.15% | 6.69% | 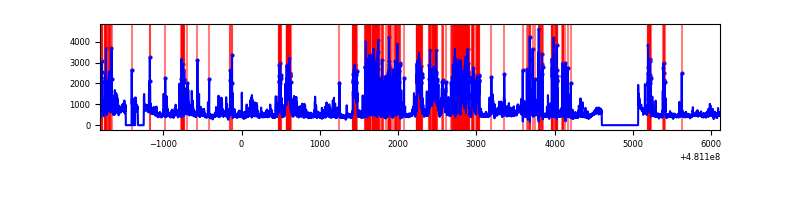 |
| B | 7919 | 7283 | 156 | 156 | 1.97% | 2.14% | 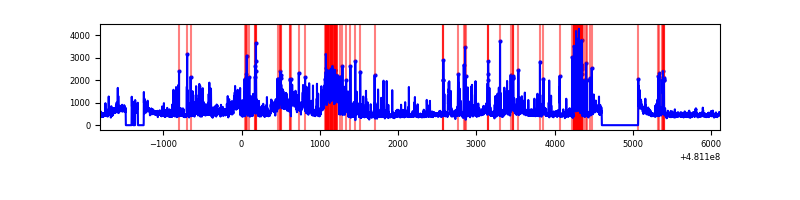 |
| C | 7919 | 7280 | 5496 | 5496 | 69.40% | 75.49% | 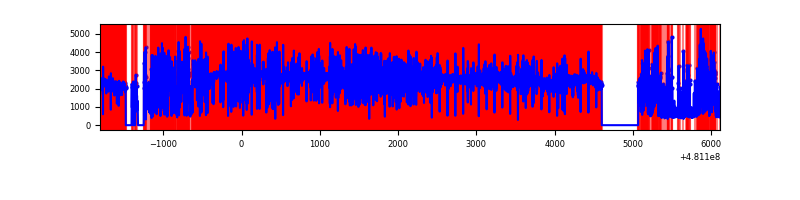 |
| D | 7919 | 7283 | 145 | 145 | 1.83% | 1.99% | 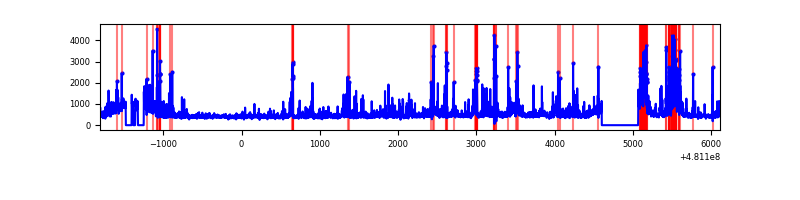 |
Top three noisy pixels from each quadrant. If the there are fewer than three noisy pixels in the level2.evt file, extra rows are filled as -1
| Pixel properties | Quadrant properties | ||||||
|---|---|---|---|---|---|---|---|
| Quadrant | DetID | PixID | Counts | Sigma | Mean | Median | Sigma |
| A | 12 | 250 | 1238602 | 6444.66 | 780 | 757 | 192.1 |
| A | 13 | 248 | 367916 | 1911.56 | 780 | 757 | 192.1 |
| A | 8 | 249 | 229849 | 1192.73 | 780 | 757 | 192.1 |
| B | 5 | 185 | 695089 | 4097.28 | 787 | 757 | 169.5 |
| B | 10 | 254 | 387931 | 2284.73 | 787 | 757 | 169.5 |
| B | 7 | 252 | 125409 | 735.58 | 787 | 757 | 169.5 |
| C | 15 | 179 | 7000509 | 74942.69 | 341 | 339 | 93.4 |
| C | 4 | 12 | 6413863 | 68662.16 | 341 | 339 | 93.4 |
| C | 15 | 230 | 787969 | 8432.24 | 341 | 339 | 93.4 |
| D | 6 | 42 | 440523 | 2064.9 | 776 | 749 | 213.0 |
| D | 3 | 12 | 131999 | 616.27 | 776 | 749 | 213.0 |
| D | 2 | 153 | 122142 | 569.98 | 776 | 749 | 213.0 |
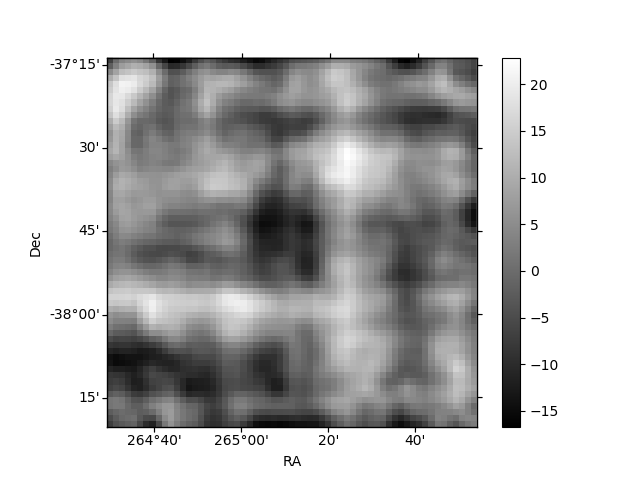
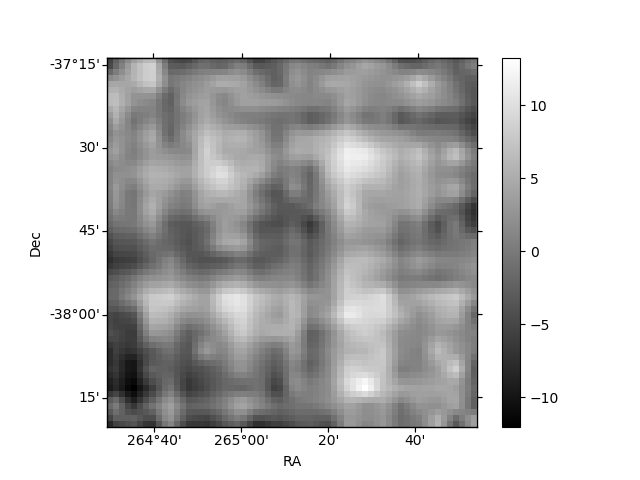
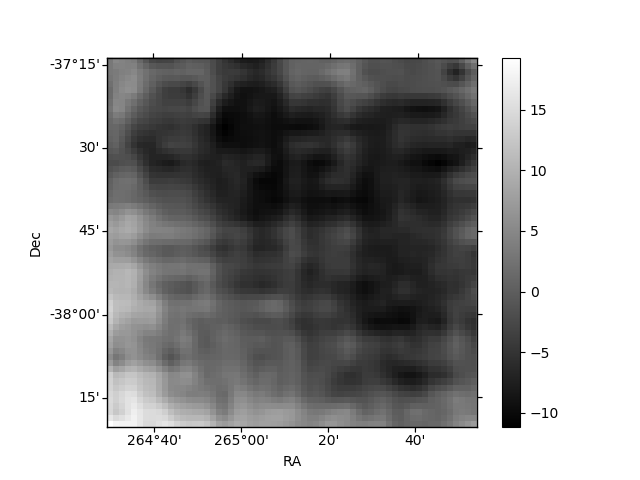
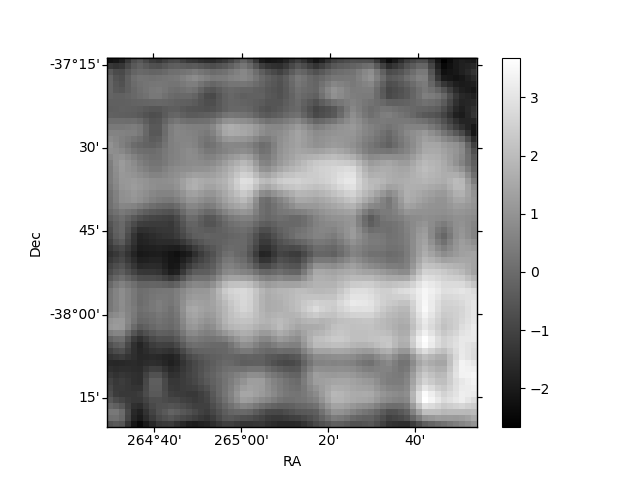
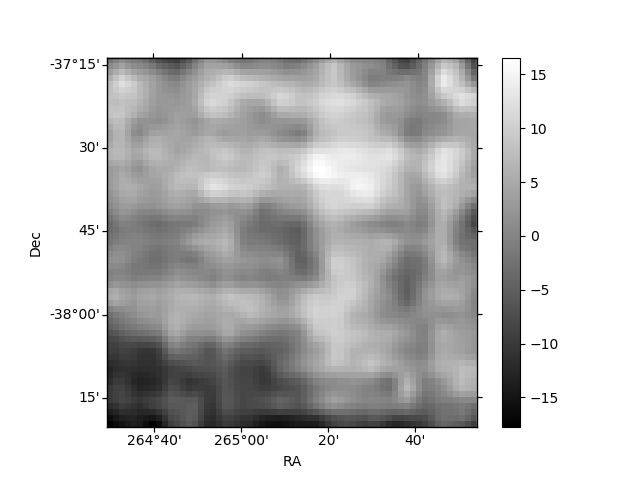
Histogram calculated using DETX and DETY for each event in the final _common_clean file
| Quadrant A | 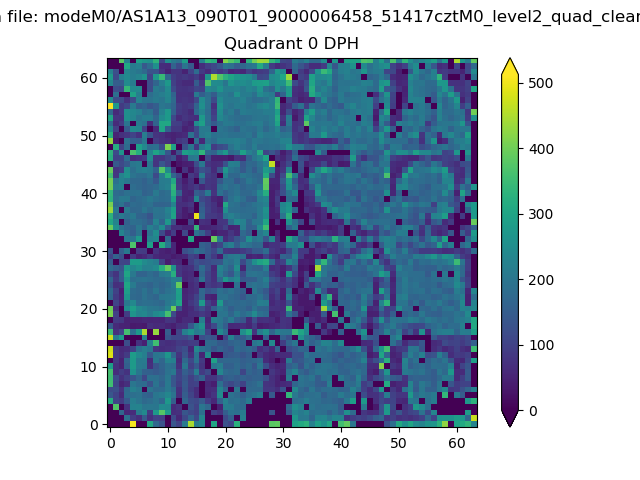 |
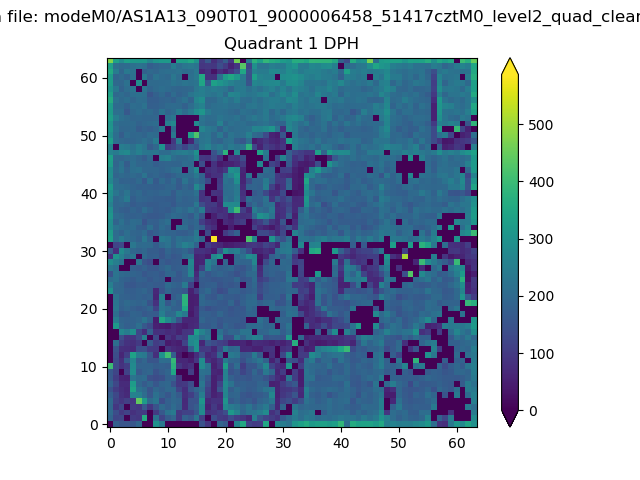 |
Quadrant B |
|---|---|---|---|
| Quadrant D | 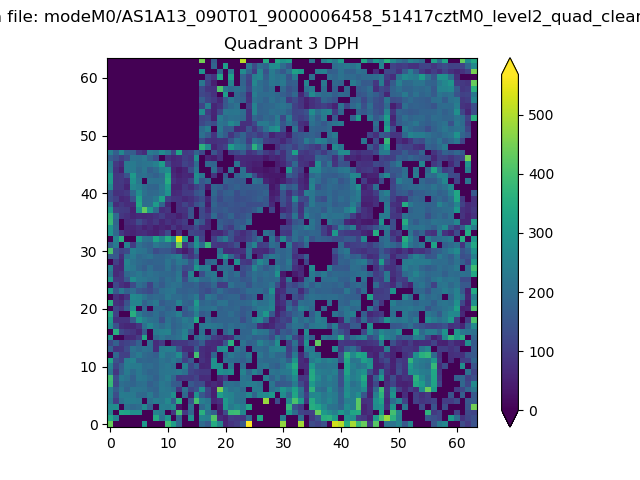 |
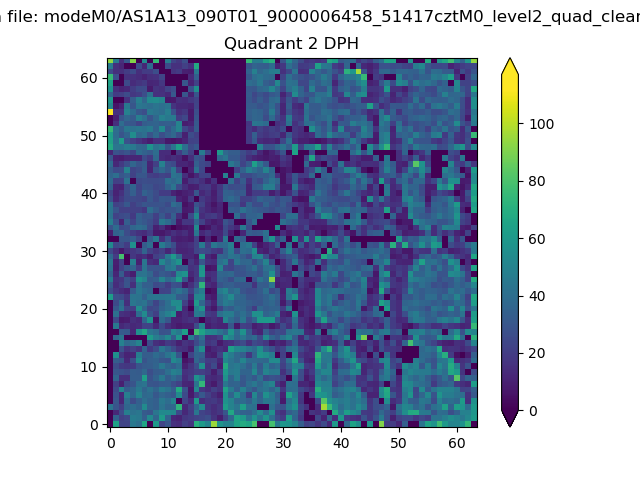 |
Quadrant C |
| Plot type | Count rate plots | Images |
|---|---|---|
| Comparison with Poisson distribution Blue bars denote a histogram of data divided into 1 sec bins. Red curve is a Poisson curve with rate = median count rate of data. |
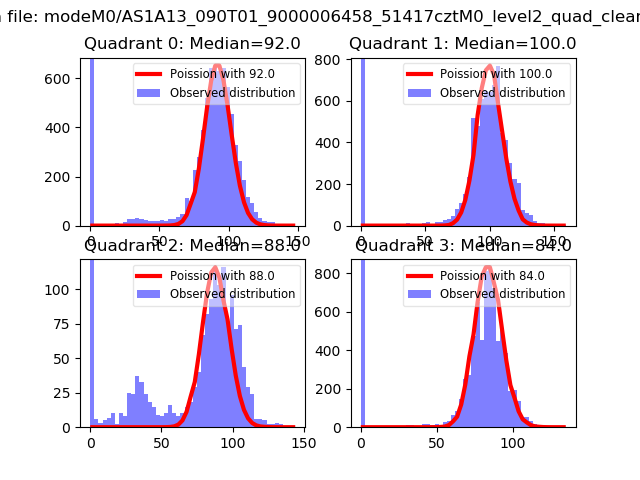 |
 |
| Quadrant-wise count rates Data is divided into 100 sec bins |
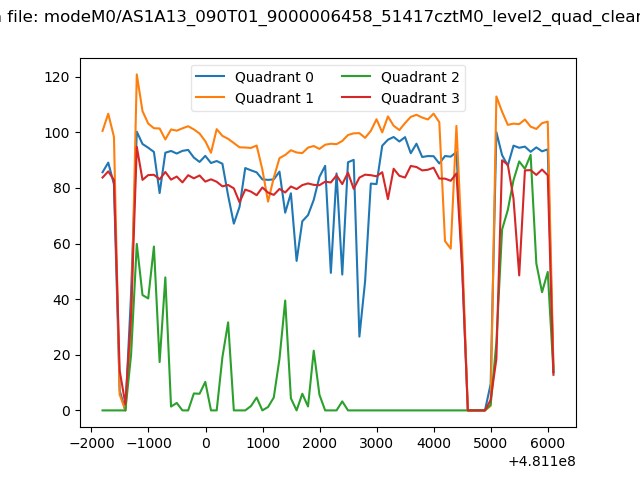 |
|
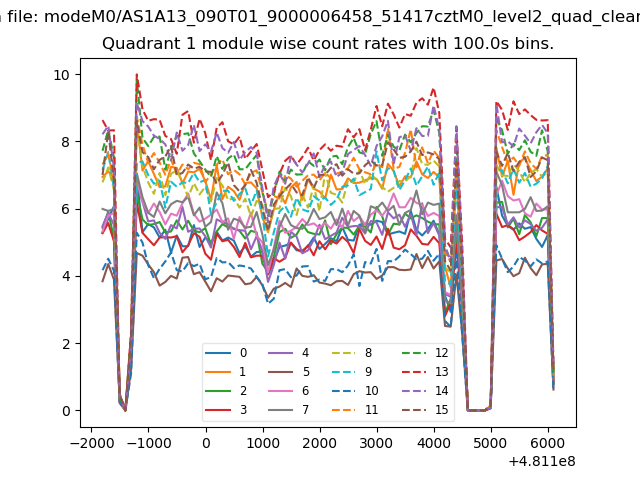
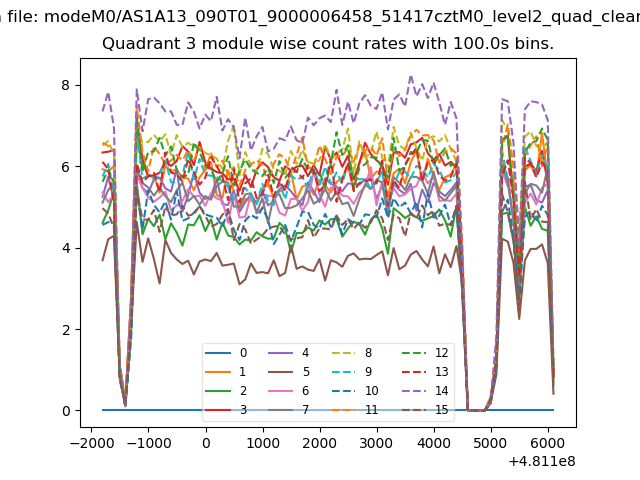
| Module-wise count rates for Quadrant A Data is divided into 100 sec bins |
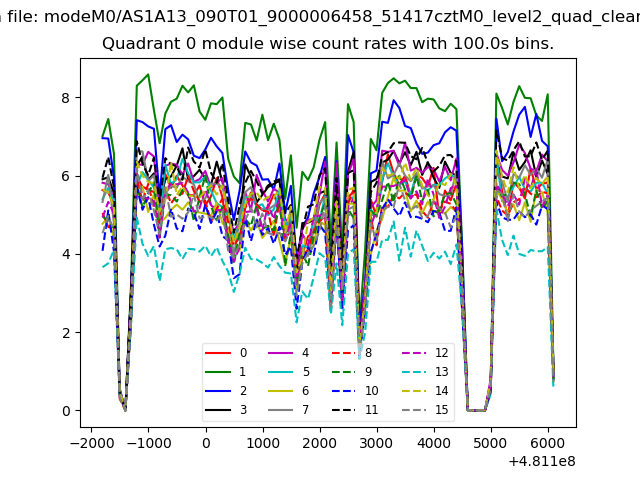 |
 |
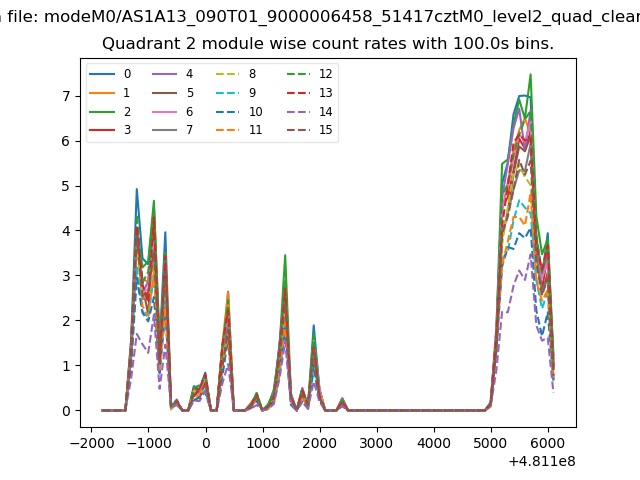
| Module-wise count rates for Quadrant B Data is divided into 100 sec bins |
 |
 |
| Module-wise count rates for Quadrant C Data is divided into 100 sec bins |
 |
 |
| Module-wise count rates for Quadrant D Data is divided into 100 sec bins |
 |
 |
| Parameter | Plot |
|---|---|
| CZT HV Monitor | 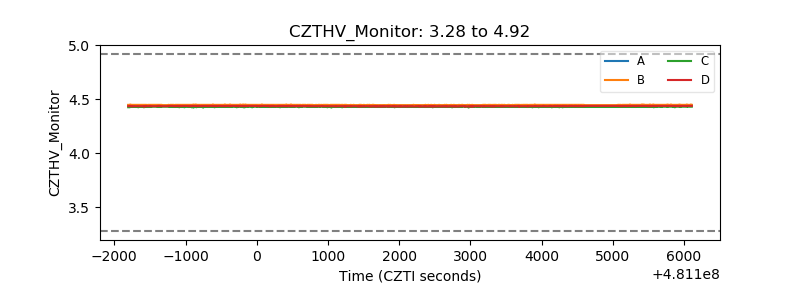 |
| D_VDD | 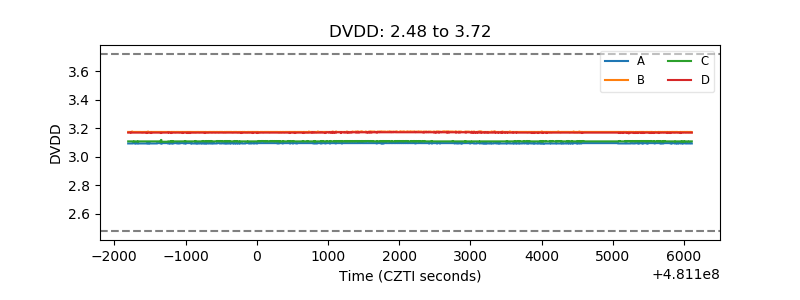 |
| Temperature 1 | 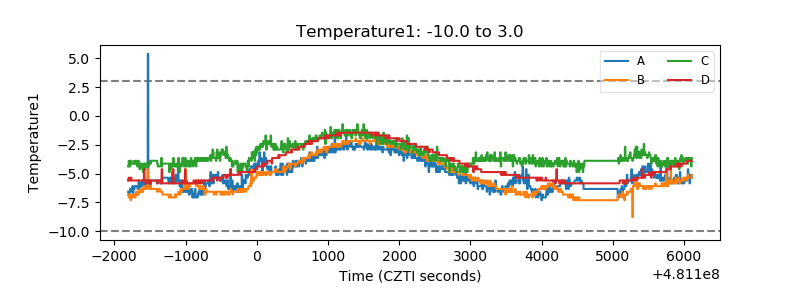 |
| Veto HV Monitor |  |
| Veto LLD | 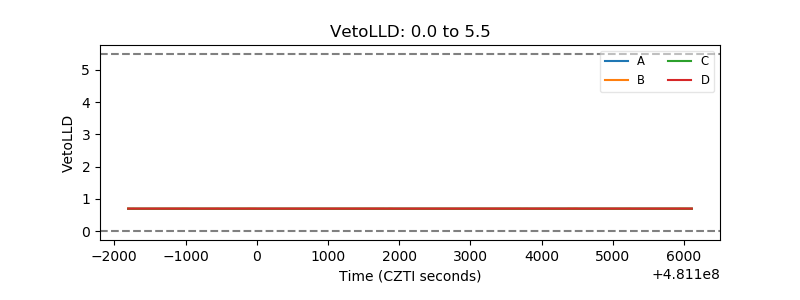 |
| Alpha Counter | 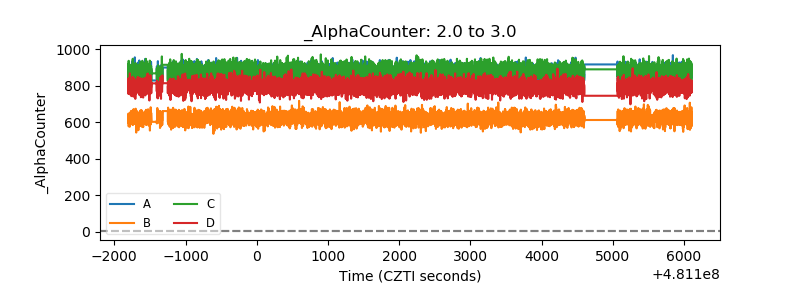 |
| _CPM_Rate | 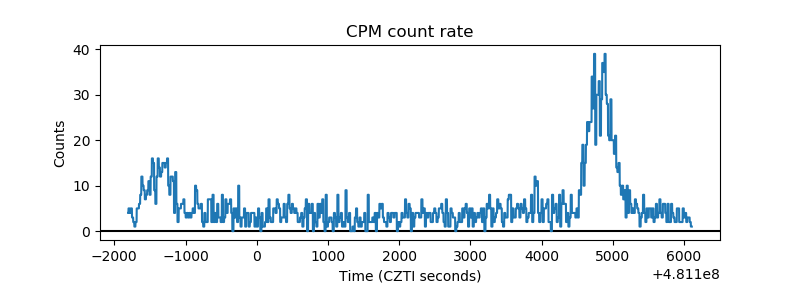 |
| CZT Counter | 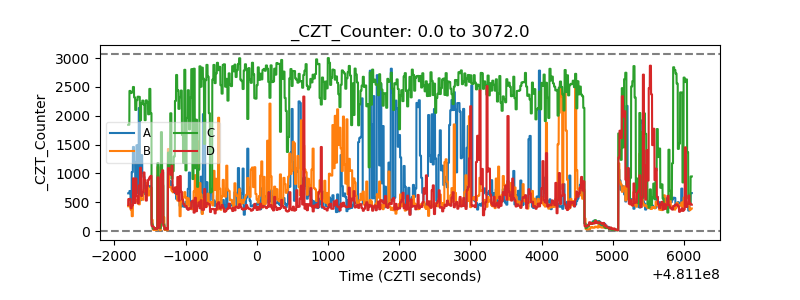 |
| +2.5 Volts monitor |  |
| +5 Volts monitor | 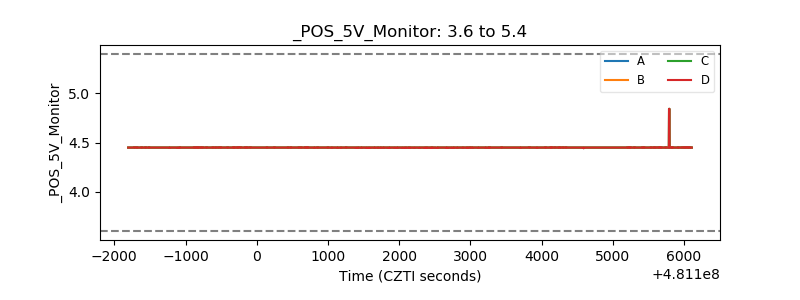 |
| _ROLL_ROT | 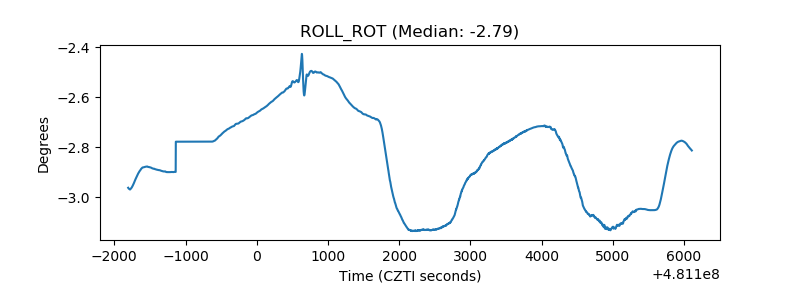 |
| _Roll_DEC | 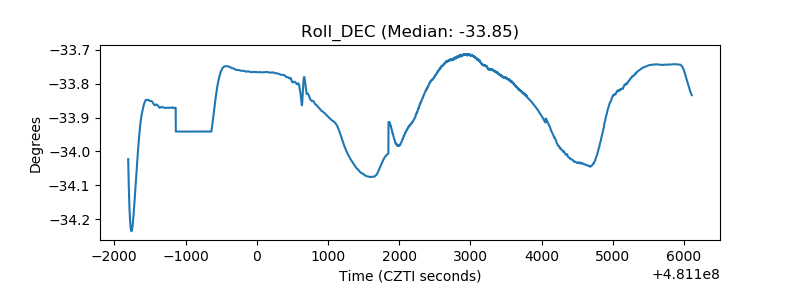 |
| _Roll_RA | 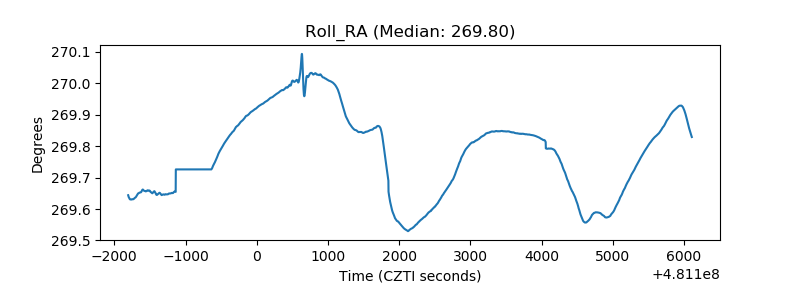 |
| Veto Counter | 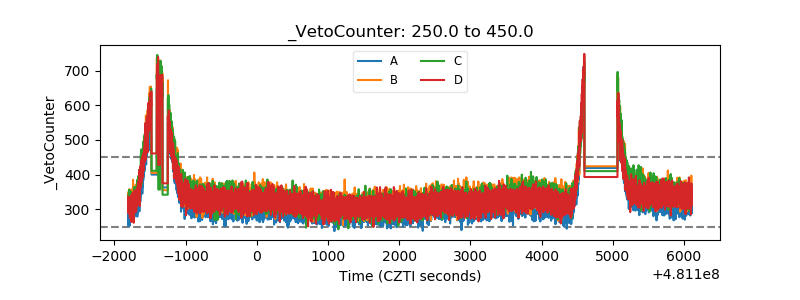 |