| Param | Original file | Final file |
|---|---|---|
| Filename | modeM0/AS1A13_090T01_9000006458_51418cztM0_level2.fits | modeM0/AS1A13_090T01_9000006458_51418cztM0_level2_quad_clean.evt |
| Size (bytes) | 1,414,719,360 | 145,045,440 |
| Size | 1.3 GB | 138.3 MB |
| Events in quadrant A | 8,807,248 | 1,071,373 |
| Events in quadrant B | 9,222,555 | 1,164,773 |
| Events in quadrant C | 26,459,477 | 330,962 |
| Events in quadrant D | 6,944,061 | 987,985 |
| Mode M0 | |||
|---|---|---|---|
| Quadrant | BADHDUFLAG | Total packets | Discarded packets |
| A | 0 | 34258 | 2 |
| B | 0 | 35887 | 2 |
| C | 0 | 86812 | 2 |
| D | 0 | 29233 | 2 |
| Mode M9 | |||
|---|---|---|---|
| Quadrant | BADHDUFLAG | Total packets | Discarded packets |
| A | 0 | 16 | 0 |
| B | 0 | 16 | 0 |
| C | 0 | 16 | 0 |
| D | 0 | 16 | 0 |
| Mode SS | |||
|---|---|---|---|
| Quadrant | BADHDUFLAG | Total packets | Discarded packets |
| A | 0 | 244 | 0 |
| B | 0 | 244 | 0 |
| C | 0 | 244 | 0 |
| D | 0 | 244 | 0 |
| Quadrant | Total seconds | Saturated seconds | Saturation percentage |
|---|---|---|---|
| A | 12094 | 699 | 5.779725% |
| B | 12095 | 683 | 5.646962% |
| C | 12095 | 8873 | 73.360893% |
| D | 12095 | 435 | 3.596527% |
Noise dominated data is calculated using 1-second bins in cleaned event files. If a bin has >2000 counts, and if more than 50% of those come from <1% of pixels, then it is considered to be noise-dominated and hence unusable.
| Quadrant | # 1 sec bins | Bins with >0 counts | Bins with >2000 counts | High rate bins dominated by noise | Noise dominated (total time) | Noise dominated (detector-on time) | Marked lightcurve |
|---|---|---|---|---|---|---|---|
| A | 13624 | 12094 | 402 | 402 | 2.95% | 3.32% | 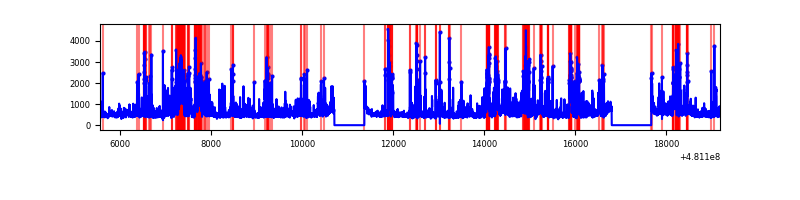 |
| B | 13625 | 12095 | 255 | 255 | 1.87% | 2.11% | 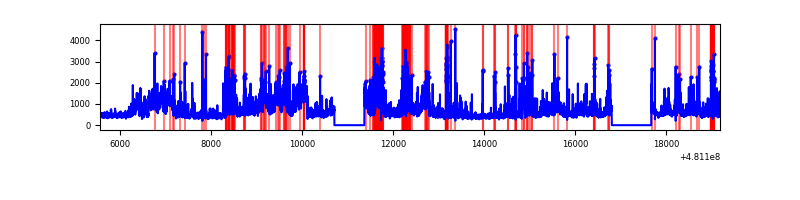 |
| C | 13625 | 12095 | 7897 | 7897 | 57.96% | 65.29% | 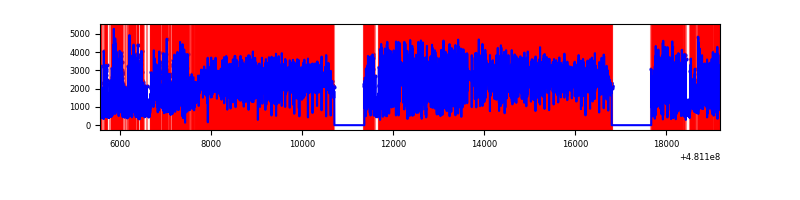 |
| D | 13625 | 12096 | 251 | 251 | 1.84% | 2.08% | 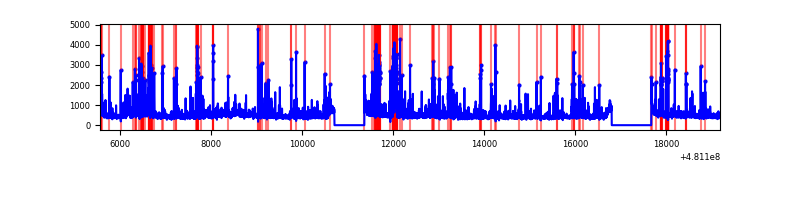 |
Top three noisy pixels from each quadrant. If the there are fewer than three noisy pixels in the level2.evt file, extra rows are filled as -1
| Pixel properties | Quadrant properties | ||||||
|---|---|---|---|---|---|---|---|
| Quadrant | DetID | PixID | Counts | Sigma | Mean | Median | Sigma |
| A | 12 | 250 | 884950 | 2781.05 | 1288 | 1252 | 317.8 |
| A | 15 | 174 | 859614 | 2701.32 | 1288 | 1252 | 317.8 |
| A | 4 | 175 | 507607 | 1593.53 | 1288 | 1252 | 317.8 |
| B | 10 | 254 | 1754232 | 6445.82 | 1274 | 1226 | 272.0 |
| B | 5 | 172 | 750239 | 2754.13 | 1274 | 1226 | 272.0 |
| B | 5 | 185 | 505796 | 1855.31 | 1274 | 1226 | 272.0 |
| C | 4 | 12 | 10132802 | 48303.19 | 768 | 767 | 209.8 |
| C | 15 | 179 | 8983059 | 42821.93 | 768 | 767 | 209.8 |
| C | 15 | 230 | 2210218 | 10533.28 | 768 | 767 | 209.8 |
| D | 6 | 42 | 489531 | 1395.11 | 1261 | 1213 | 350.0 |
| D | 2 | 153 | 287205 | 817.07 | 1261 | 1213 | 350.0 |
| D | 3 | 12 | 265002 | 753.64 | 1261 | 1213 | 350.0 |
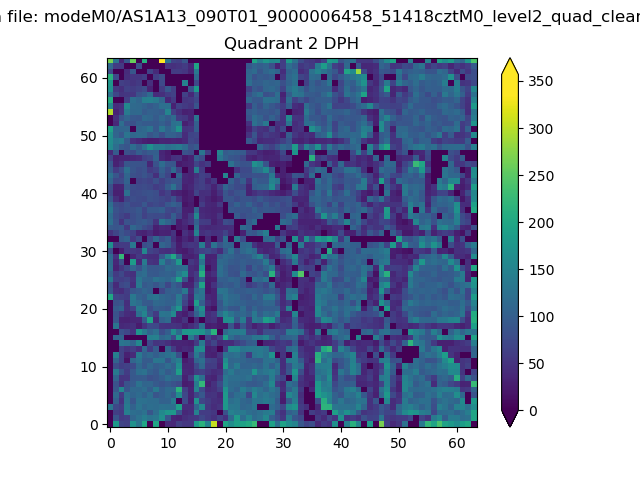
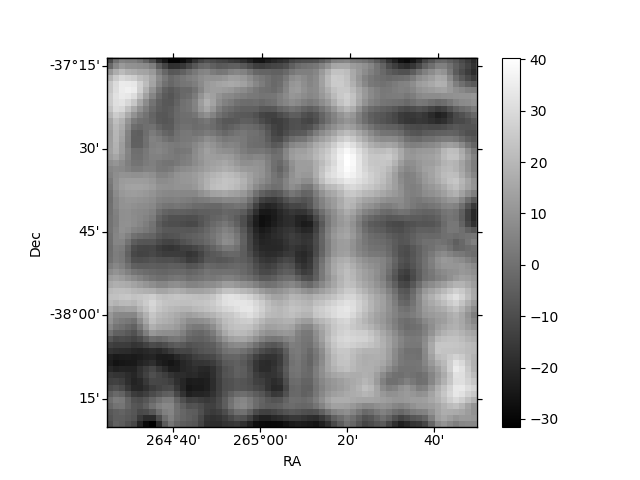
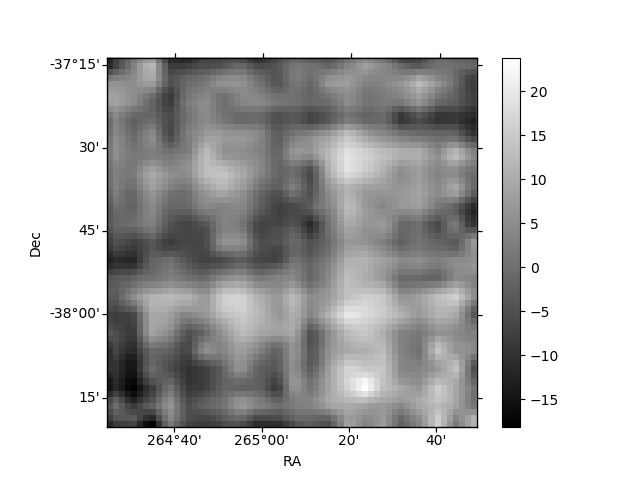
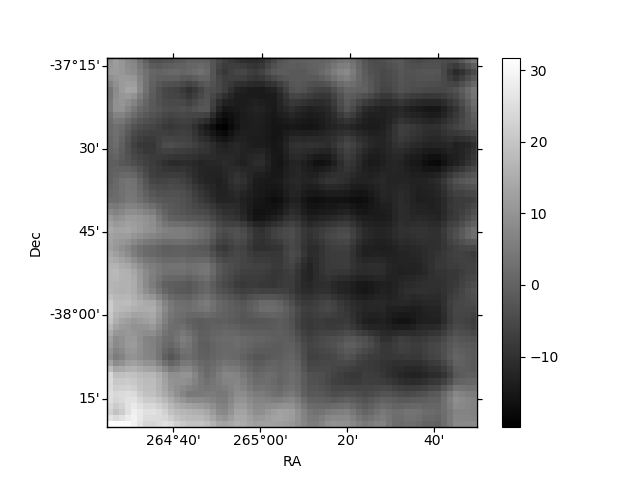
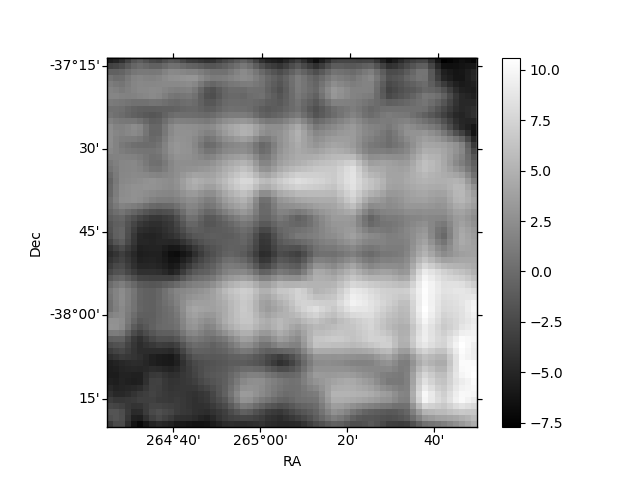
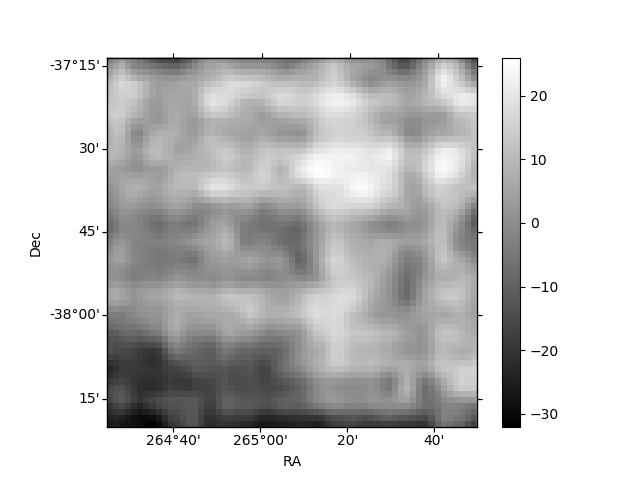
Histogram calculated using DETX and DETY for each event in the final _common_clean file
| Quadrant A | 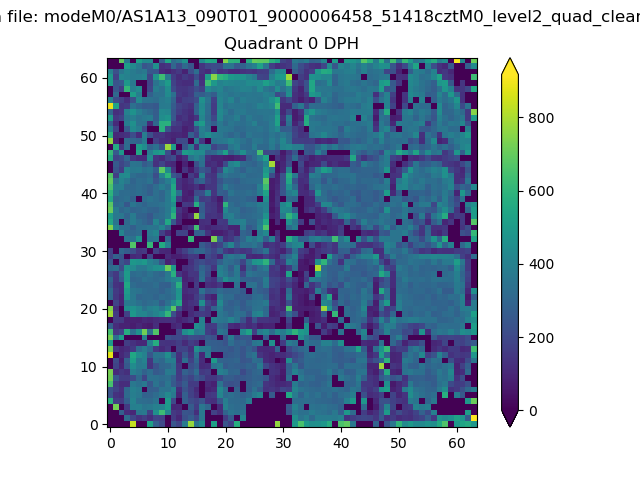 |
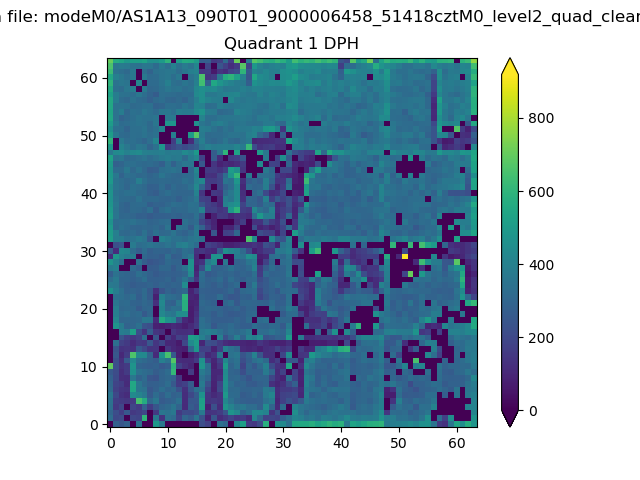 |
Quadrant B |
|---|---|---|---|
| Quadrant D | 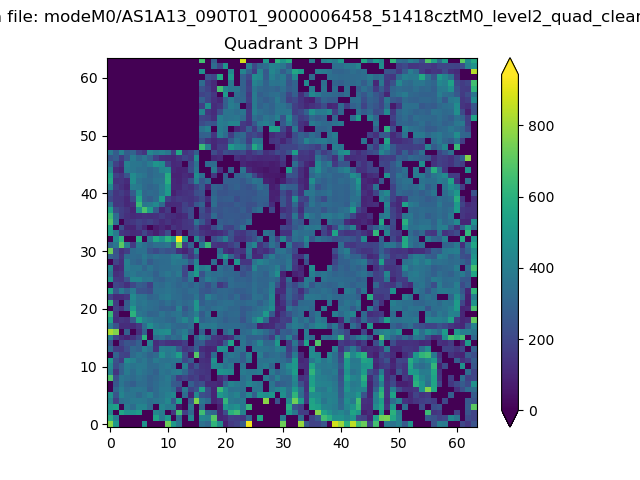 |
 |
Quadrant C |
| Plot type | Count rate plots | Images |
|---|---|---|
| Comparison with Poisson distribution Blue bars denote a histogram of data divided into 1 sec bins. Red curve is a Poisson curve with rate = median count rate of data. |
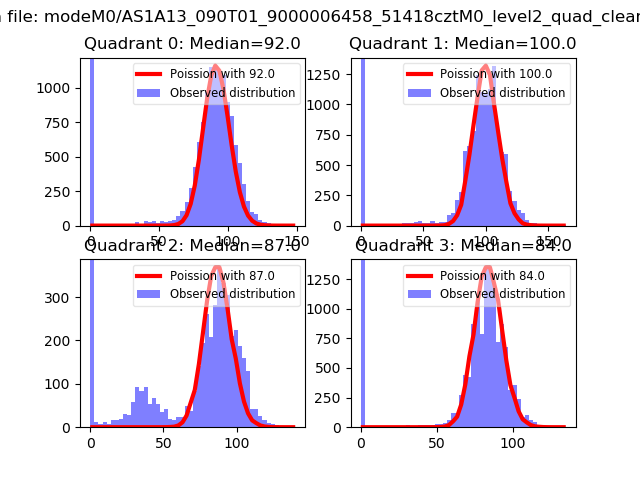 |
 |
| Quadrant-wise count rates Data is divided into 100 sec bins |
 |
|
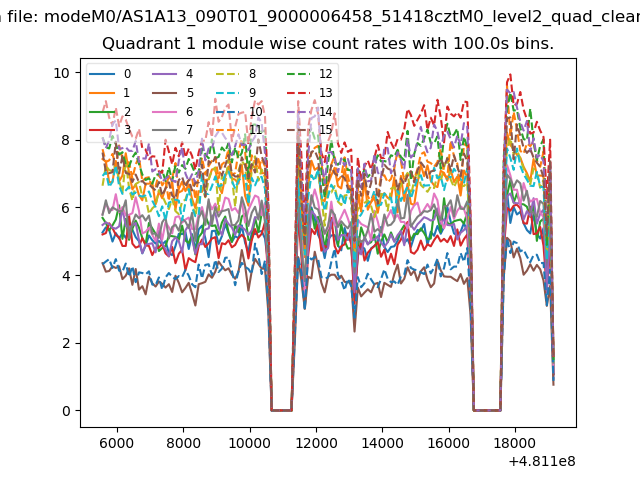
| Module-wise count rates for Quadrant A Data is divided into 100 sec bins |
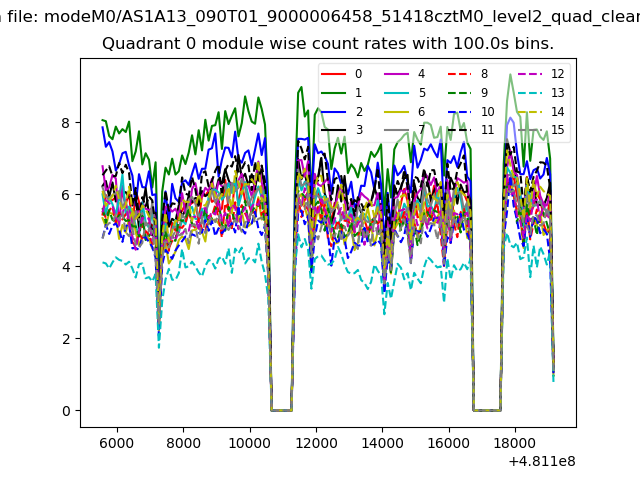 |
 |
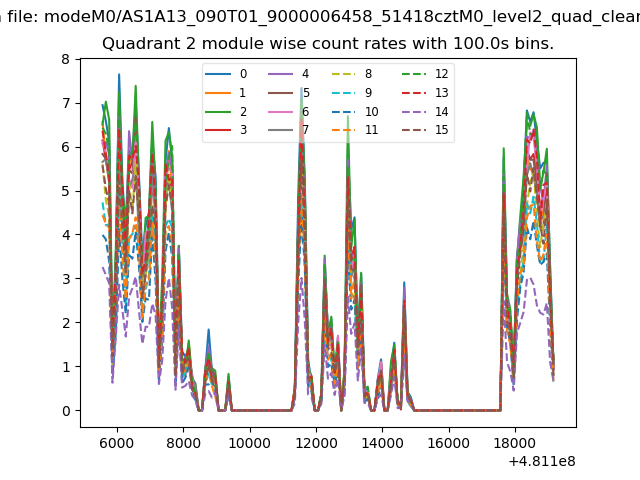
| Module-wise count rates for Quadrant B Data is divided into 100 sec bins |
 |
 |
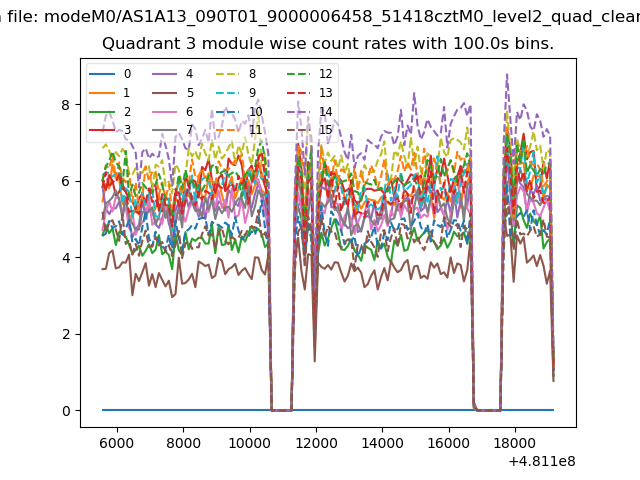
| Module-wise count rates for Quadrant C Data is divided into 100 sec bins |
 |
 |
| Module-wise count rates for Quadrant D Data is divided into 100 sec bins |
 |
 |
| Parameter | Plot |
|---|---|
| CZT HV Monitor |  |
| D_VDD | 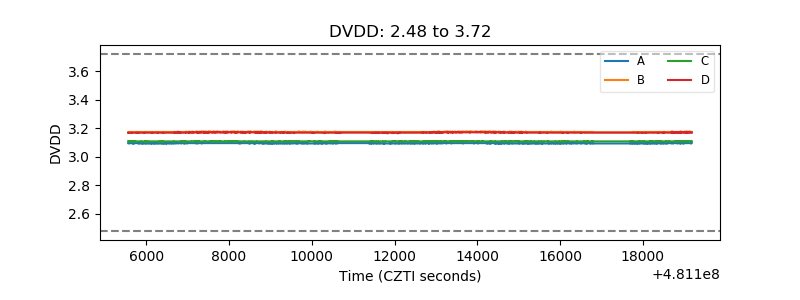 |
| Temperature 1 | 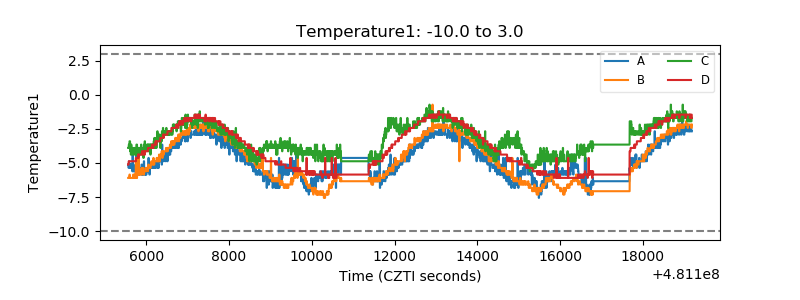 |
| Veto HV Monitor | 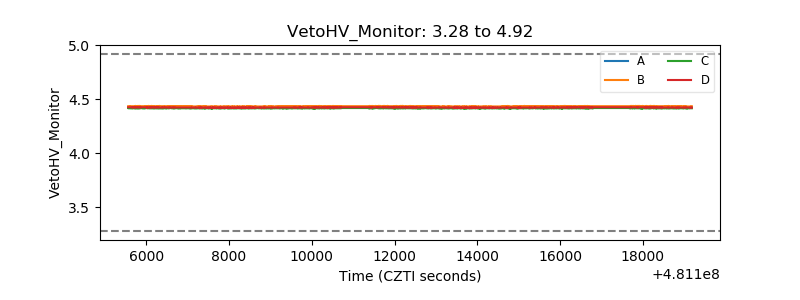 |
| Veto LLD | 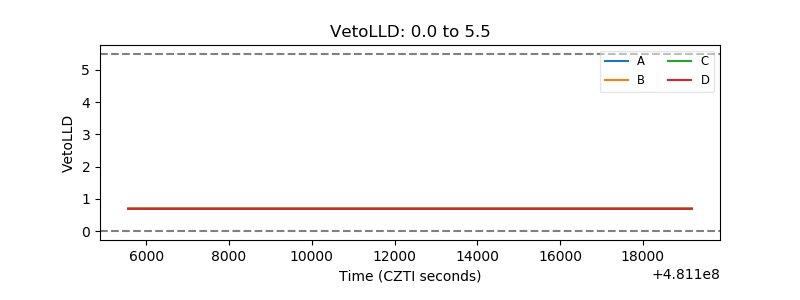 |
| Alpha Counter | 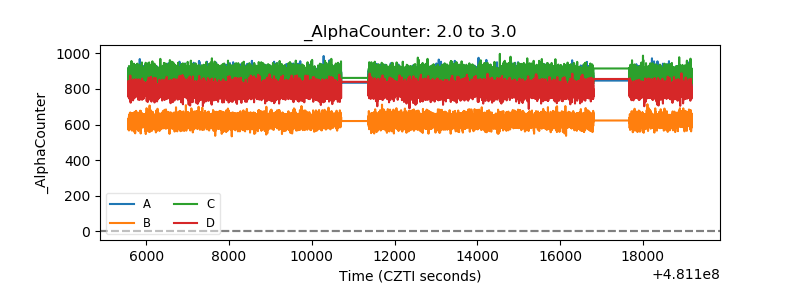 |
| _CPM_Rate | 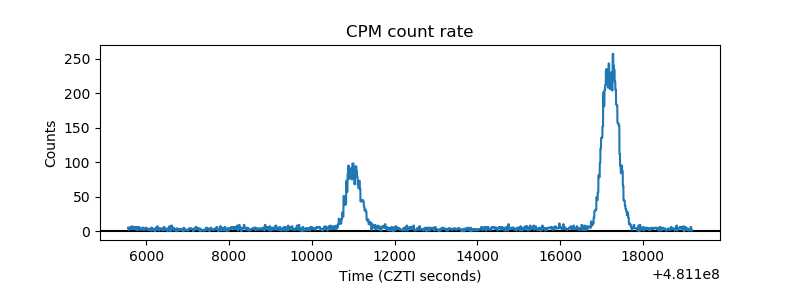 |
| CZT Counter | 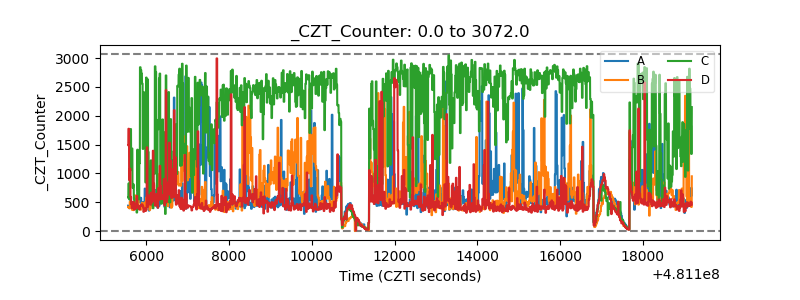 |
| +2.5 Volts monitor | 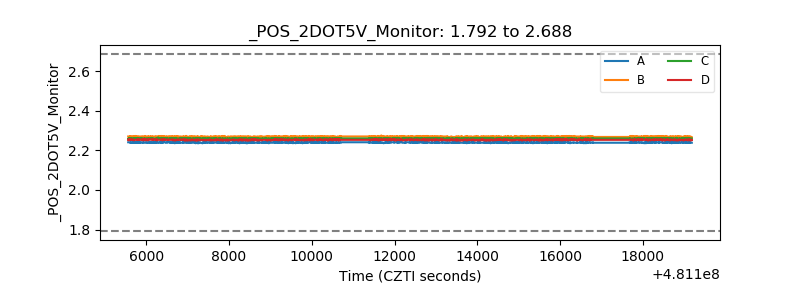 |
| +5 Volts monitor | 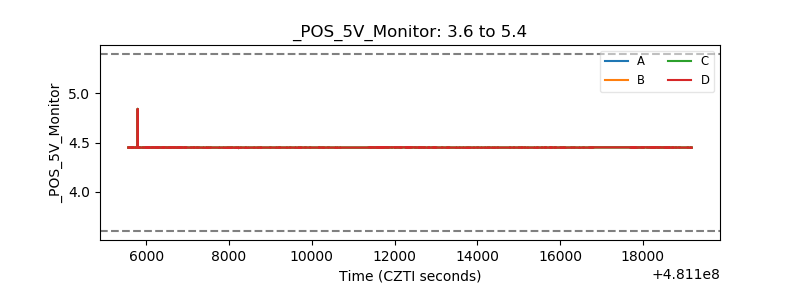 |
| _ROLL_ROT | 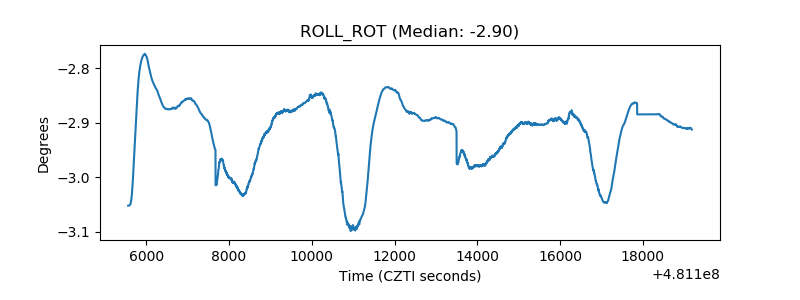 |
| _Roll_DEC | 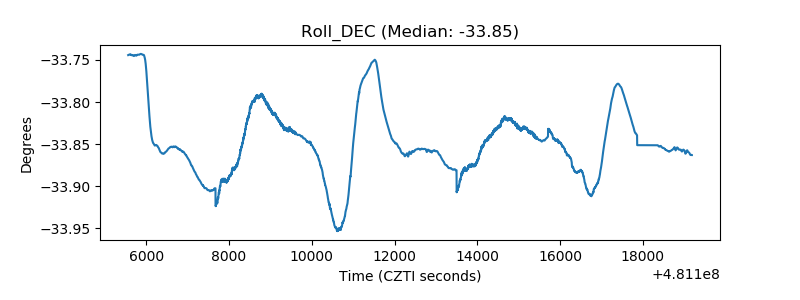 |
| _Roll_RA | 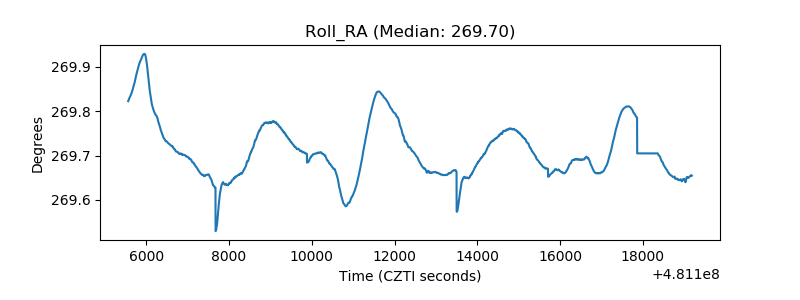 |
| Veto Counter | 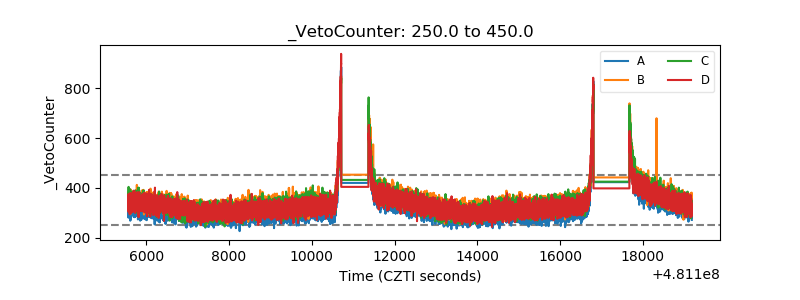 |