| Param | Original file | Final file |
|---|---|---|
| Filename | modeM0/AS1A13_090T01_9000006458_51420cztM0_level2.fits | modeM0/AS1A13_090T01_9000006458_51420cztM0_level2_quad_clean.evt |
| Size (bytes) | 726,687,360 | 82,488,960 |
| Size | 693.0 MB | 78.7 MB |
| Events in quadrant A | 5,524,085 | 575,371 |
| Events in quadrant B | 4,244,086 | 661,266 |
| Events in quadrant C | 13,120,399 | 239,154 |
| Events in quadrant D | 3,503,093 | 565,267 |
| Mode M0 | |||
|---|---|---|---|
| Quadrant | BADHDUFLAG | Total packets | Discarded packets |
| A | 0 | 20871 | 1 |
| B | 0 | 17065 | 1 |
| C | 0 | 43478 | 1 |
| D | 0 | 14960 | 2 |
| Mode M9 | |||
|---|---|---|---|
| Quadrant | BADHDUFLAG | Total packets | Discarded packets |
| A | 0 | 10 | 0 |
| B | 0 | 10 | 0 |
| C | 0 | 10 | 0 |
| D | 0 | 10 | 0 |
| Mode SS | |||
|---|---|---|---|
| Quadrant | BADHDUFLAG | Total packets | Discarded packets |
| A | 0 | 132 | 0 |
| B | 0 | 132 | 0 |
| C | 0 | 132 | 0 |
| D | 0 | 132 | 0 |
| Quadrant | Total seconds | Saturated seconds | Saturation percentage |
|---|---|---|---|
| A | 6547 | 616 | 9.408890% |
| B | 6547 | 288 | 4.398961% |
| C | 6548 | 4282 | 65.394013% |
| D | 6547 | 130 | 1.985642% |
Noise dominated data is calculated using 1-second bins in cleaned event files. If a bin has >2000 counts, and if more than 50% of those come from <1% of pixels, then it is considered to be noise-dominated and hence unusable.
| Quadrant | # 1 sec bins | Bins with >0 counts | Bins with >2000 counts | High rate bins dominated by noise | Noise dominated (total time) | Noise dominated (detector-on time) | Marked lightcurve |
|---|---|---|---|---|---|---|---|
| A | 7537 | 6547 | 369 | 369 | 4.90% | 5.64% | 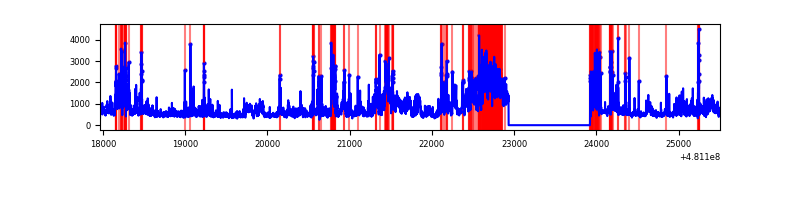 |
| B | 7537 | 6547 | 122 | 122 | 1.62% | 1.86% | 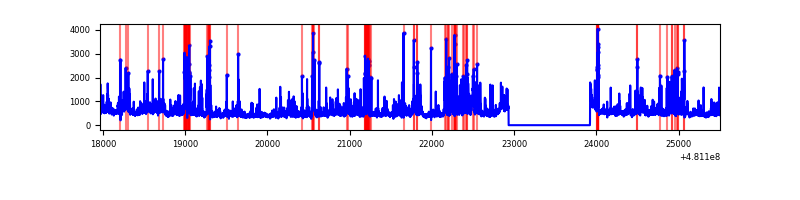 |
| C | 7538 | 6548 | 3630 | 3630 | 48.16% | 55.44% | 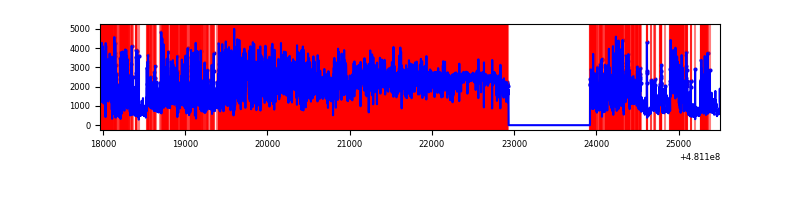 |
| D | 7537 | 6548 | 51 | 51 | 0.68% | 0.78% | 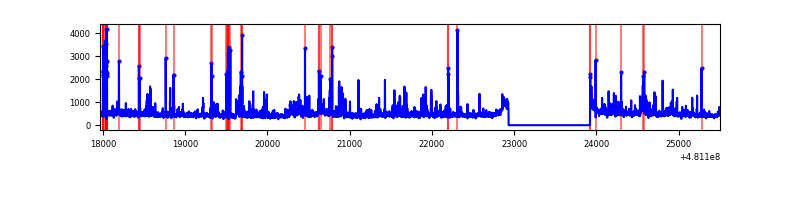 |
Top three noisy pixels from each quadrant. If the there are fewer than three noisy pixels in the level2.evt file, extra rows are filled as -1
| Pixel properties | Quadrant properties | ||||||
|---|---|---|---|---|---|---|---|
| Quadrant | DetID | PixID | Counts | Sigma | Mean | Median | Sigma |
| A | 12 | 3 | 638622 | 3769.22 | 693 | 678 | 169.3 |
| A | 12 | 250 | 614954 | 3629.38 | 693 | 678 | 169.3 |
| A | 15 | 174 | 431097 | 2543.08 | 693 | 678 | 169.3 |
| B | 5 | 185 | 398208 | 2641.38 | 707 | 681 | 150.5 |
| B | 10 | 14 | 277677 | 1840.51 | 707 | 681 | 150.5 |
| B | 10 | 254 | 159957 | 1058.31 | 707 | 681 | 150.5 |
| C | 15 | 179 | 3172475 | 27171.65 | 422 | 418 | 116.7 |
| C | 4 | 12 | 2877722 | 24646.82 | 422 | 418 | 116.7 |
| C | 15 | 230 | 2668195 | 22852.02 | 422 | 418 | 116.7 |
| D | 3 | 12 | 135504 | 699.49 | 699 | 673 | 192.8 |
| D | 2 | 153 | 110759 | 571.12 | 699 | 673 | 192.8 |
| D | 7 | 96 | 91647 | 471.96 | 699 | 673 | 192.8 |
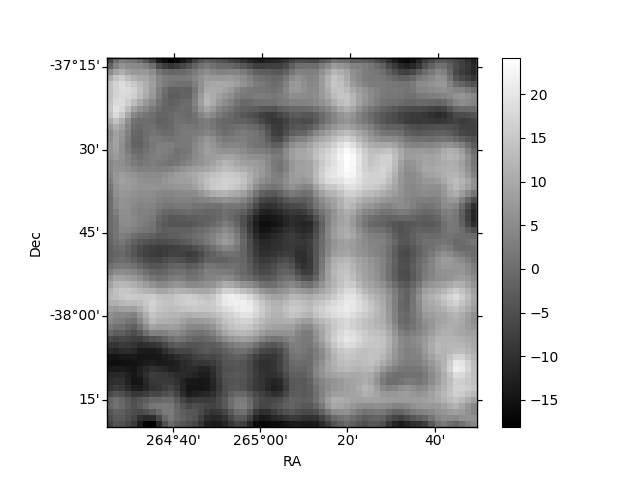
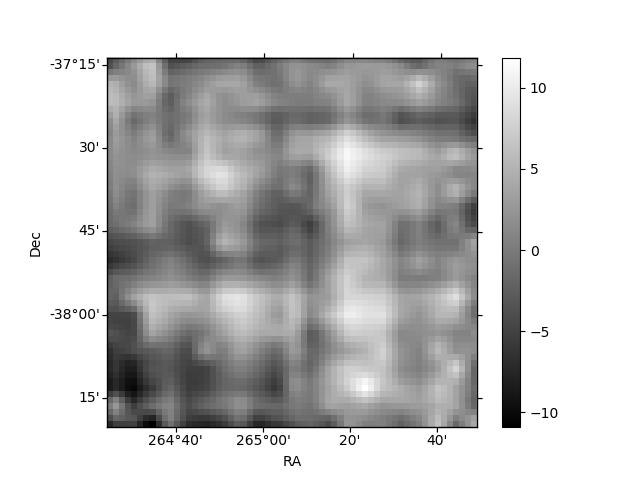
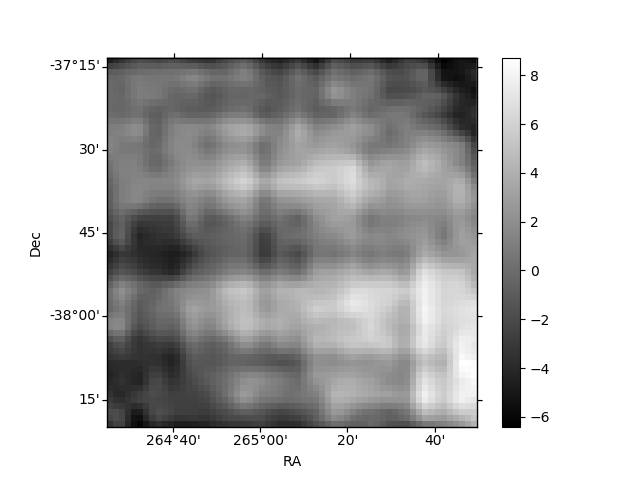
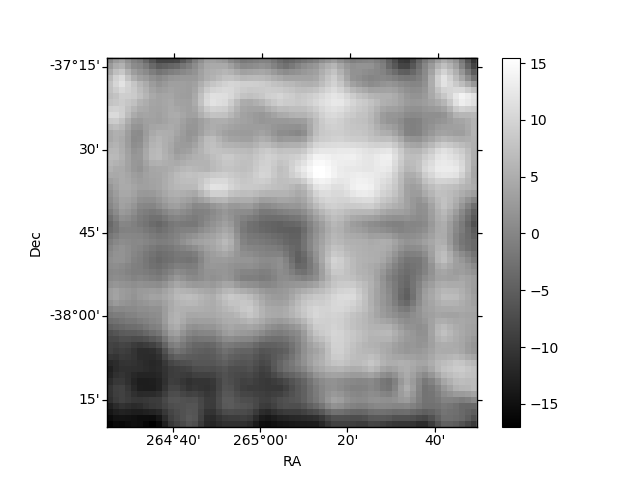
Histogram calculated using DETX and DETY for each event in the final _common_clean file
| Quadrant A | 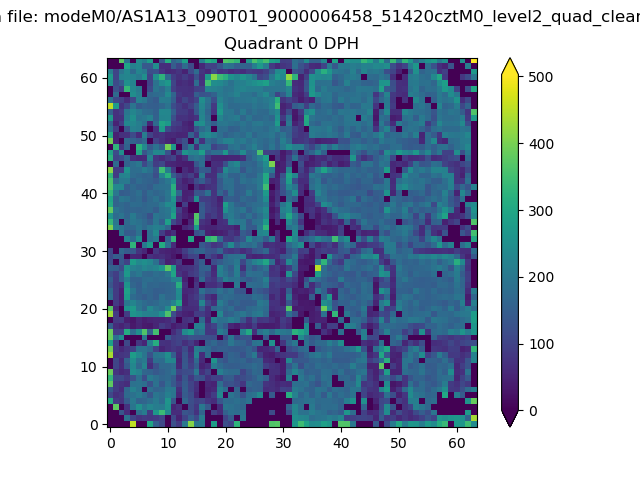 |
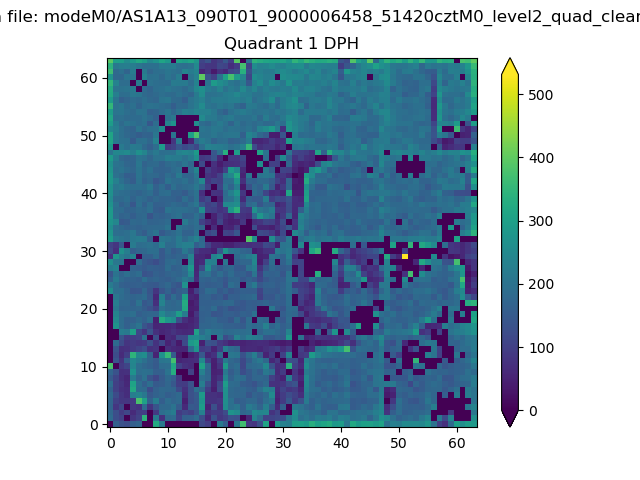 |
Quadrant B |
|---|---|---|---|
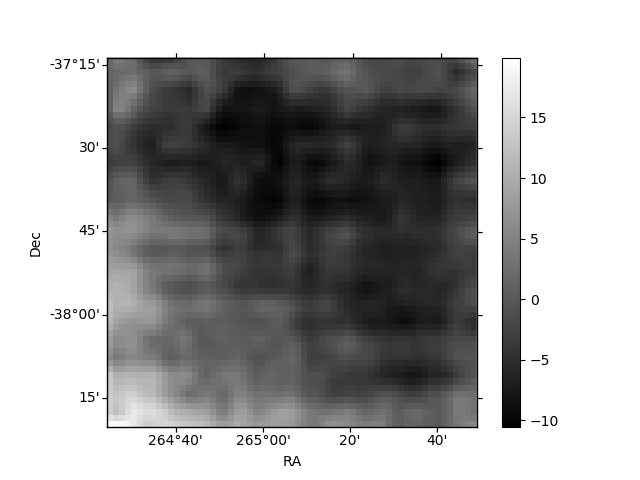
| Quadrant D | 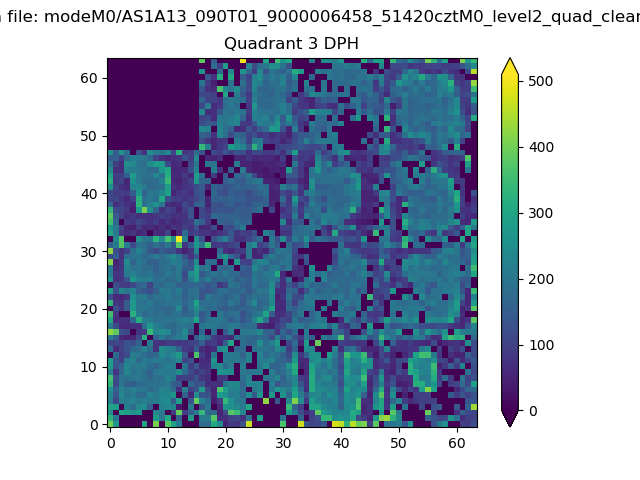 |
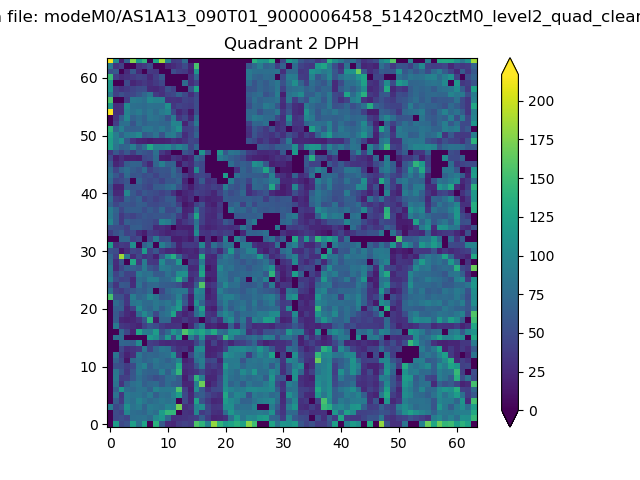 |
Quadrant C |
| Plot type | Count rate plots | Images |
|---|---|---|
| Comparison with Poisson distribution Blue bars denote a histogram of data divided into 1 sec bins. Red curve is a Poisson curve with rate = median count rate of data. |
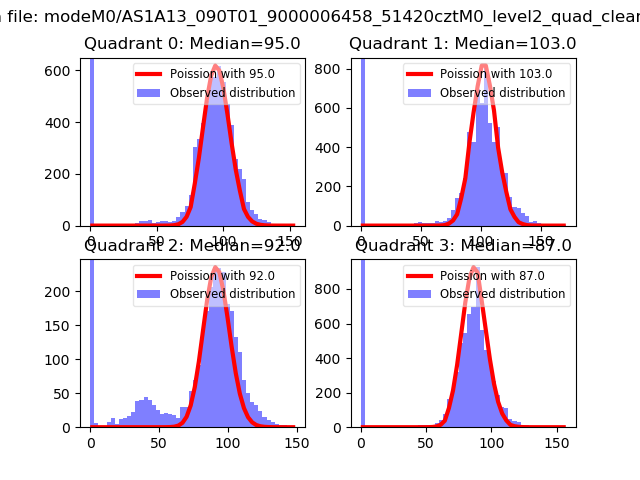 |
 |
| Quadrant-wise count rates Data is divided into 100 sec bins |
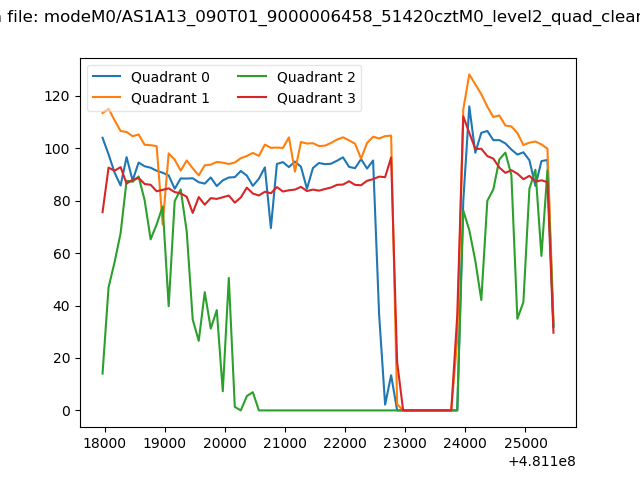 |
|
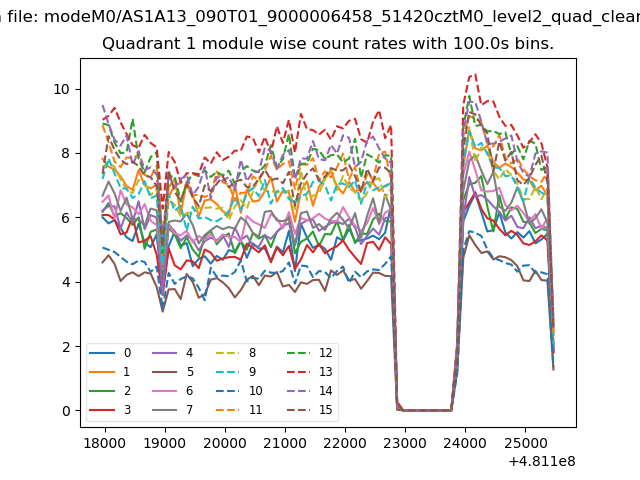
| Module-wise count rates for Quadrant A Data is divided into 100 sec bins |
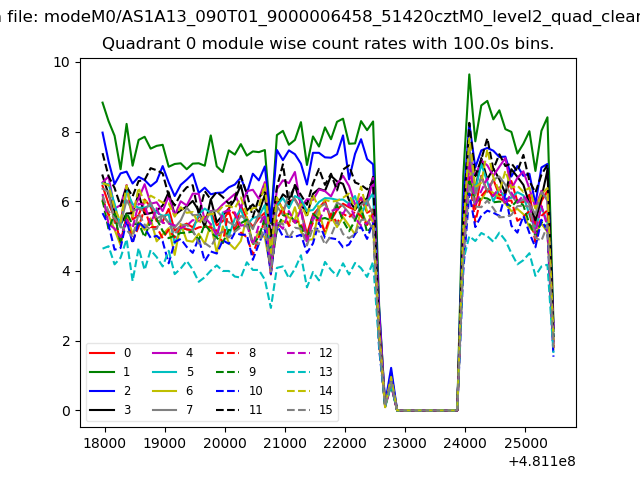 |
 |
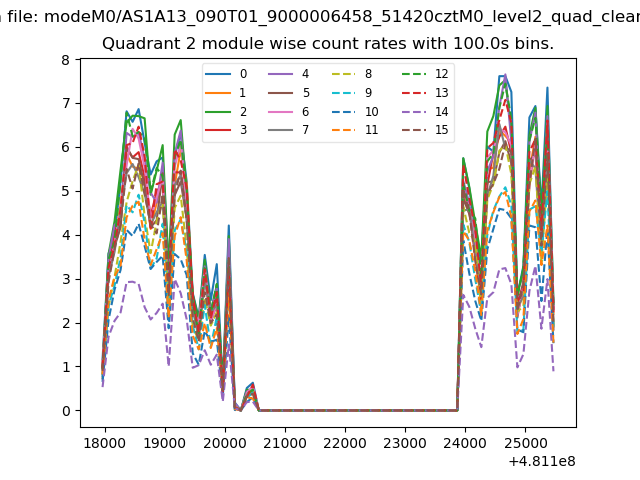
| Module-wise count rates for Quadrant B Data is divided into 100 sec bins |
 |
 |
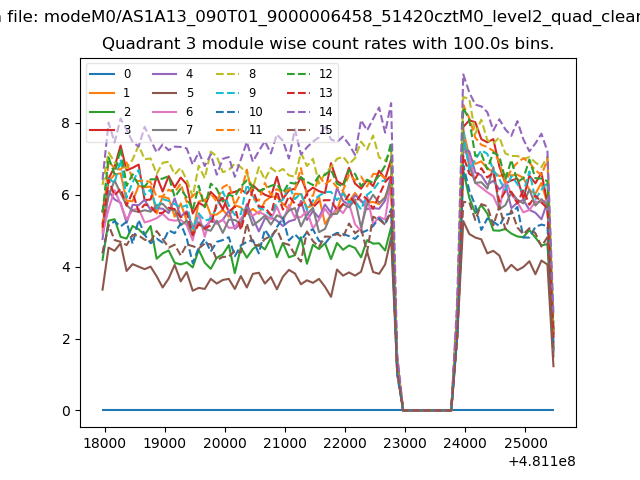
| Module-wise count rates for Quadrant C Data is divided into 100 sec bins |
 |
 |
| Module-wise count rates for Quadrant D Data is divided into 100 sec bins |
 |
 |
| Parameter | Plot |
|---|---|
| CZT HV Monitor | 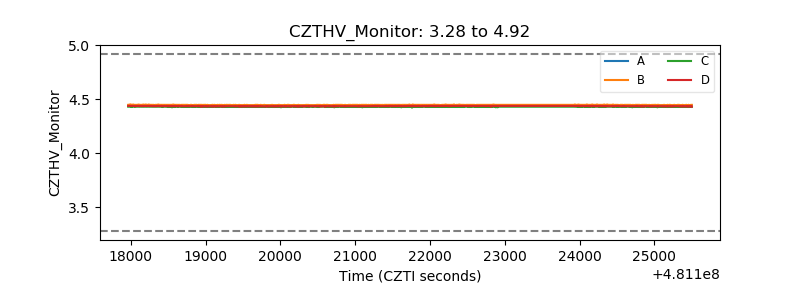 |
| D_VDD | 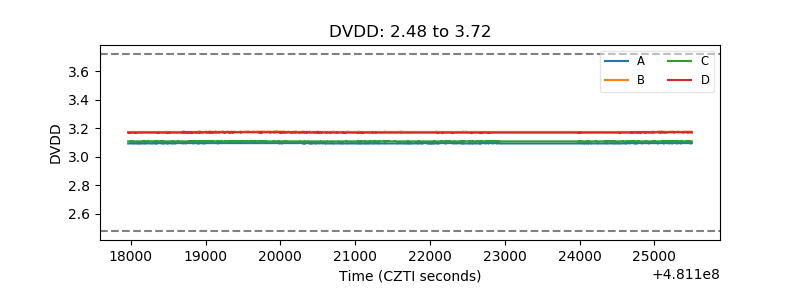 |
| Temperature 1 | 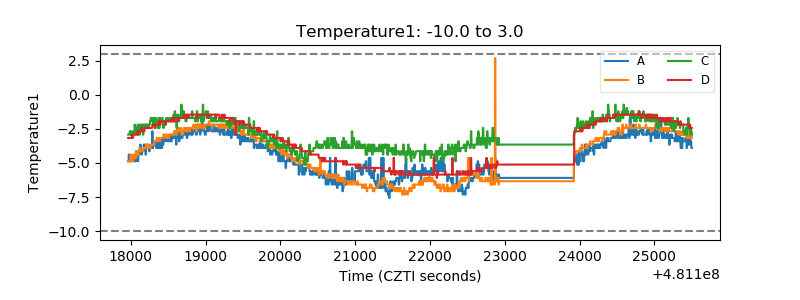 |
| Veto HV Monitor |  |
| Veto LLD | 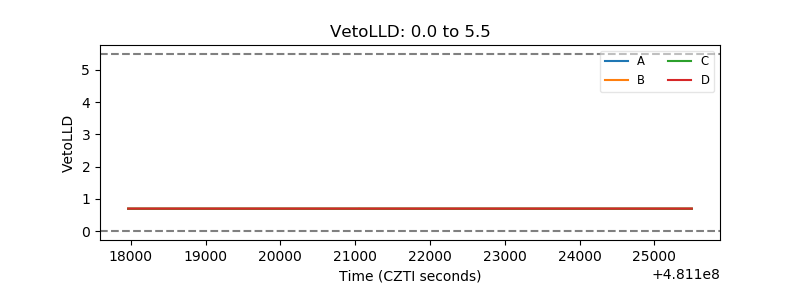 |
| Alpha Counter | 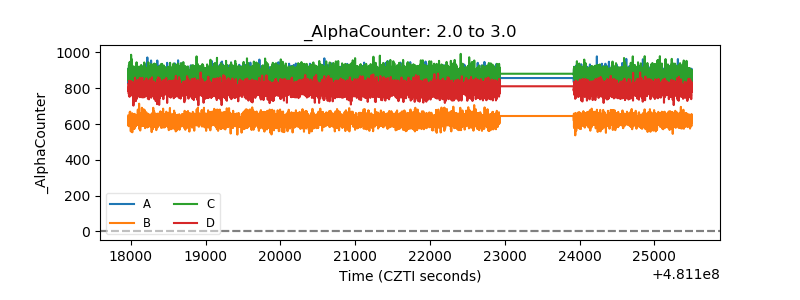 |
| _CPM_Rate | 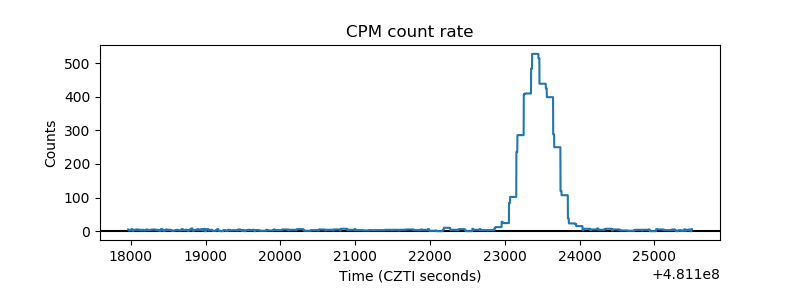 |
| CZT Counter | 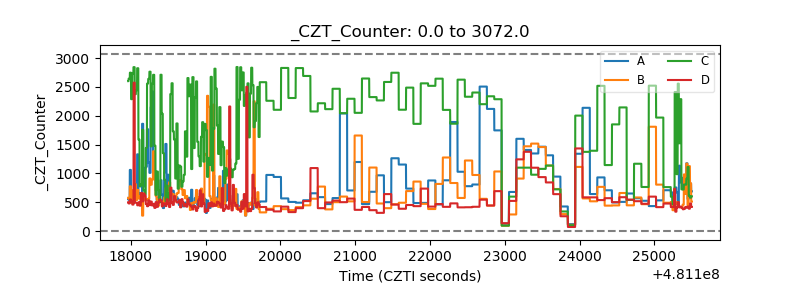 |
| +2.5 Volts monitor |  |
| +5 Volts monitor | 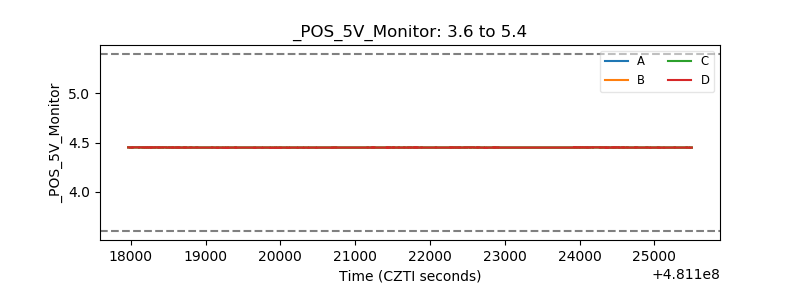 |
| _ROLL_ROT | 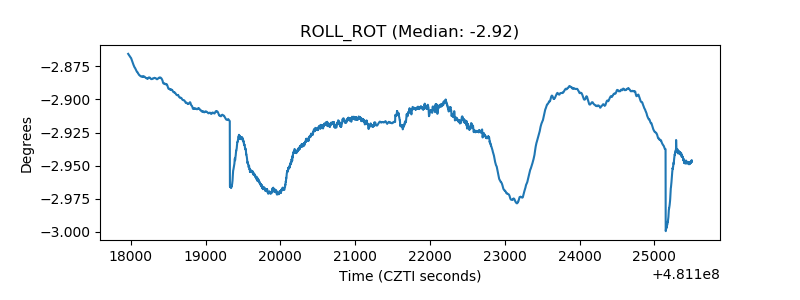 |
| _Roll_DEC | 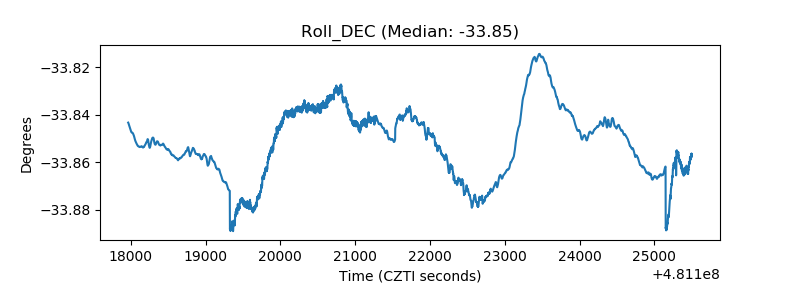 |
| _Roll_RA | 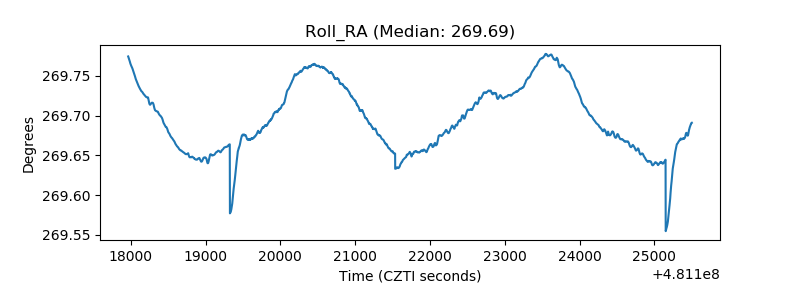 |
| Veto Counter | 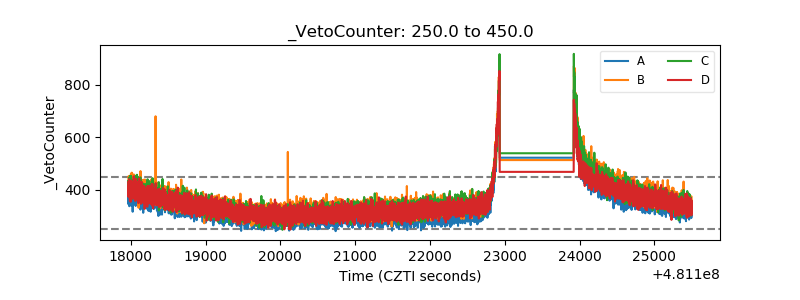 |