| Param | Original file | Final file |
|---|---|---|
| Filename | modeM0/AS1A13_090T01_9000006458_51422cztM0_level2.fits | modeM0/AS1A13_090T01_9000006458_51422cztM0_level2_quad_clean.evt |
| Size (bytes) | 562,553,280 | 94,204,800 |
| Size | 536.5 MB | 89.8 MB |
| Events in quadrant A | 4,443,158 | 643,375 |
| Events in quadrant B | 4,004,325 | 687,726 |
| Events in quadrant C | 8,218,139 | 494,752 |
| Events in quadrant D | 3,663,639 | 581,019 |
| Mode M0 | |||
|---|---|---|---|
| Quadrant | BADHDUFLAG | Total packets | Discarded packets |
| A | 0 | 17473 | 2 |
| B | 0 | 16156 | 3 |
| C | 0 | 28751 | 2 |
| D | 0 | 15412 | 2 |
| Mode M9 | |||
|---|---|---|---|
| Quadrant | BADHDUFLAG | Total packets | Discarded packets |
| A | 0 | 11 | 0 |
| B | 0 | 12 | 0 |
| C | 0 | 12 | 0 |
| D | 0 | 12 | 0 |
| Mode SS | |||
|---|---|---|---|
| Quadrant | BADHDUFLAG | Total packets | Discarded packets |
| A | 0 | 132 | 0 |
| B | 0 | 132 | 0 |
| C | 0 | 132 | 0 |
| D | 0 | 132 | 0 |
| Quadrant | Total seconds | Saturated seconds | Saturation percentage |
|---|---|---|---|
| A | 6377 | 187 | 2.932413% |
| B | 6376 | 278 | 4.360100% |
| C | 6376 | 1659 | 26.019448% |
| D | 6376 | 159 | 2.493726% |
Noise dominated data is calculated using 1-second bins in cleaned event files. If a bin has >2000 counts, and if more than 50% of those come from <1% of pixels, then it is considered to be noise-dominated and hence unusable.
| Quadrant | # 1 sec bins | Bins with >0 counts | Bins with >2000 counts | High rate bins dominated by noise | Noise dominated (total time) | Noise dominated (detector-on time) | Marked lightcurve |
|---|---|---|---|---|---|---|---|
| A | 7567 | 6378 | 92 | 92 | 1.22% | 1.44% | 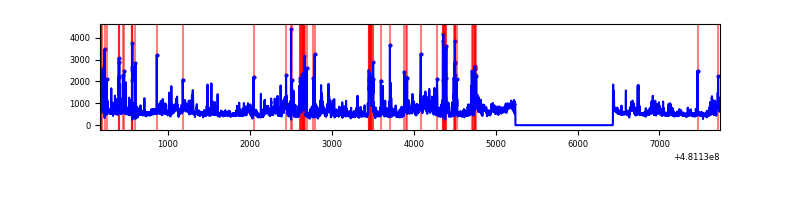 |
| B | 7566 | 6376 | 96 | 96 | 1.27% | 1.51% | 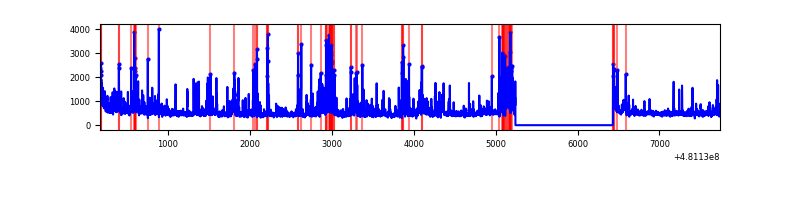 |
| C | 7566 | 6377 | 1328 | 1328 | 17.55% | 20.82% | 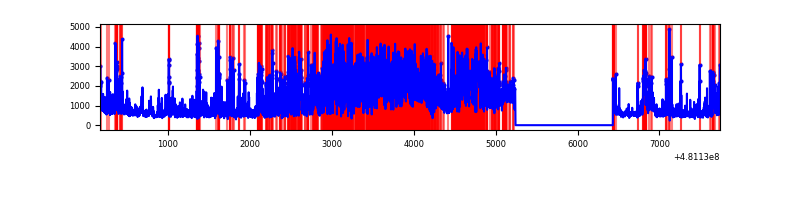 |
| D | 7566 | 6377 | 87 | 87 | 1.15% | 1.36% | 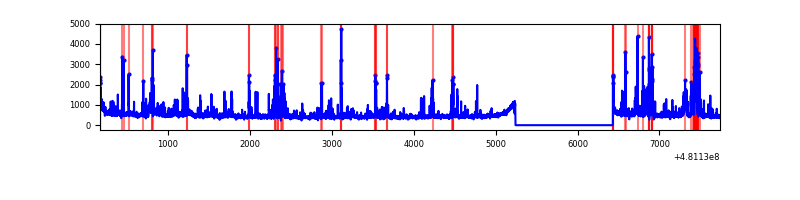 |
Top three noisy pixels from each quadrant. If the there are fewer than three noisy pixels in the level2.evt file, extra rows are filled as -1
| Pixel properties | Quadrant properties | ||||||
|---|---|---|---|---|---|---|---|
| Quadrant | DetID | PixID | Counts | Sigma | Mean | Median | Sigma |
| A | 12 | 3 | 537309 | 3036.29 | 728 | 711 | 176.7 |
| A | 12 | 250 | 305905 | 1726.91 | 728 | 711 | 176.7 |
| A | 5 | 240 | 164845 | 928.74 | 728 | 711 | 176.7 |
| B | 5 | 185 | 602787 | 3933.26 | 719 | 695 | 153.1 |
| B | 8 | 234 | 104599 | 678.77 | 719 | 695 | 153.1 |
| B | 0 | 213 | 86588 | 561.11 | 719 | 695 | 153.1 |
| C | 15 | 230 | 2092439 | 11988.73 | 637 | 632 | 174.5 |
| C | 15 | 179 | 1084362 | 6211.16 | 637 | 632 | 174.5 |
| C | 10 | 171 | 831086 | 4759.56 | 637 | 632 | 174.5 |
| D | 7 | 80 | 179923 | 926.89 | 701 | 676 | 193.4 |
| D | 11 | 176 | 143204 | 737.01 | 701 | 676 | 193.4 |
| D | 3 | 12 | 92384 | 474.22 | 701 | 676 | 193.4 |
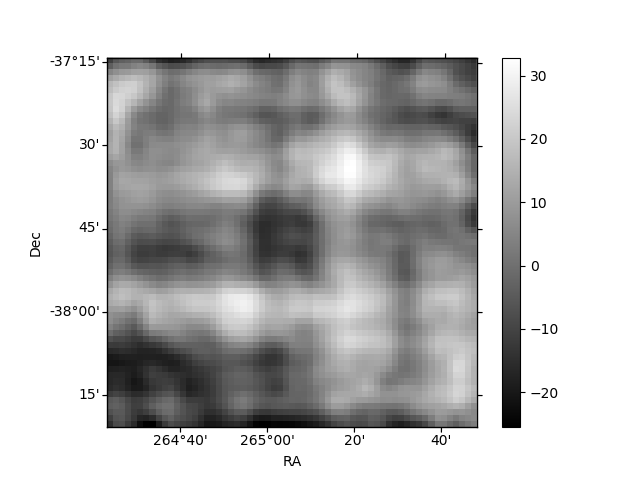
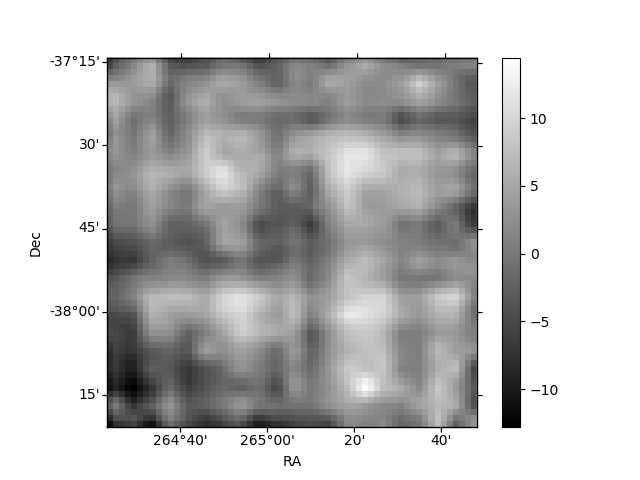
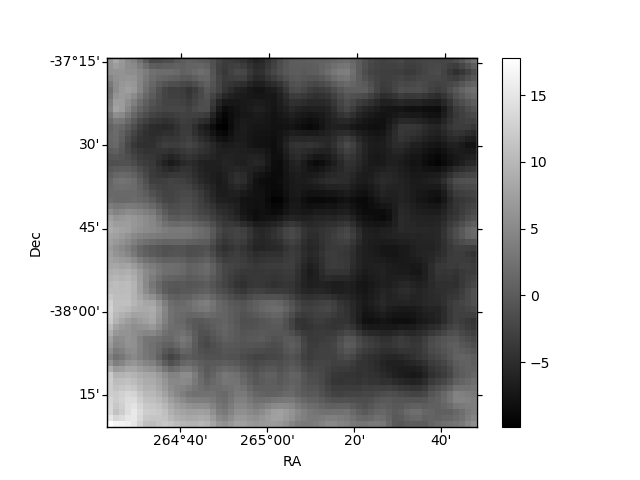
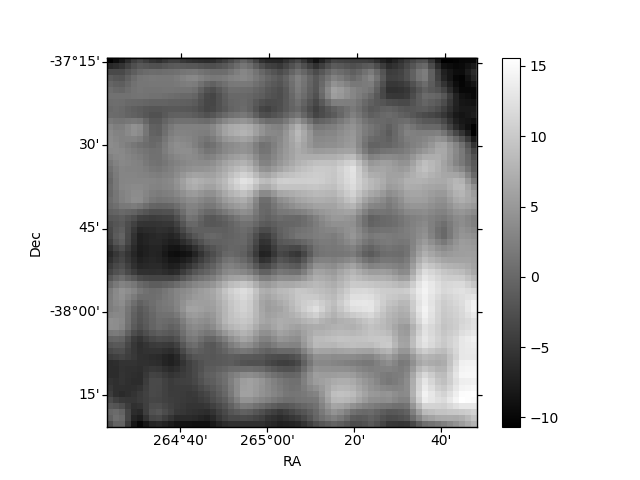
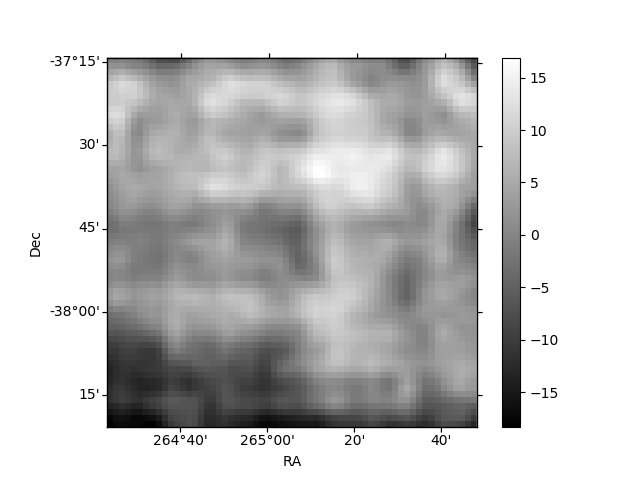
Histogram calculated using DETX and DETY for each event in the final _common_clean file
| Quadrant A | 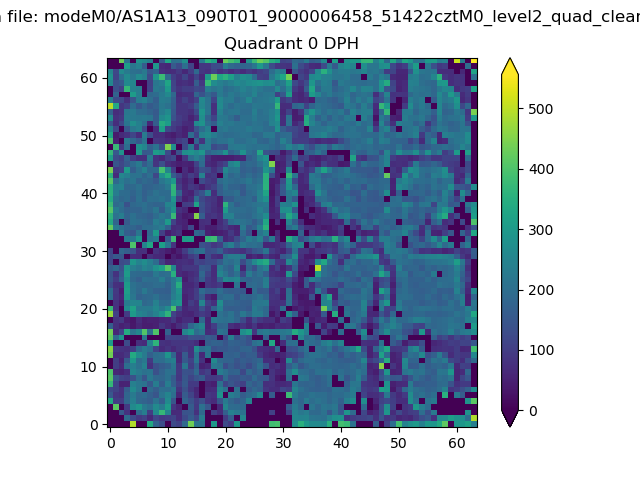 |
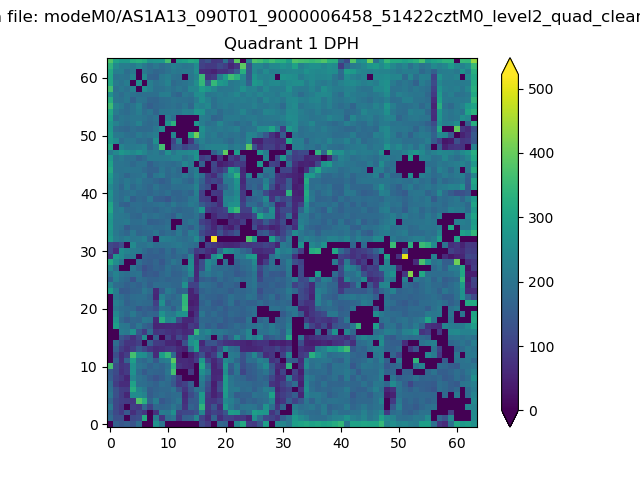 |
Quadrant B |
|---|---|---|---|
| Quadrant D | 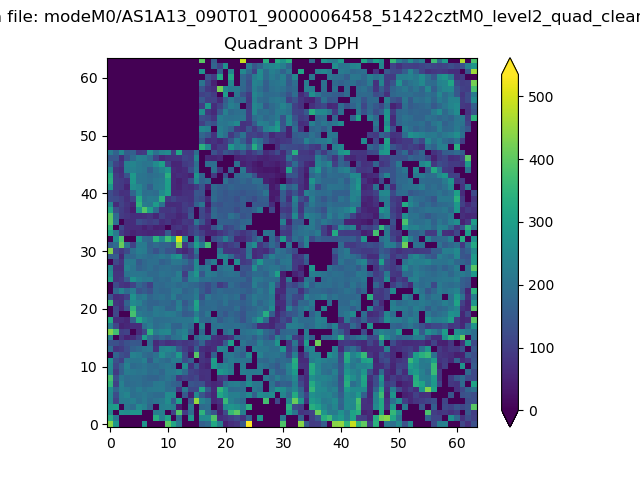 |
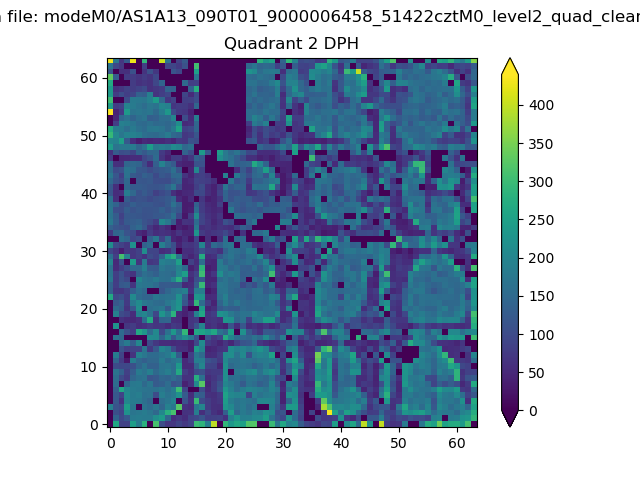 |
Quadrant C |
| Plot type | Count rate plots | Images |
|---|---|---|
| Comparison with Poisson distribution Blue bars denote a histogram of data divided into 1 sec bins. Red curve is a Poisson curve with rate = median count rate of data. |
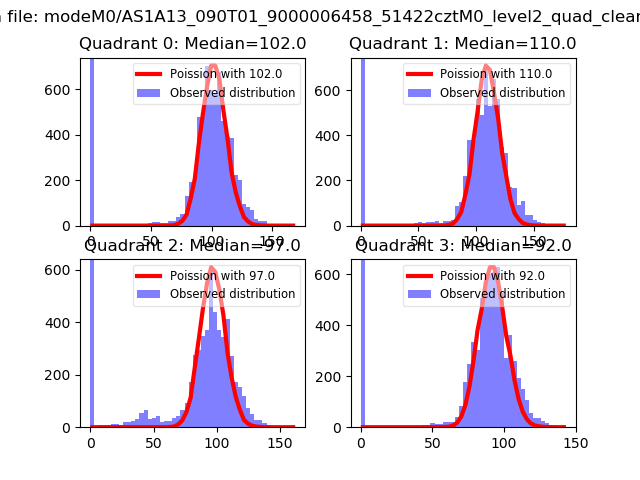 |
 |
| Quadrant-wise count rates Data is divided into 100 sec bins |
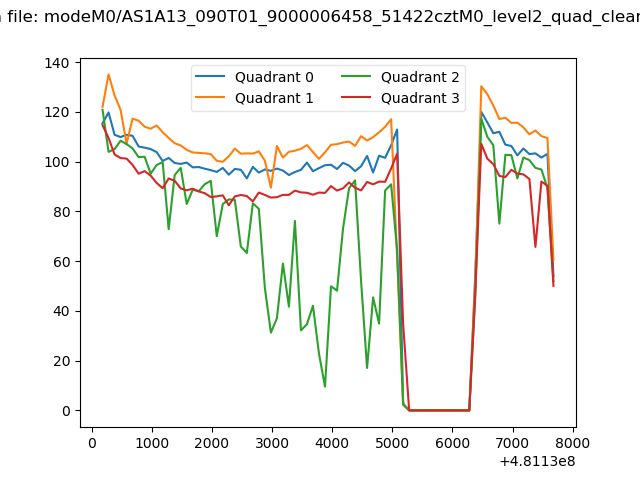 |
|
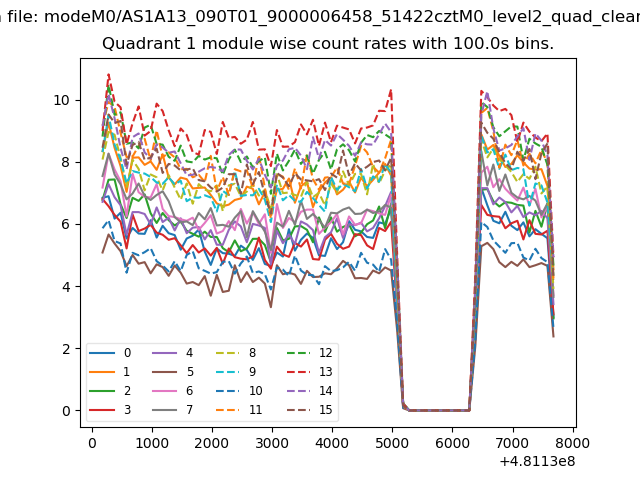
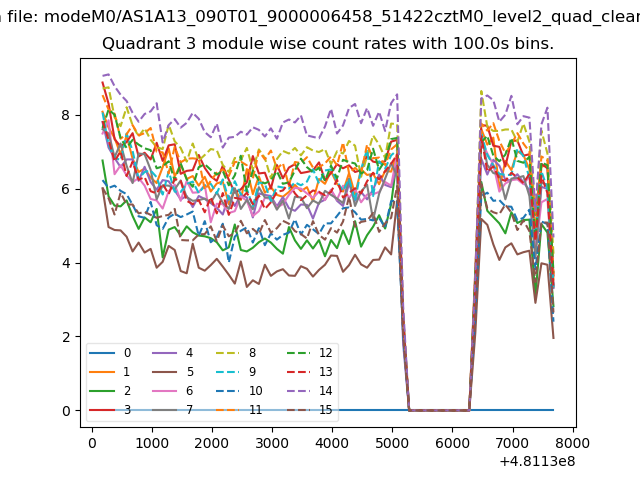
| Module-wise count rates for Quadrant A Data is divided into 100 sec bins |
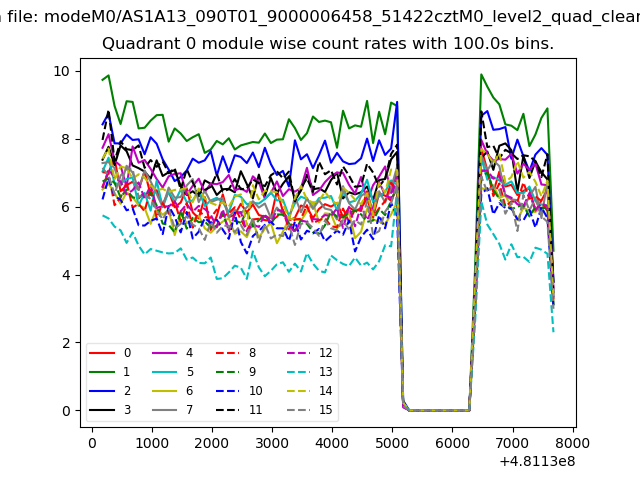 |
 |
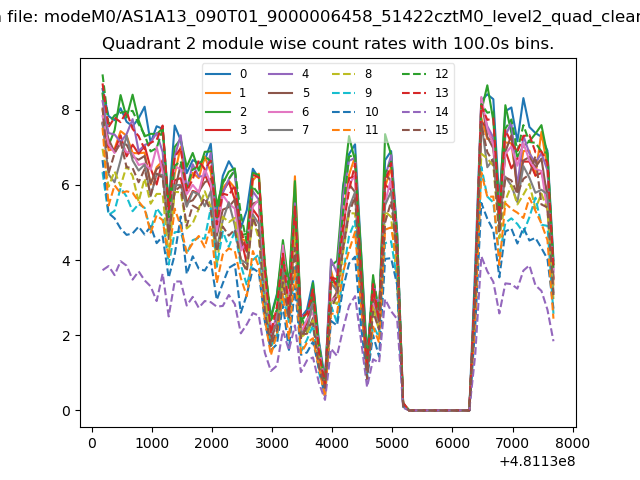
| Module-wise count rates for Quadrant B Data is divided into 100 sec bins |
 |
 |
| Module-wise count rates for Quadrant C Data is divided into 100 sec bins |
 |
 |
| Module-wise count rates for Quadrant D Data is divided into 100 sec bins |
 |
 |
| Parameter | Plot |
|---|---|
| CZT HV Monitor | 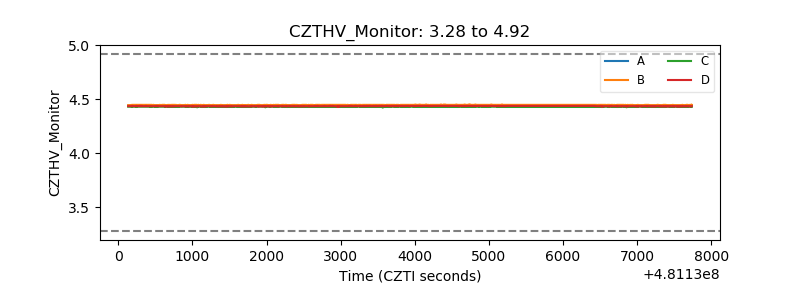 |
| D_VDD | 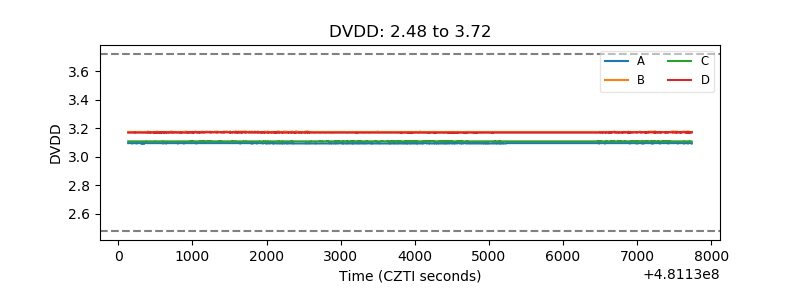 |
| Temperature 1 | 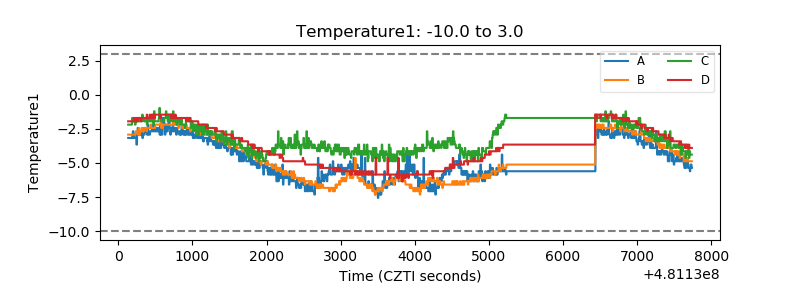 |
| Veto HV Monitor |  |
| Veto LLD | 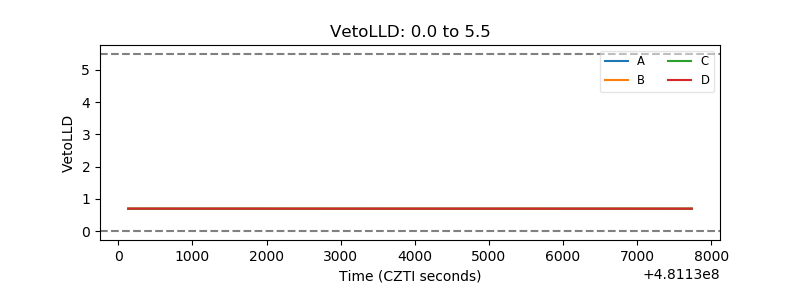 |
| Alpha Counter | 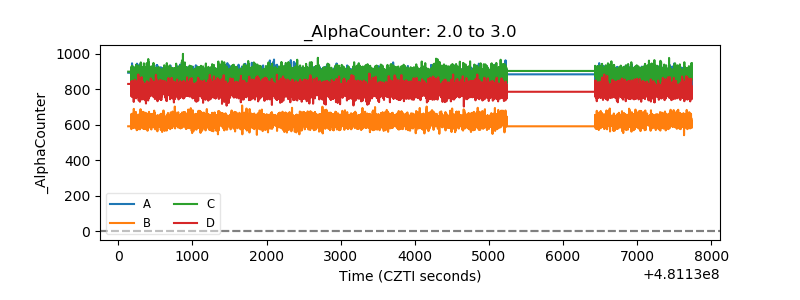 |
| _CPM_Rate | 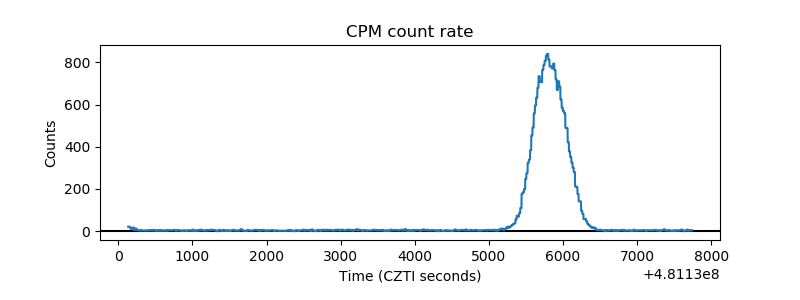 |
| CZT Counter | 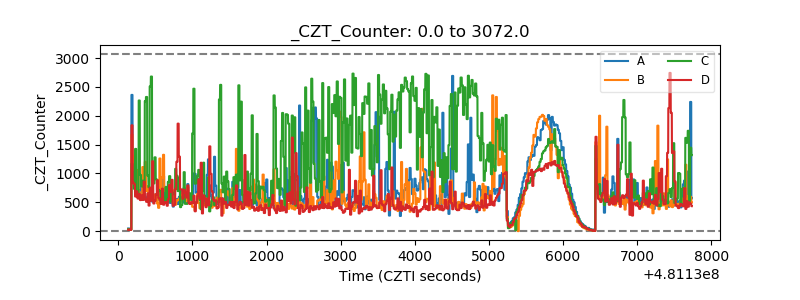 |
| +2.5 Volts monitor |  |
| +5 Volts monitor | 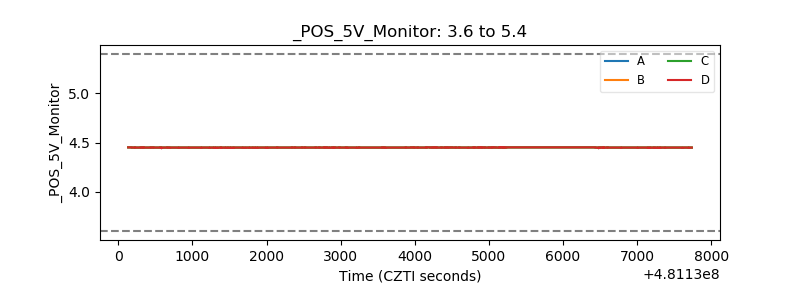 |
| _ROLL_ROT | 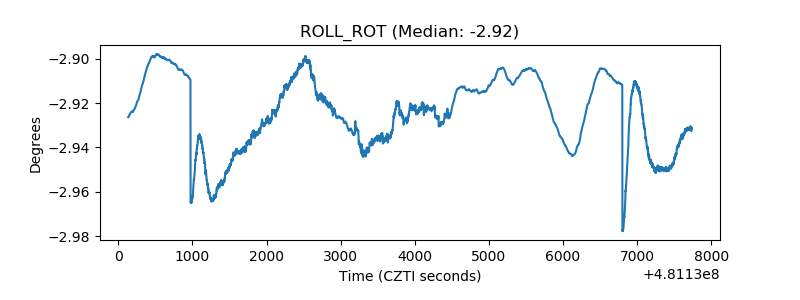 |
| _Roll_DEC | 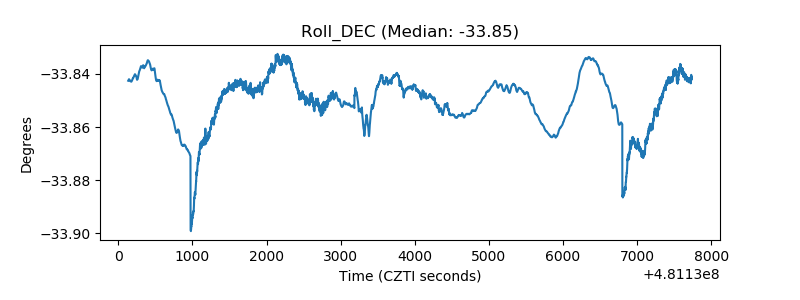 |
| _Roll_RA | 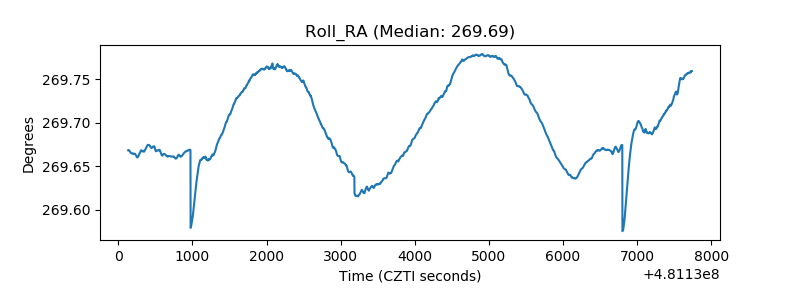 |
| Veto Counter | 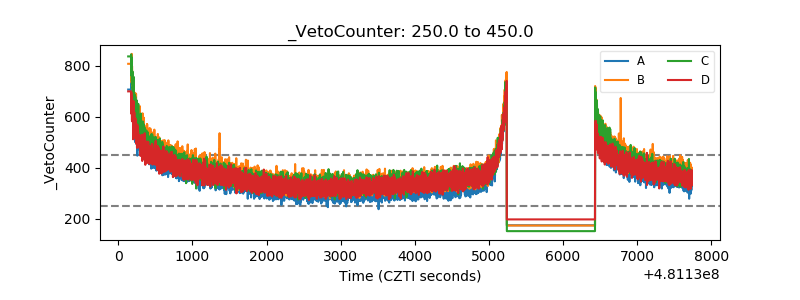 |