| Param | Original file | Final file |
|---|---|---|
| Filename | modeM0/AS1A13_090T01_9000006458_51423cztM0_level2.fits | modeM0/AS1A13_090T01_9000006458_51423cztM0_level2_quad_clean.evt |
| Size (bytes) | 589,668,480 | 93,441,600 |
| Size | 562.4 MB | 89.1 MB |
| Events in quadrant A | 5,162,300 | 633,520 |
| Events in quadrant B | 4,014,290 | 687,033 |
| Events in quadrant C | 8,395,270 | 482,997 |
| Events in quadrant D | 3,757,000 | 576,534 |
| Mode M0 | |||
|---|---|---|---|
| Quadrant | BADHDUFLAG | Total packets | Discarded packets |
| A | 0 | 19653 | 2 |
| B | 0 | 16214 | 3 |
| C | 0 | 29303 | 2 |
| D | 0 | 15742 | 2 |
| Mode M9 | |||
|---|---|---|---|
| Quadrant | BADHDUFLAG | Total packets | Discarded packets |
| A | 0 | 11 | 0 |
| B | 0 | 12 | 0 |
| C | 0 | 12 | 0 |
| D | 0 | 12 | 0 |
| Mode SS | |||
|---|---|---|---|
| Quadrant | BADHDUFLAG | Total packets | Discarded packets |
| A | 0 | 132 | 0 |
| B | 0 | 132 | 0 |
| C | 0 | 132 | 0 |
| D | 0 | 132 | 0 |
| Quadrant | Total seconds | Saturated seconds | Saturation percentage |
|---|---|---|---|
| A | 6435 | 290 | 4.506605% |
| B | 6434 | 304 | 4.724899% |
| C | 6434 | 1694 | 26.328878% |
| D | 6434 | 185 | 2.875350% |
Noise dominated data is calculated using 1-second bins in cleaned event files. If a bin has >2000 counts, and if more than 50% of those come from <1% of pixels, then it is considered to be noise-dominated and hence unusable.
| Quadrant | # 1 sec bins | Bins with >0 counts | Bins with >2000 counts | High rate bins dominated by noise | Noise dominated (total time) | Noise dominated (detector-on time) | Marked lightcurve |
|---|---|---|---|---|---|---|---|
| A | 7570 | 6436 | 125 | 125 | 1.65% | 1.94% | 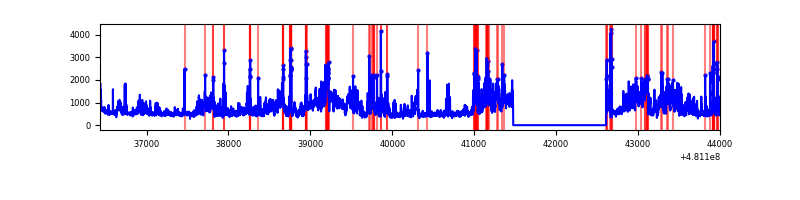 |
| B | 7569 | 6435 | 147 | 147 | 1.94% | 2.28% | 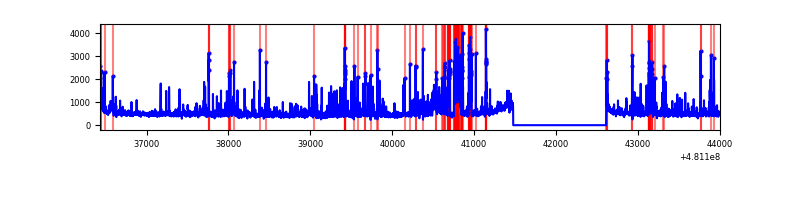 |
| C | 7569 | 6435 | 1486 | 1486 | 19.63% | 23.09% | 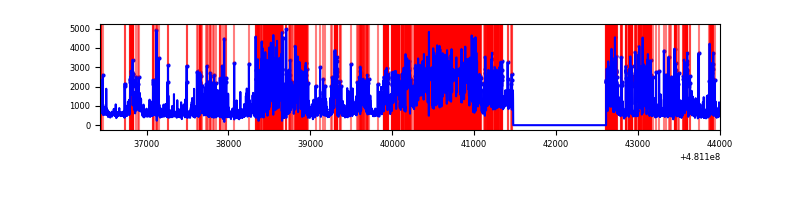 |
| D | 7569 | 6435 | 106 | 106 | 1.40% | 1.65% | 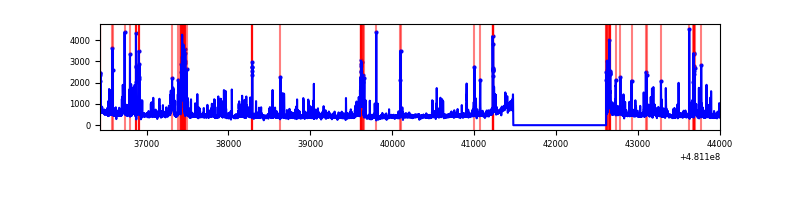 |
Top three noisy pixels from each quadrant. If the there are fewer than three noisy pixels in the level2.evt file, extra rows are filled as -1
| Pixel properties | Quadrant properties | ||||||
|---|---|---|---|---|---|---|---|
| Quadrant | DetID | PixID | Counts | Sigma | Mean | Median | Sigma |
| A | 12 | 3 | 1230594 | 6953.47 | 723 | 705 | 176.9 |
| A | 15 | 174 | 254978 | 1437.59 | 723 | 705 | 176.9 |
| A | 4 | 175 | 184886 | 1041.31 | 723 | 705 | 176.9 |
| B | 8 | 128 | 307930 | 2027.19 | 719 | 695 | 151.6 |
| B | 5 | 185 | 183850 | 1208.49 | 719 | 695 | 151.6 |
| B | 0 | 172 | 137894 | 905.26 | 719 | 695 | 151.6 |
| C | 4 | 12 | 3644256 | 20921.19 | 633 | 629 | 174.2 |
| C | 10 | 171 | 624331 | 3581.21 | 633 | 629 | 174.2 |
| C | 15 | 179 | 568091 | 3258.29 | 633 | 629 | 174.2 |
| D | 7 | 80 | 226004 | 1163.64 | 697 | 671 | 193.6 |
| D | 11 | 176 | 170317 | 876.07 | 697 | 671 | 193.6 |
| D | 6 | 42 | 112914 | 579.63 | 697 | 671 | 193.6 |
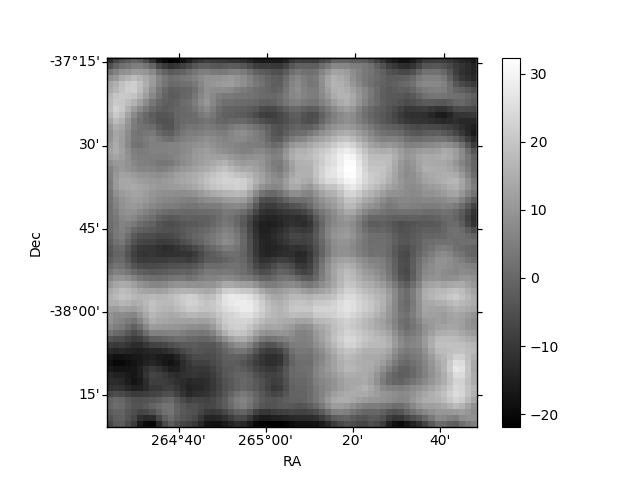
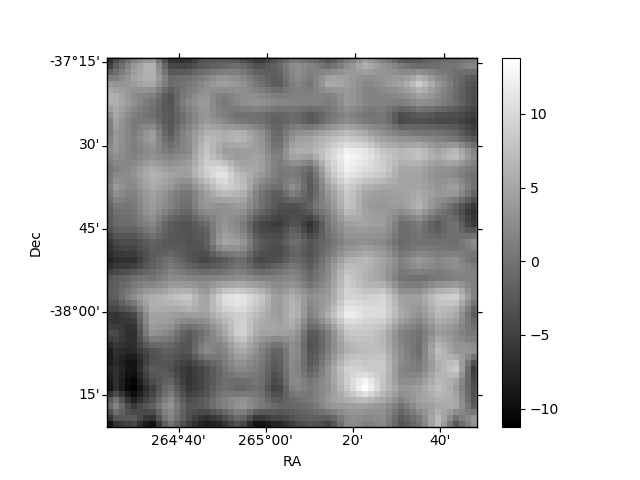
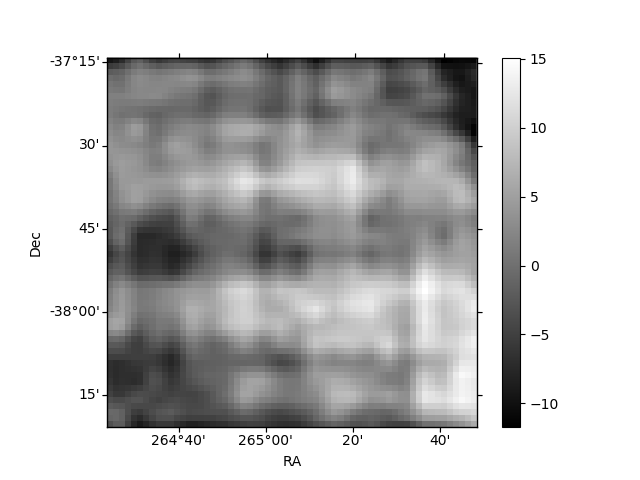
Histogram calculated using DETX and DETY for each event in the final _common_clean file
| Quadrant A | 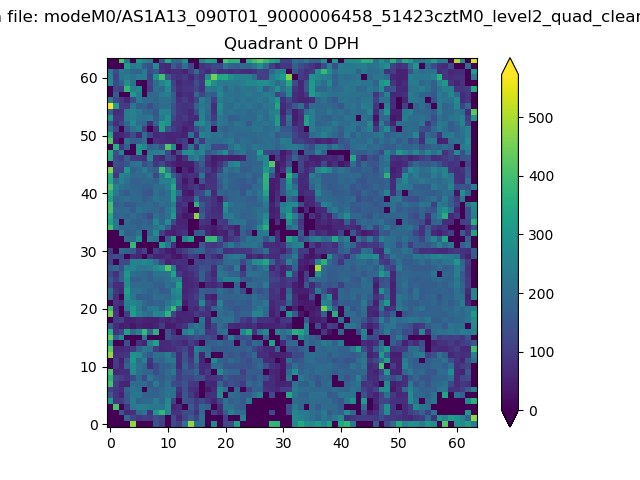 |
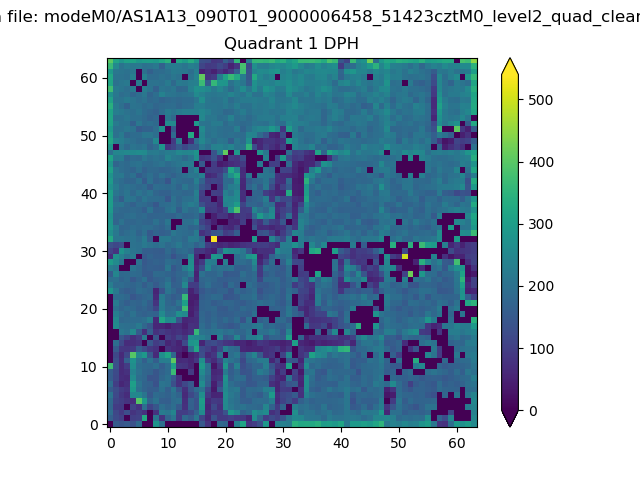 |
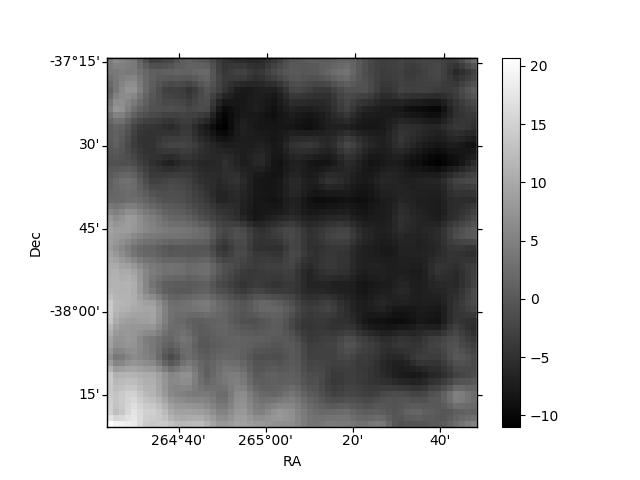
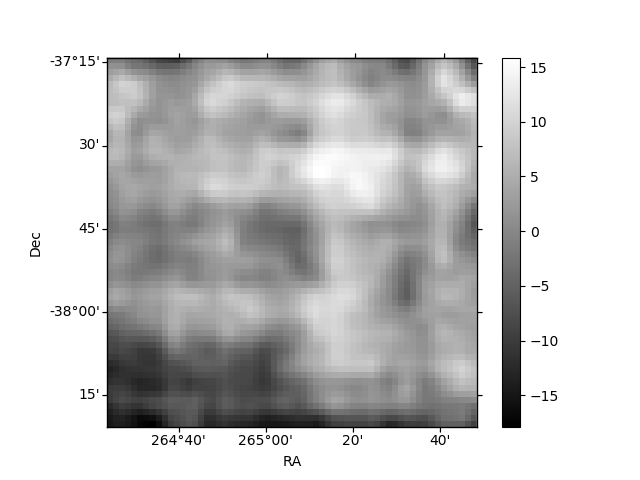
Quadrant B |
|---|---|---|---|
| Quadrant D | 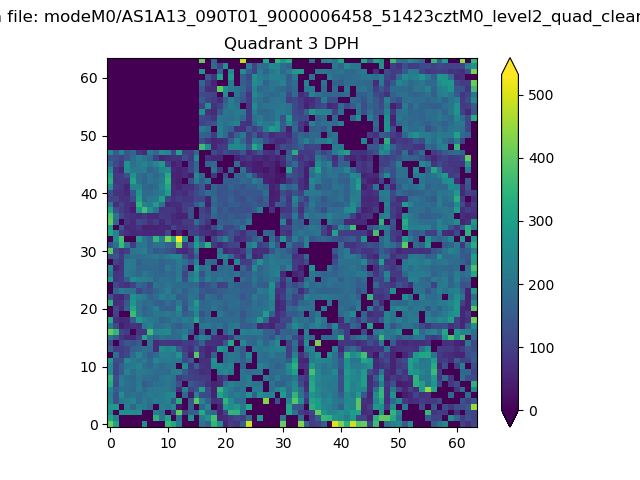 |
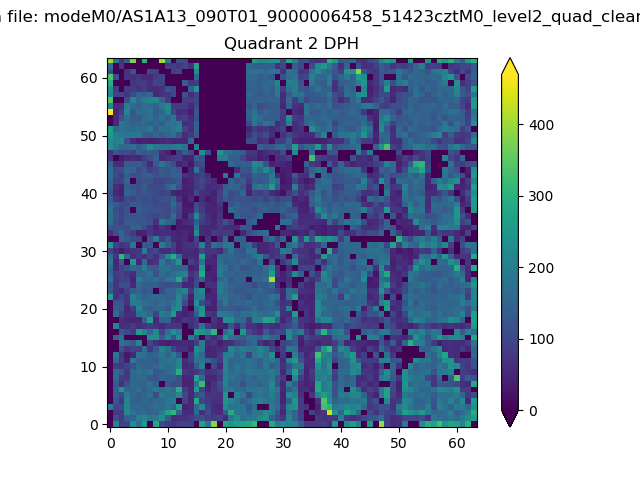 |
Quadrant C |
| Plot type | Count rate plots | Images |
|---|---|---|
| Comparison with Poisson distribution Blue bars denote a histogram of data divided into 1 sec bins. Red curve is a Poisson curve with rate = median count rate of data. |
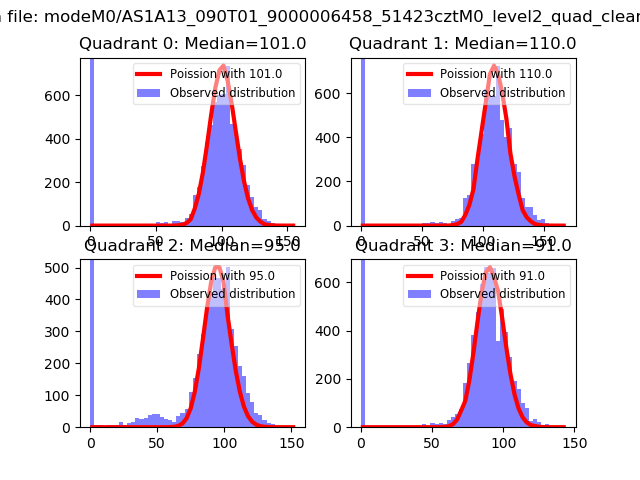 |
 |
| Quadrant-wise count rates Data is divided into 100 sec bins |
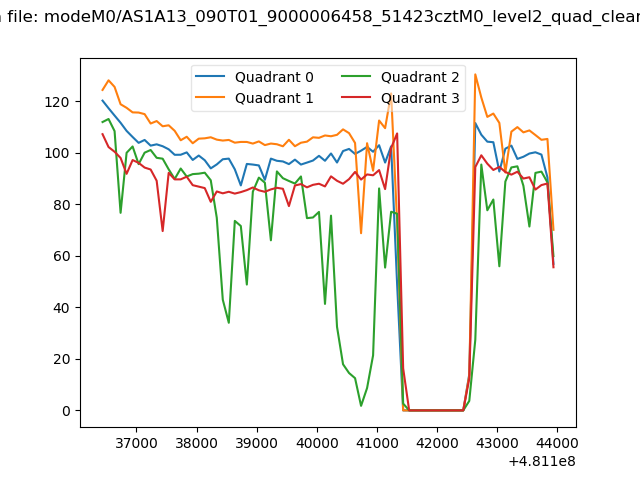 |
|
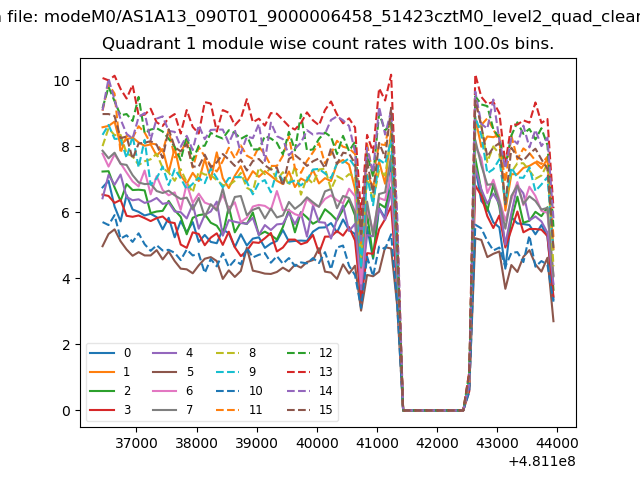
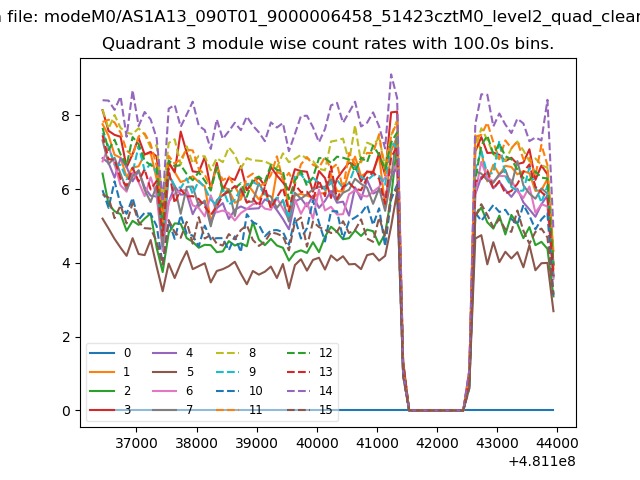
| Module-wise count rates for Quadrant A Data is divided into 100 sec bins |
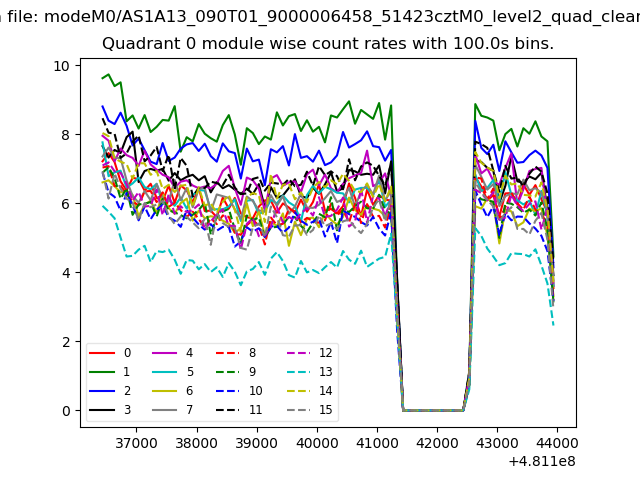 |
 |
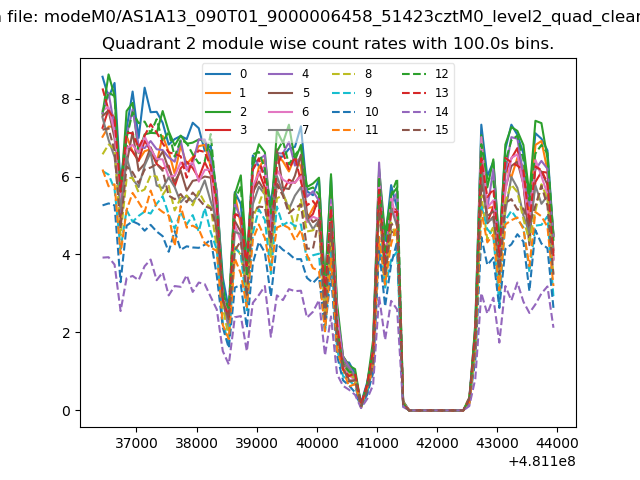
| Module-wise count rates for Quadrant B Data is divided into 100 sec bins |
 |
 |
| Module-wise count rates for Quadrant C Data is divided into 100 sec bins |
 |
 |
| Module-wise count rates for Quadrant D Data is divided into 100 sec bins |
 |
 |
| Parameter | Plot |
|---|---|
| CZT HV Monitor | 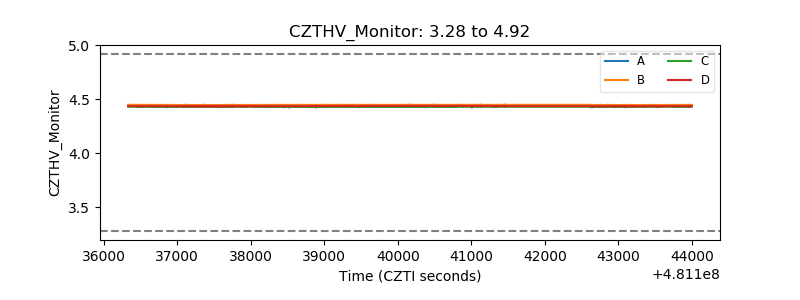 |
| D_VDD | 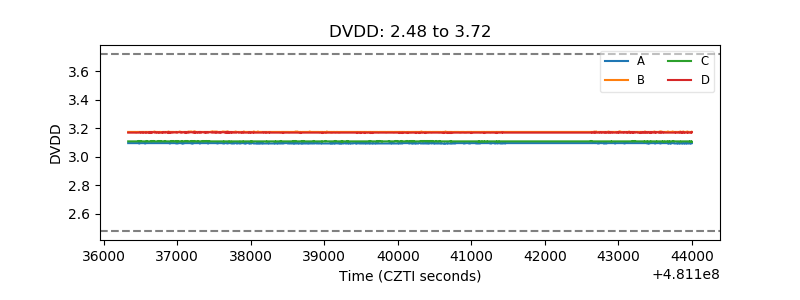 |
| Temperature 1 | 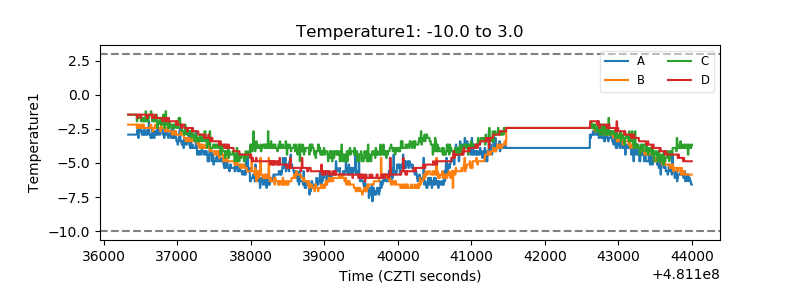 |
| Veto HV Monitor | 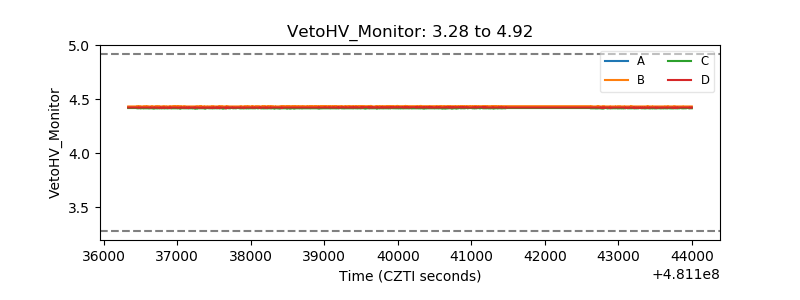 |
| Veto LLD | 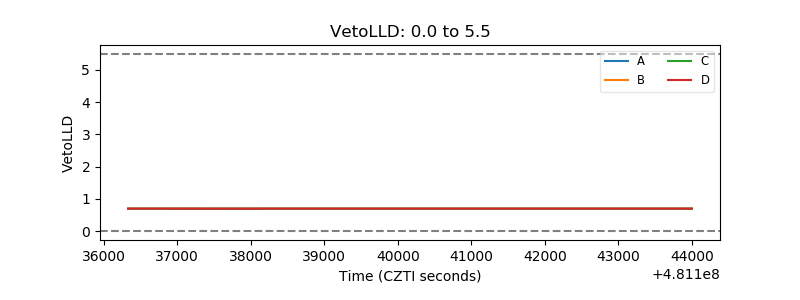 |
| Alpha Counter | 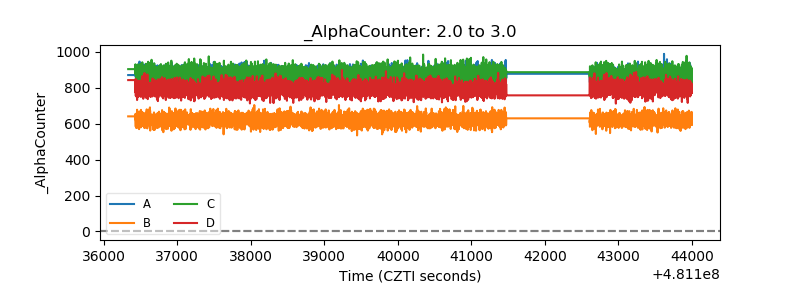 |
| _CPM_Rate | 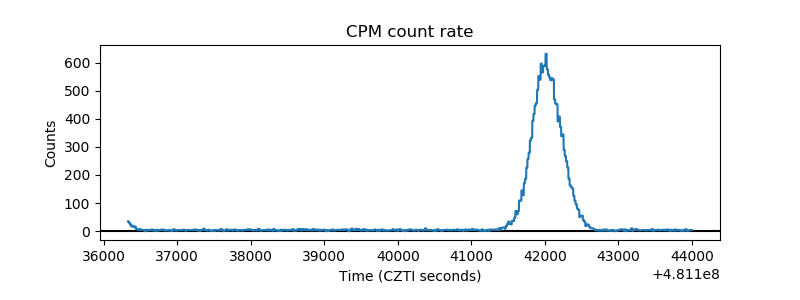 |
| CZT Counter | 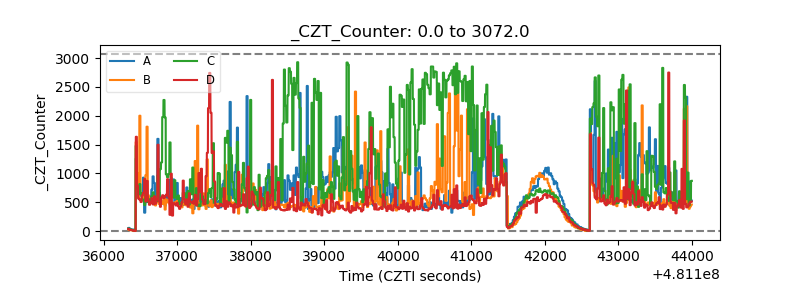 |
| +2.5 Volts monitor | 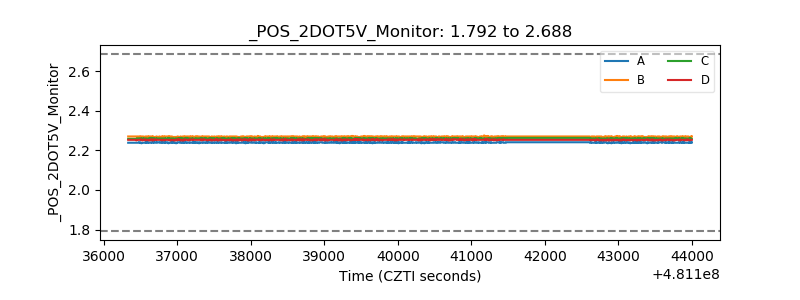 |
| +5 Volts monitor | 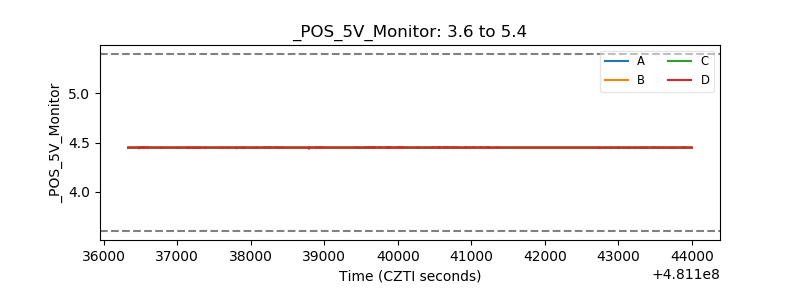 |
| _ROLL_ROT | 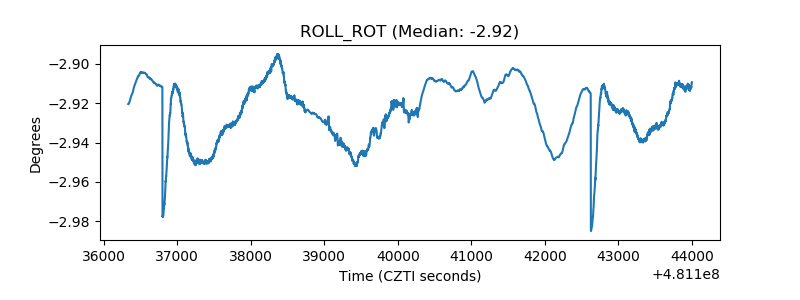 |
| _Roll_DEC | 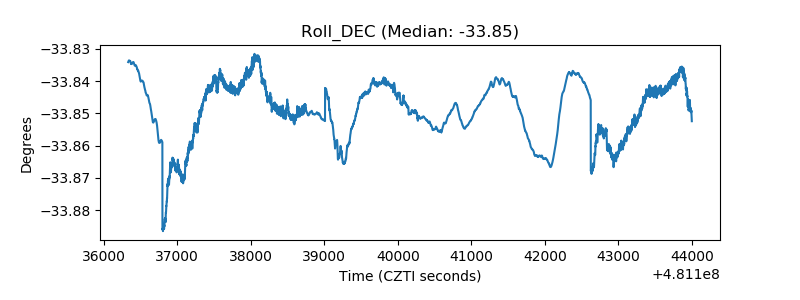 |
| _Roll_RA | 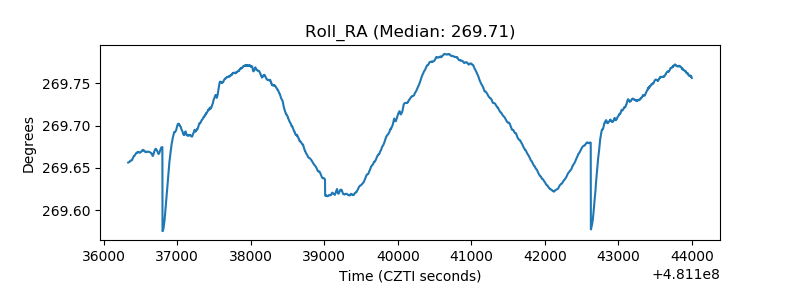 |
| Veto Counter | 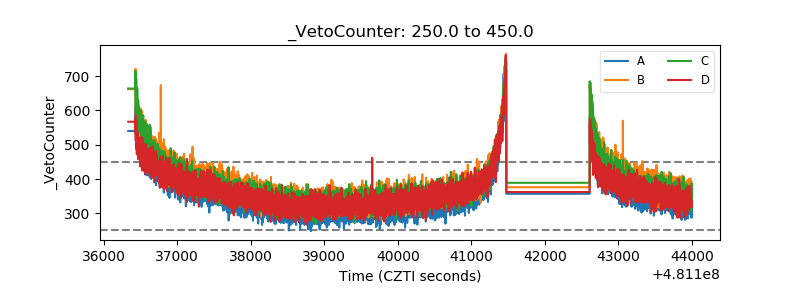 |