| Param | Original file | Final file |
|---|---|---|
| Filename | modeM0/AS1A13_090T01_9000006458_51424cztM0_level2.fits | modeM0/AS1A13_090T01_9000006458_51424cztM0_level2_quad_clean.evt |
| Size (bytes) | 602,337,600 | 94,438,080 |
| Size | 574.4 MB | 90.1 MB |
| Events in quadrant A | 5,050,541 | 628,962 |
| Events in quadrant B | 4,480,469 | 670,435 |
| Events in quadrant C | 8,274,601 | 515,824 |
| Events in quadrant D | 3,976,440 | 581,078 |
| Mode M0 | |||
|---|---|---|---|
| Quadrant | BADHDUFLAG | Total packets | Discarded packets |
| A | 0 | 19597 | 2 |
| B | 0 | 17861 | 2 |
| C | 0 | 29212 | 2 |
| D | 0 | 16578 | 3 |
| Mode M9 | |||
|---|---|---|---|
| Quadrant | BADHDUFLAG | Total packets | Discarded packets |
| A | 0 | 11 | 0 |
| B | 0 | 12 | 0 |
| C | 0 | 12 | 0 |
| D | 0 | 12 | 0 |
| Mode SS | |||
|---|---|---|---|
| Quadrant | BADHDUFLAG | Total packets | Discarded packets |
| A | 0 | 136 | 0 |
| B | 0 | 136 | 0 |
| C | 0 | 136 | 0 |
| D | 0 | 136 | 0 |
| Quadrant | Total seconds | Saturated seconds | Saturation percentage |
|---|---|---|---|
| A | 6638 | 361 | 5.438385% |
| B | 6638 | 466 | 7.020187% |
| C | 6638 | 1404 | 21.150949% |
| D | 6637 | 185 | 2.787404% |
Noise dominated data is calculated using 1-second bins in cleaned event files. If a bin has >2000 counts, and if more than 50% of those come from <1% of pixels, then it is considered to be noise-dominated and hence unusable.
| Quadrant | # 1 sec bins | Bins with >0 counts | Bins with >2000 counts | High rate bins dominated by noise | Noise dominated (total time) | Noise dominated (detector-on time) | Marked lightcurve |
|---|---|---|---|---|---|---|---|
| A | 7647 | 6638 | 203 | 203 | 2.65% | 3.06% | 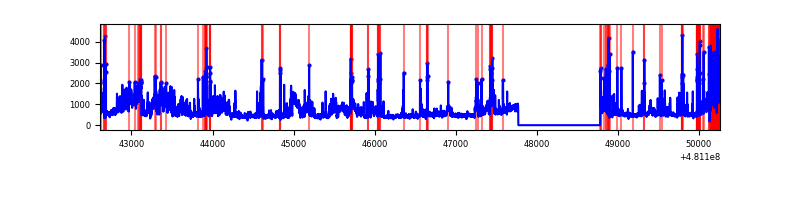 |
| B | 7648 | 6639 | 227 | 227 | 2.97% | 3.42% | 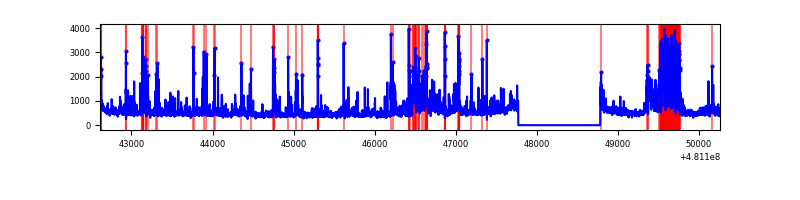 |
| C | 7648 | 6639 | 1199 | 1199 | 15.68% | 18.06% | 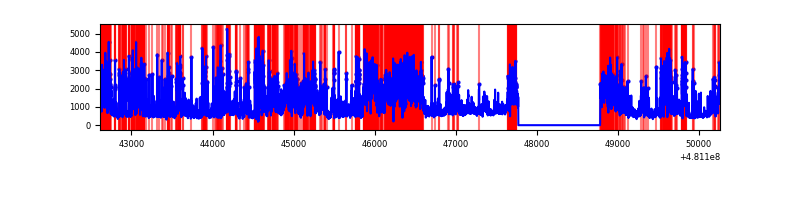 |
| D | 7647 | 6638 | 129 | 129 | 1.69% | 1.94% | 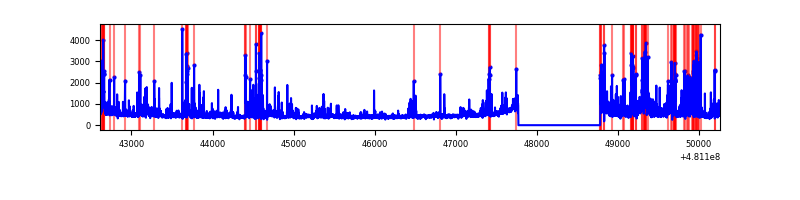 |
Top three noisy pixels from each quadrant. If the there are fewer than three noisy pixels in the level2.evt file, extra rows are filled as -1
| Pixel properties | Quadrant properties | ||||||
|---|---|---|---|---|---|---|---|
| Quadrant | DetID | PixID | Counts | Sigma | Mean | Median | Sigma |
| A | 12 | 3 | 963038 | 5382.02 | 727 | 709 | 178.8 |
| A | 7 | 64 | 289625 | 1615.82 | 727 | 709 | 178.8 |
| A | 15 | 174 | 186963 | 1041.66 | 727 | 709 | 178.8 |
| B | 5 | 185 | 826513 | 5363.33 | 722 | 696 | 154.0 |
| B | 5 | 172 | 142436 | 920.54 | 722 | 696 | 154.0 |
| B | 10 | 14 | 123327 | 796.44 | 722 | 696 | 154.0 |
| C | 10 | 171 | 1815124 | 10042.59 | 659 | 653 | 180.7 |
| C | 4 | 12 | 1682646 | 9309.36 | 659 | 653 | 180.7 |
| C | 10 | 19 | 585673 | 3237.92 | 659 | 653 | 180.7 |
| D | 7 | 80 | 277418 | 1407.85 | 703 | 677 | 196.6 |
| D | 11 | 176 | 241718 | 1226.24 | 703 | 677 | 196.6 |
| D | 0 | 129 | 118229 | 598.01 | 703 | 677 | 196.6 |
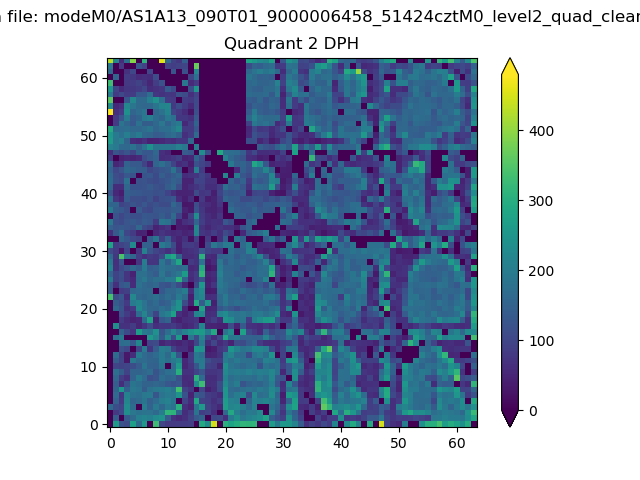
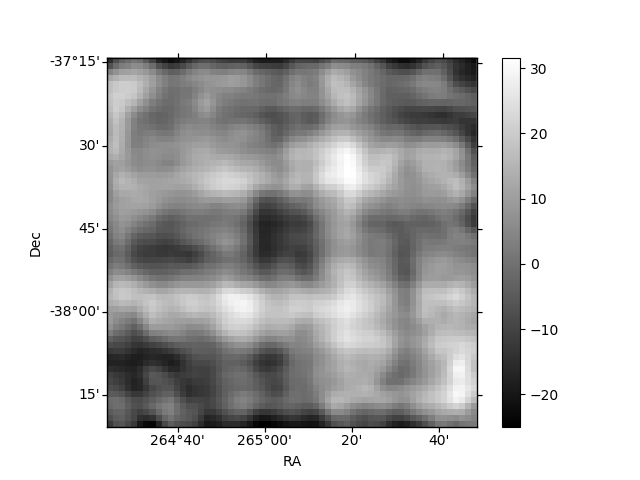
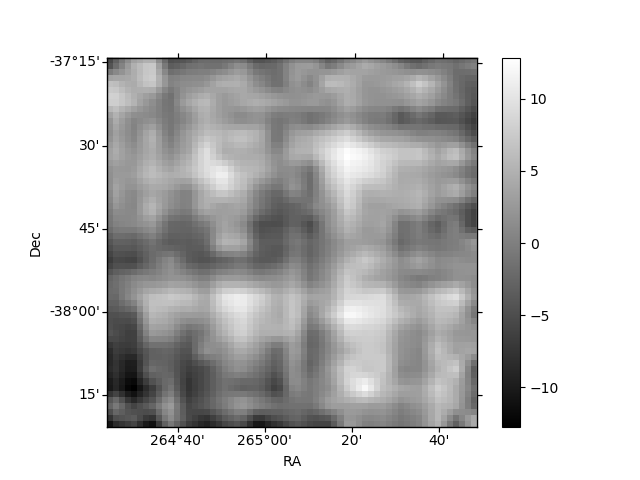
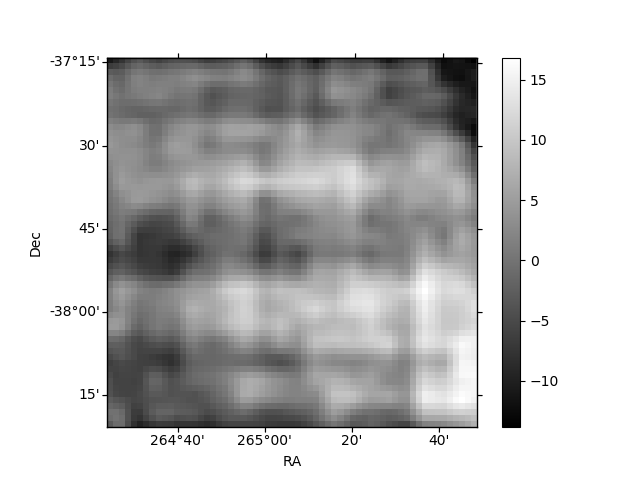
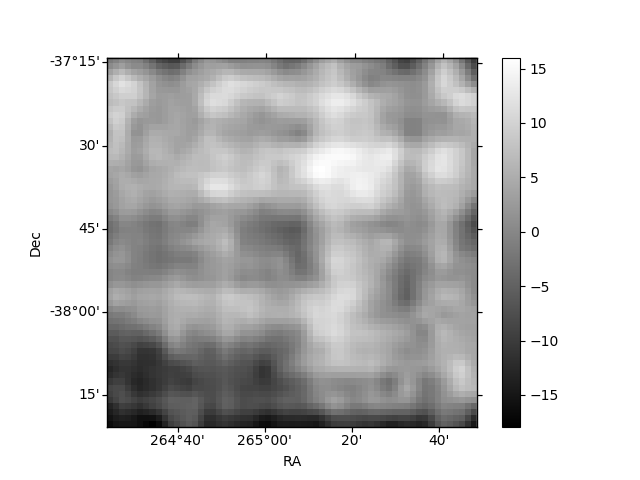
Histogram calculated using DETX and DETY for each event in the final _common_clean file
| Quadrant A | 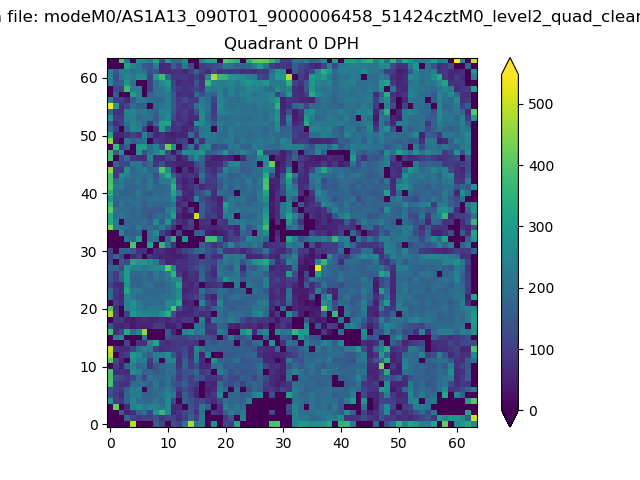 |
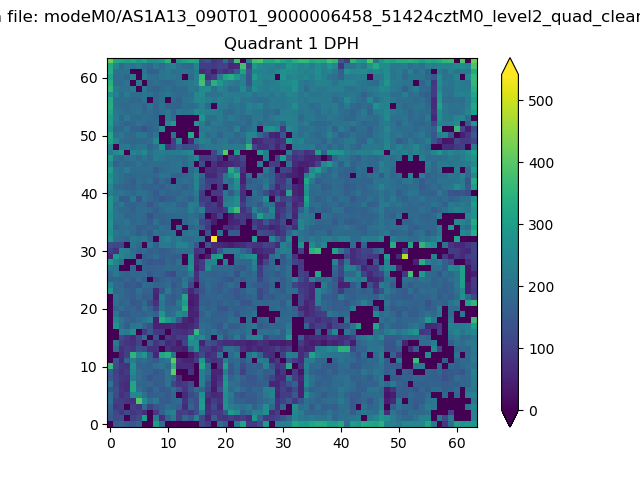 |
Quadrant B |
|---|---|---|---|
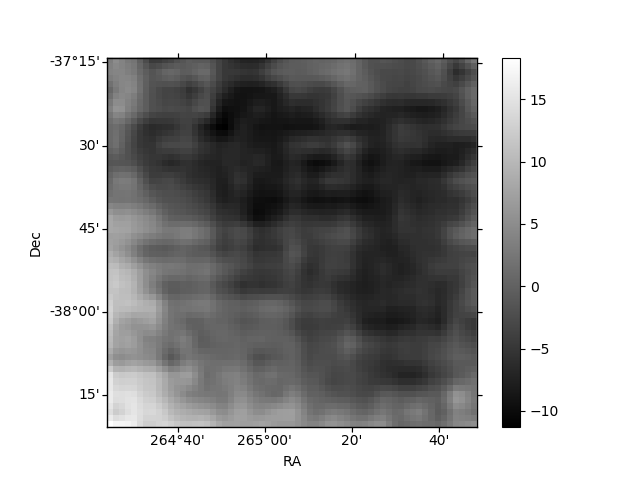
| Quadrant D | 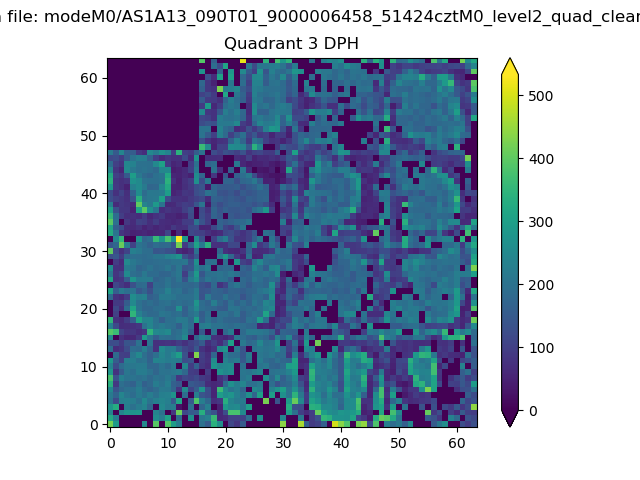 |
 |
Quadrant C |
| Plot type | Count rate plots | Images |
|---|---|---|
| Comparison with Poisson distribution Blue bars denote a histogram of data divided into 1 sec bins. Red curve is a Poisson curve with rate = median count rate of data. |
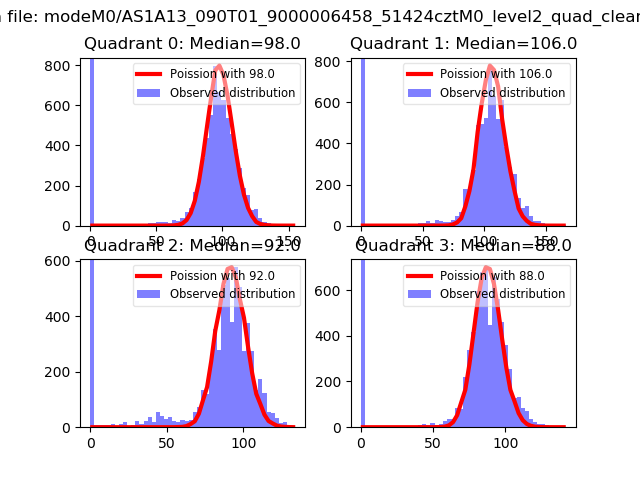 |
 |
| Quadrant-wise count rates Data is divided into 100 sec bins |
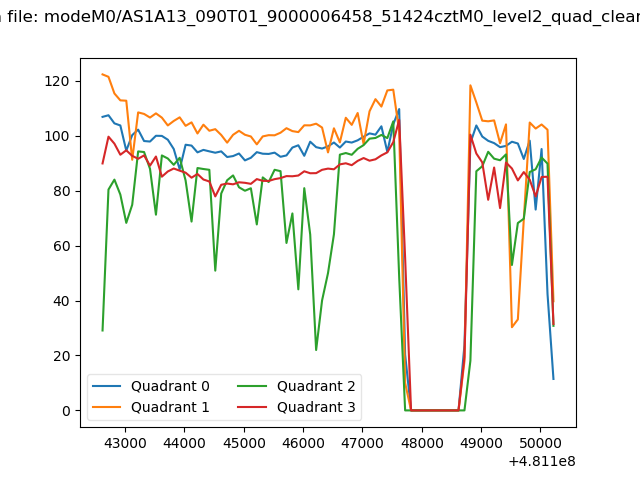 |
|
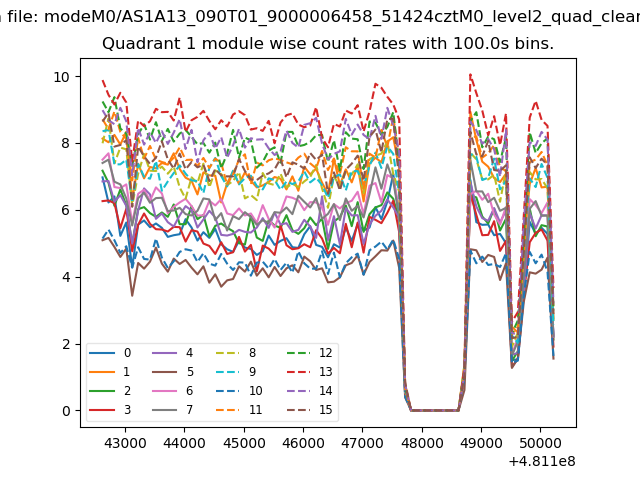
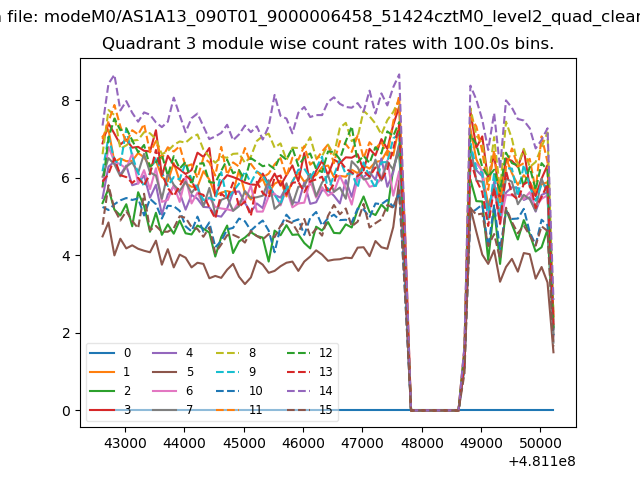
| Module-wise count rates for Quadrant A Data is divided into 100 sec bins |
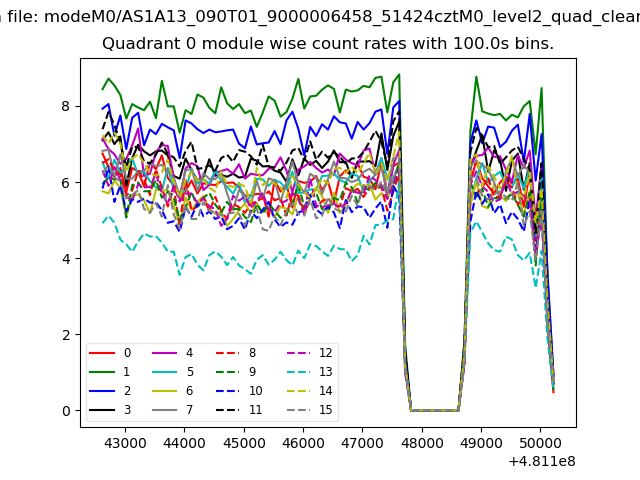 |
 |
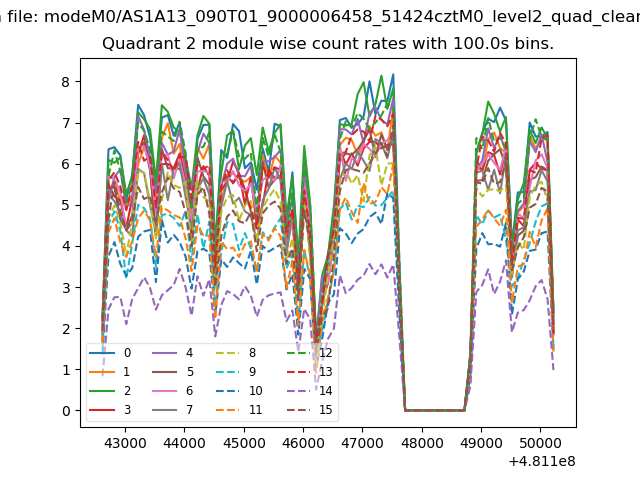
| Module-wise count rates for Quadrant B Data is divided into 100 sec bins |
 |
 |
| Module-wise count rates for Quadrant C Data is divided into 100 sec bins |
 |
 |
| Module-wise count rates for Quadrant D Data is divided into 100 sec bins |
 |
 |
| Parameter | Plot |
|---|---|
| CZT HV Monitor | 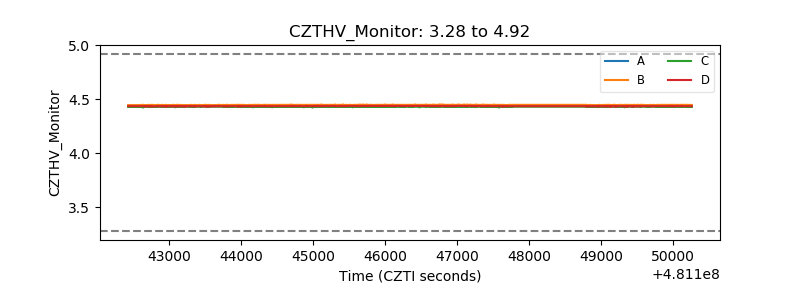 |
| D_VDD | 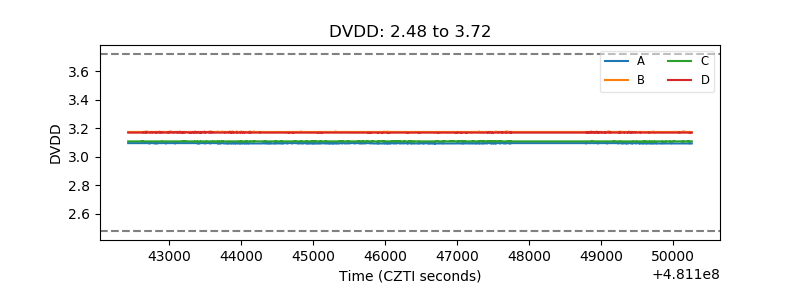 |
| Temperature 1 | 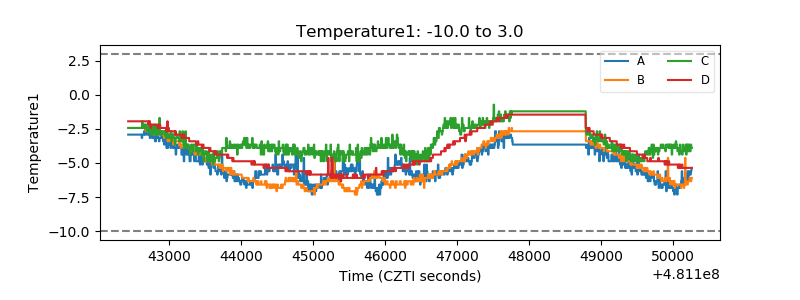 |
| Veto HV Monitor | 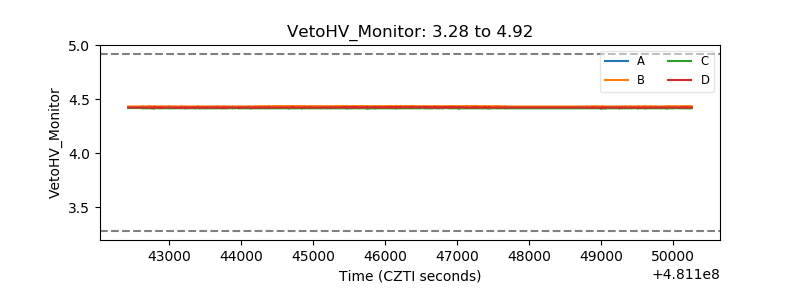 |
| Veto LLD | 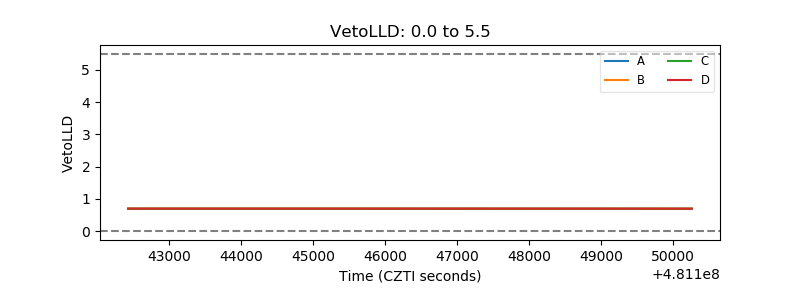 |
| Alpha Counter | 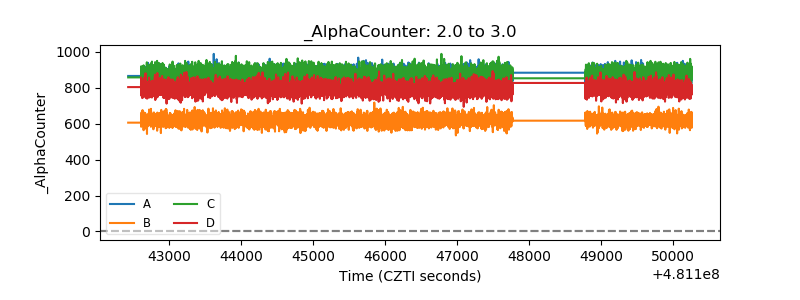 |
| _CPM_Rate | 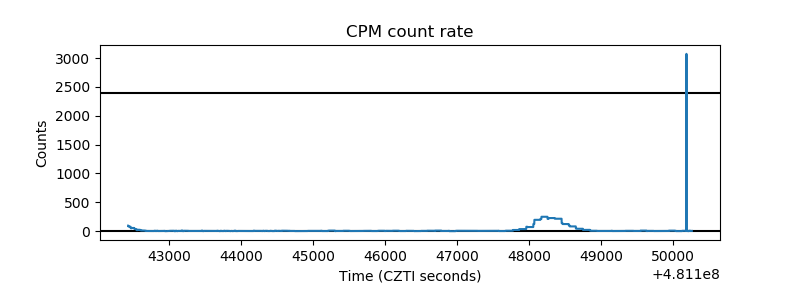 |
| CZT Counter | 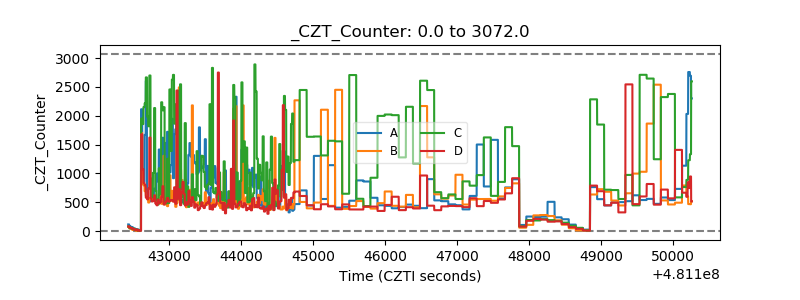 |
| +2.5 Volts monitor | 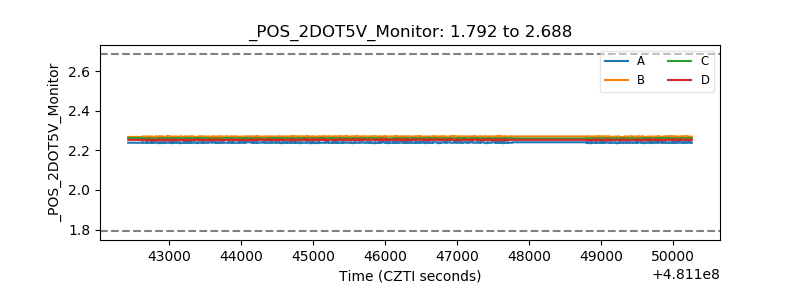 |
| +5 Volts monitor | 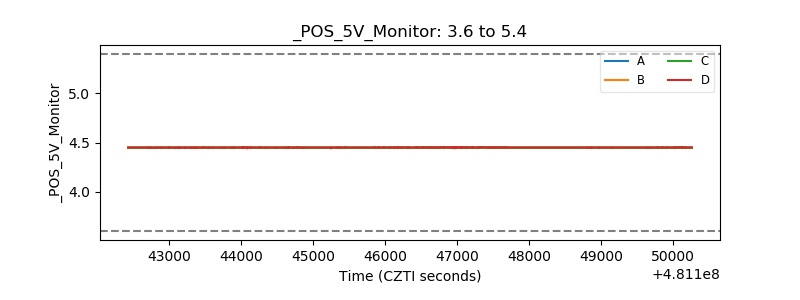 |
| _ROLL_ROT | 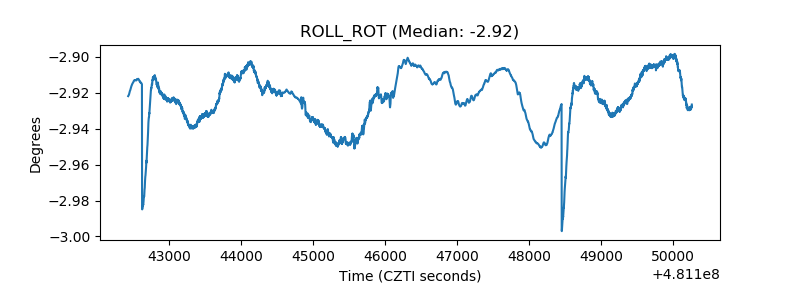 |
| _Roll_DEC | 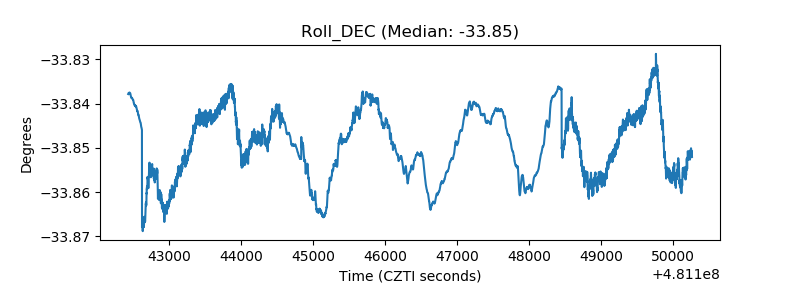 |
| _Roll_RA | 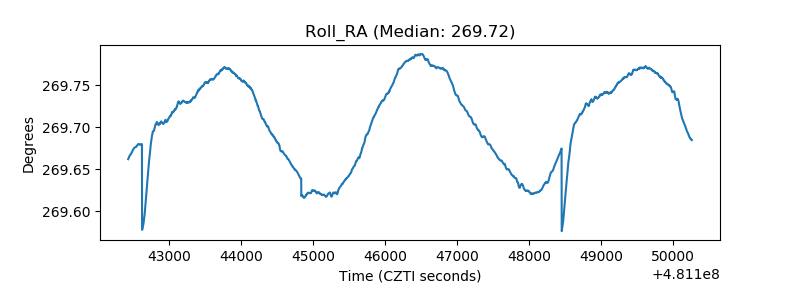 |
| Veto Counter | 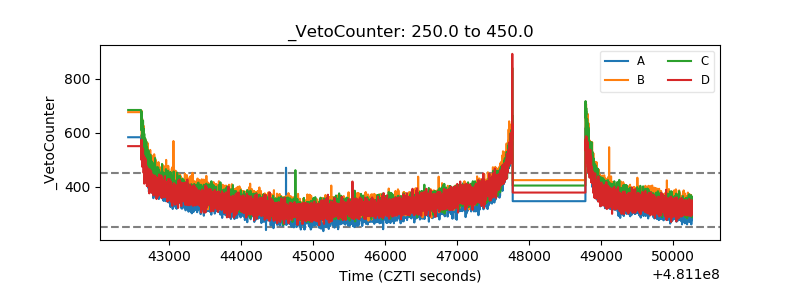 |