| Param | Original file | Final file |
|---|---|---|
| Filename | modeM0/AS1A13_090T01_9000006458_51425cztM0_level2.fits | modeM0/AS1A13_090T01_9000006458_51425cztM0_level2_quad_clean.evt |
| Size (bytes) | 717,384,960 | 93,919,680 |
| Size | 684.2 MB | 89.6 MB |
| Events in quadrant A | 7,467,544 | 593,558 |
| Events in quadrant B | 5,128,659 | 682,373 |
| Events in quadrant C | 9,055,455 | 493,042 |
| Events in quadrant D | 4,363,556 | 588,600 |
| Mode M0 | |||
|---|---|---|---|
| Quadrant | BADHDUFLAG | Total packets | Discarded packets |
| A | 0 | 27025 | 2 |
| B | 0 | 20026 | 3 |
| C | 0 | 31771 | 2 |
| D | 0 | 18029 | 2 |
| Mode M9 | |||
|---|---|---|---|
| Quadrant | BADHDUFLAG | Total packets | Discarded packets |
| A | 0 | 10 | 0 |
| B | 0 | 11 | 0 |
| C | 0 | 11 | 0 |
| D | 0 | 11 | 0 |
| Mode SS | |||
|---|---|---|---|
| Quadrant | BADHDUFLAG | Total packets | Discarded packets |
| A | 0 | 142 | 0 |
| B | 0 | 142 | 0 |
| C | 0 | 142 | 0 |
| D | 0 | 142 | 0 |
| Quadrant | Total seconds | Saturated seconds | Saturation percentage |
|---|---|---|---|
| A | 6978 | 988 | 14.158785% |
| B | 6977 | 566 | 8.112369% |
| C | 6977 | 1838 | 26.343701% |
| D | 6977 | 235 | 3.368210% |
Noise dominated data is calculated using 1-second bins in cleaned event files. If a bin has >2000 counts, and if more than 50% of those come from <1% of pixels, then it is considered to be noise-dominated and hence unusable.
| Quadrant | # 1 sec bins | Bins with >0 counts | Bins with >2000 counts | High rate bins dominated by noise | Noise dominated (total time) | Noise dominated (detector-on time) | Marked lightcurve |
|---|---|---|---|---|---|---|---|
| A | 7723 | 6979 | 719 | 719 | 9.31% | 10.30% | 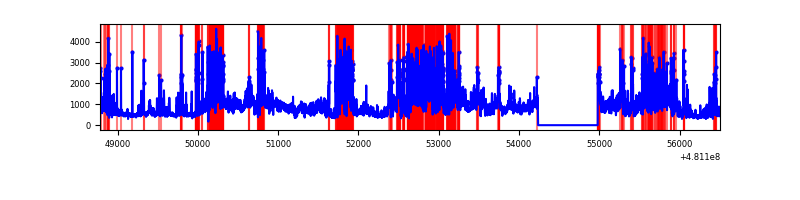 |
| B | 7722 | 6978 | 328 | 328 | 4.25% | 4.70% | 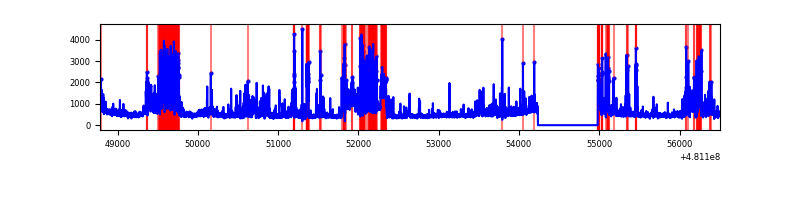 |
| C | 7721 | 6976 | 1547 | 1547 | 20.04% | 22.18% | 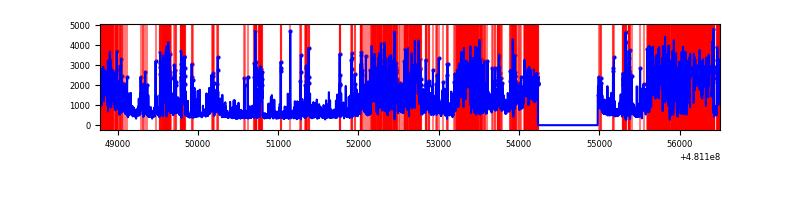 |
| D | 7722 | 6978 | 170 | 170 | 2.20% | 2.44% | 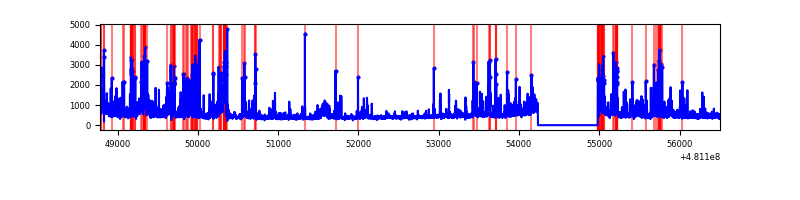 |
Top three noisy pixels from each quadrant. If the there are fewer than three noisy pixels in the level2.evt file, extra rows are filled as -1
| Pixel properties | Quadrant properties | ||||||
|---|---|---|---|---|---|---|---|
| Quadrant | DetID | PixID | Counts | Sigma | Mean | Median | Sigma |
| A | 7 | 64 | 1825174 | 10410.6 | 713 | 694 | 175.3 |
| A | 12 | 3 | 1675594 | 9557.09 | 713 | 694 | 175.3 |
| A | 15 | 174 | 216114 | 1229.2 | 713 | 694 | 175.3 |
| B | 5 | 172 | 1001462 | 6339.28 | 738 | 713 | 157.9 |
| B | 5 | 185 | 562104 | 3556.15 | 738 | 713 | 157.9 |
| B | 8 | 128 | 79739 | 500.59 | 738 | 713 | 157.9 |
| C | 4 | 12 | 3690970 | 20736.84 | 649 | 644 | 178.0 |
| C | 15 | 179 | 769284 | 4319.18 | 649 | 644 | 178.0 |
| C | 10 | 171 | 681169 | 3824.04 | 649 | 644 | 178.0 |
| D | 8 | 176 | 418480 | 2058.22 | 722 | 696 | 203.0 |
| D | 11 | 176 | 403054 | 1982.22 | 722 | 696 | 203.0 |
| D | 0 | 129 | 158923 | 779.51 | 722 | 696 | 203.0 |
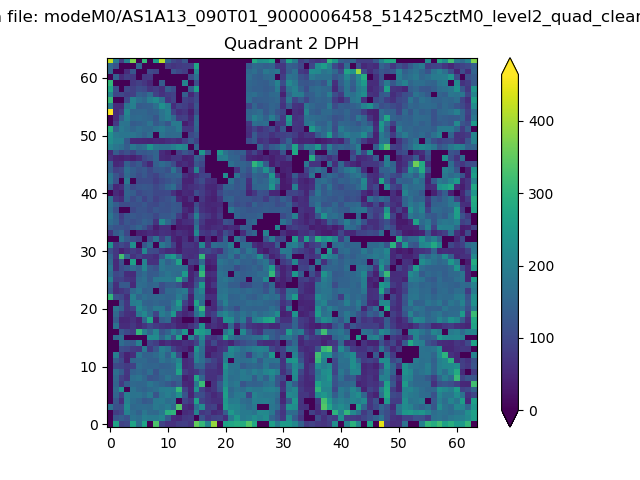
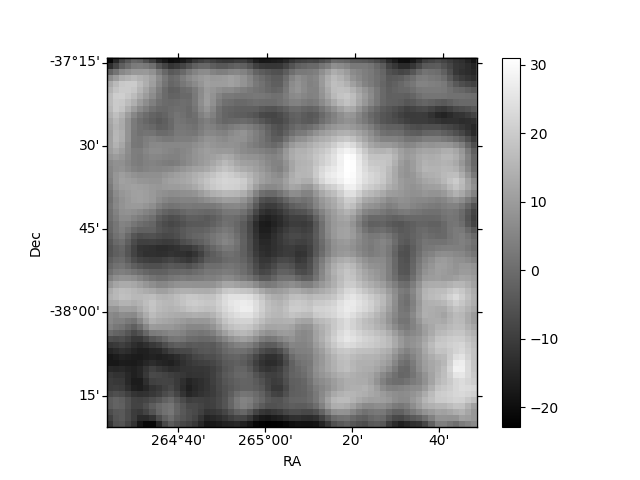
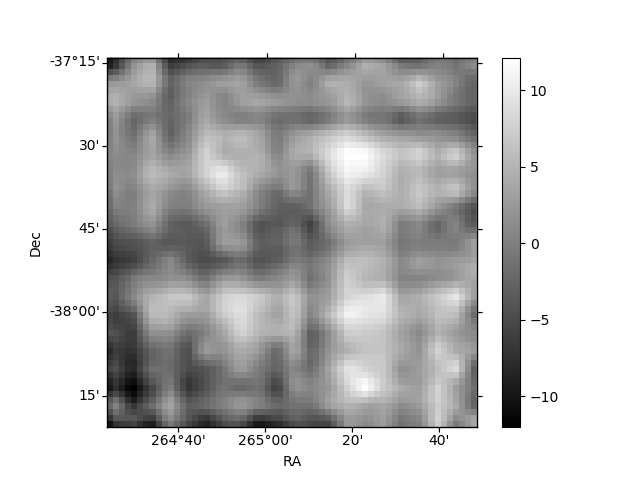
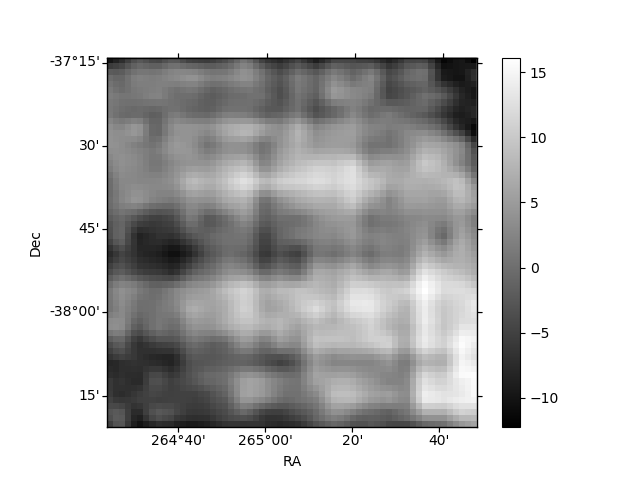
Histogram calculated using DETX and DETY for each event in the final _common_clean file
| Quadrant A | 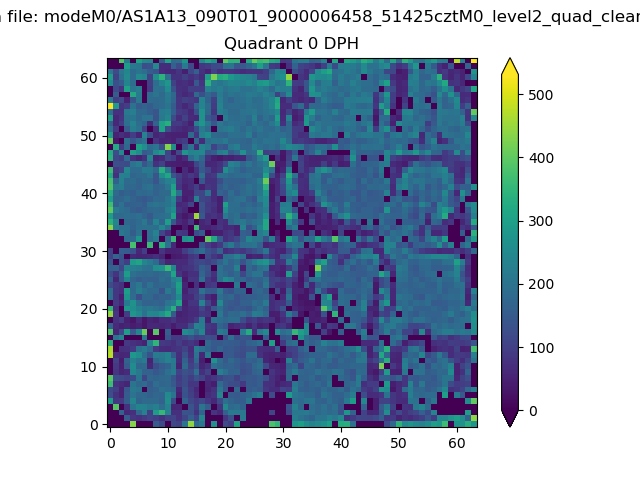 |
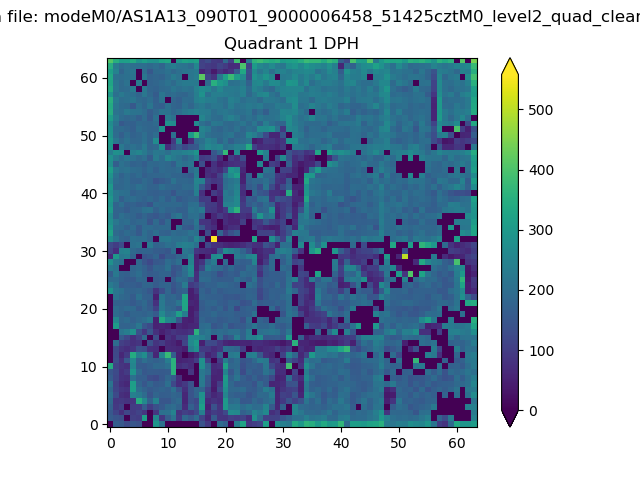 |
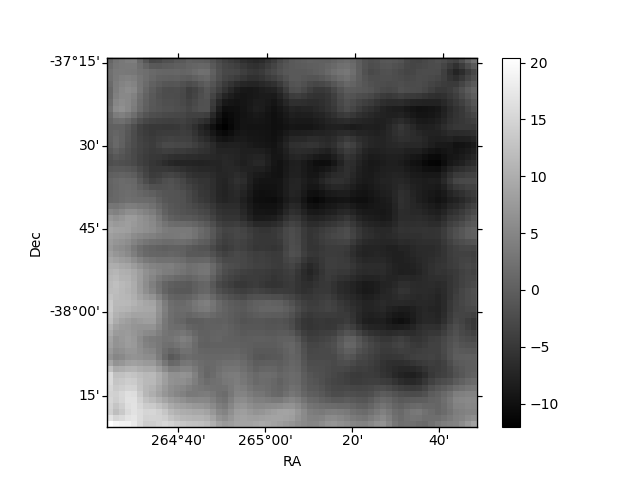
Quadrant B |
|---|---|---|---|
| Quadrant D | 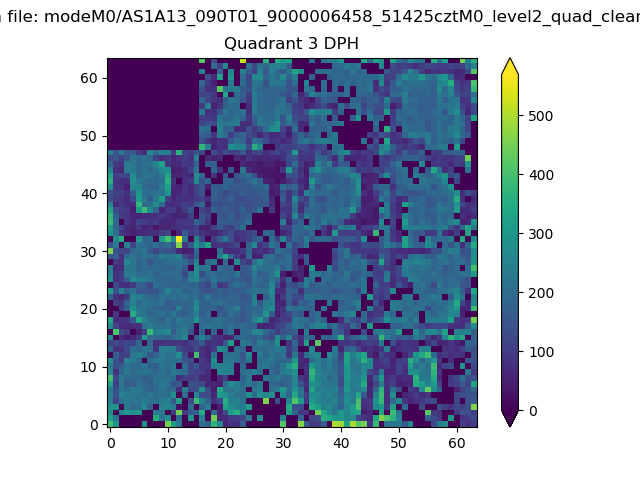 |
 |
Quadrant C |
| Plot type | Count rate plots | Images |
|---|---|---|
| Comparison with Poisson distribution Blue bars denote a histogram of data divided into 1 sec bins. Red curve is a Poisson curve with rate = median count rate of data. |
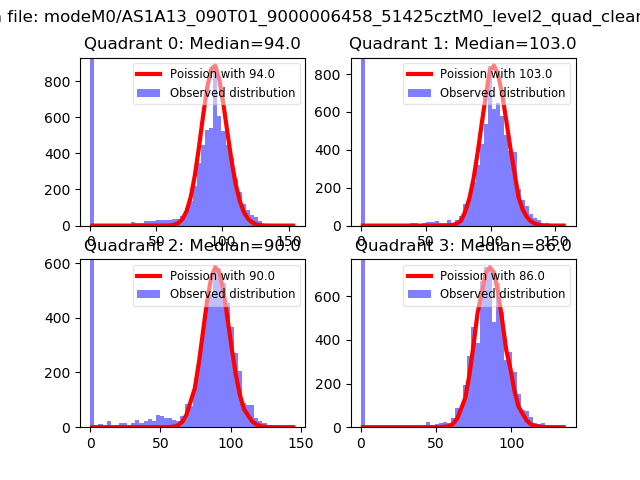 |
 |
| Quadrant-wise count rates Data is divided into 100 sec bins |
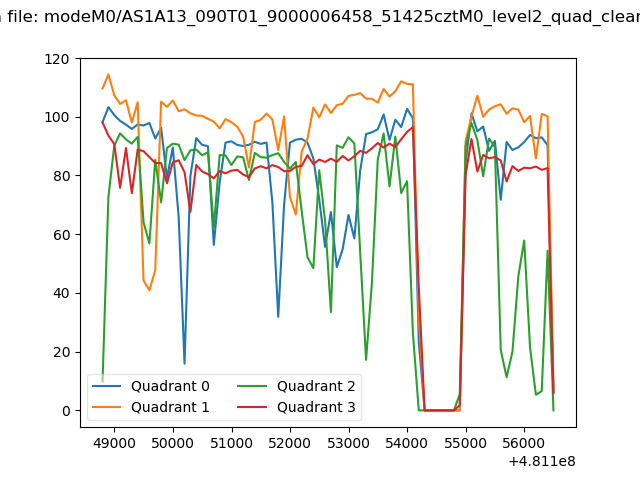 |
|
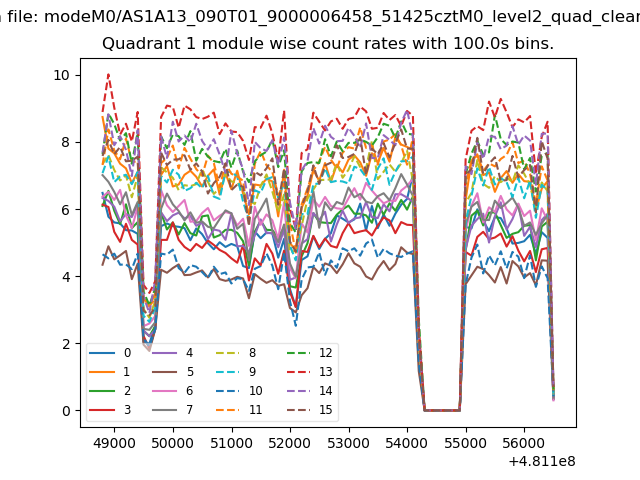
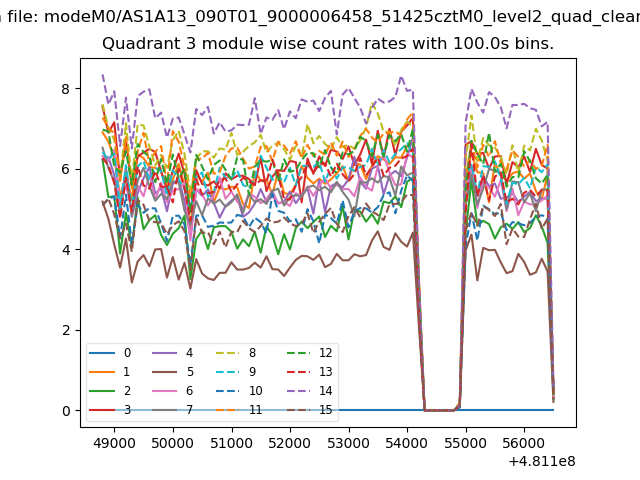
| Module-wise count rates for Quadrant A Data is divided into 100 sec bins |
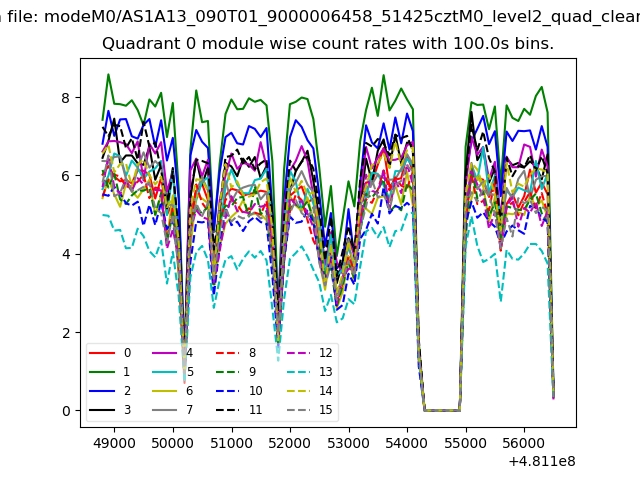 |
 |
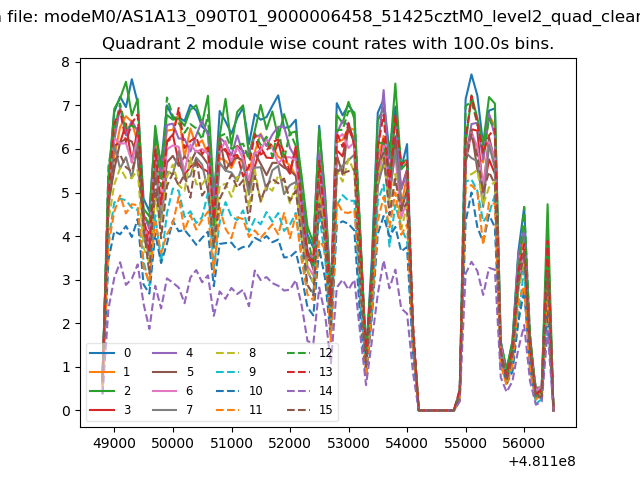
| Module-wise count rates for Quadrant B Data is divided into 100 sec bins |
 |
 |
| Module-wise count rates for Quadrant C Data is divided into 100 sec bins |
 |
 |
| Module-wise count rates for Quadrant D Data is divided into 100 sec bins |
 |
 |
| Parameter | Plot |
|---|---|
| CZT HV Monitor | 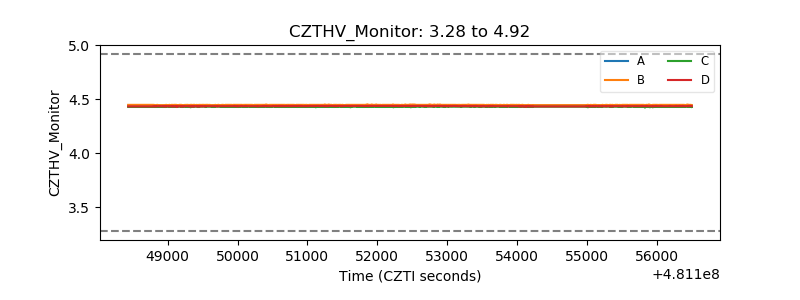 |
| D_VDD | 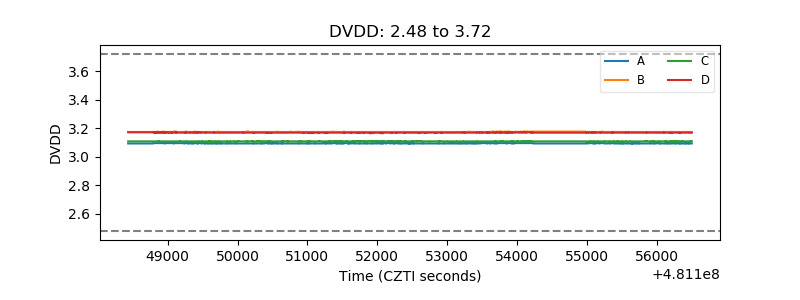 |
| Temperature 1 | 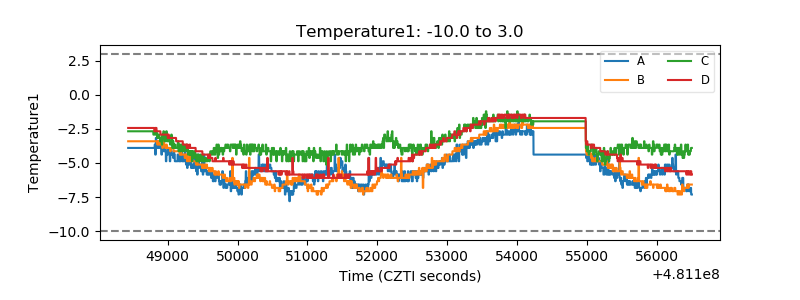 |
| Veto HV Monitor | 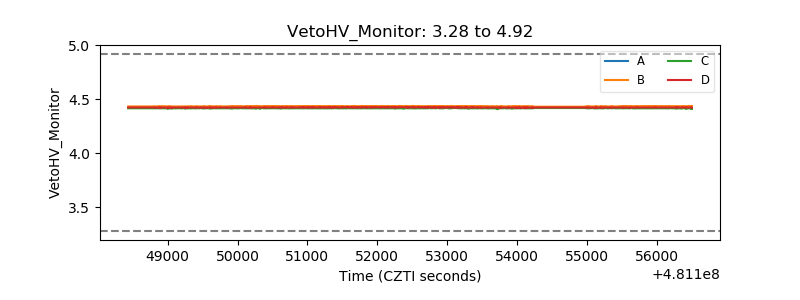 |
| Veto LLD | 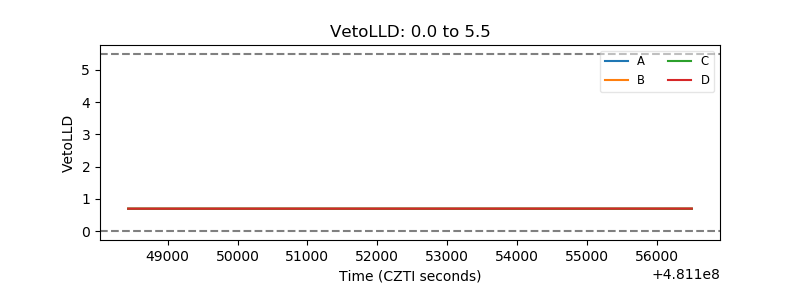 |
| Alpha Counter | 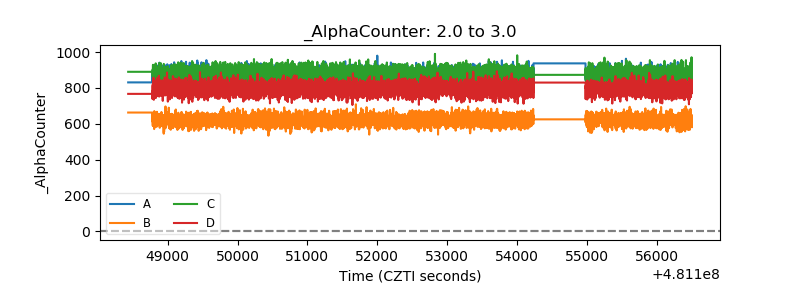 |
| _CPM_Rate | 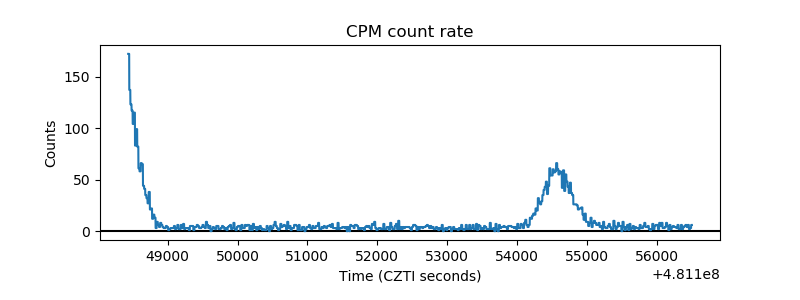 |
| CZT Counter | 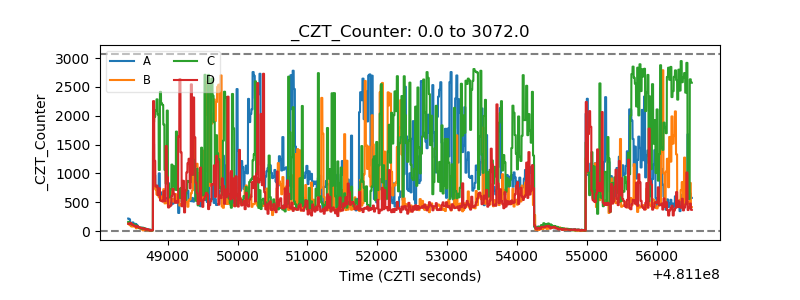 |
| +2.5 Volts monitor | 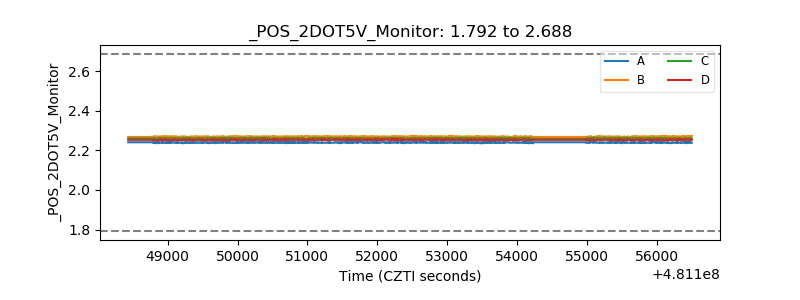 |
| +5 Volts monitor | 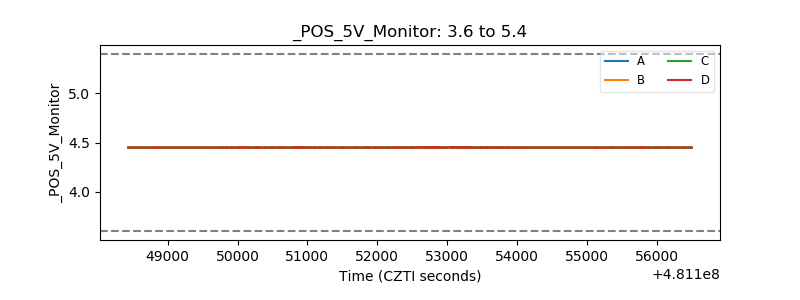 |
| _ROLL_ROT | 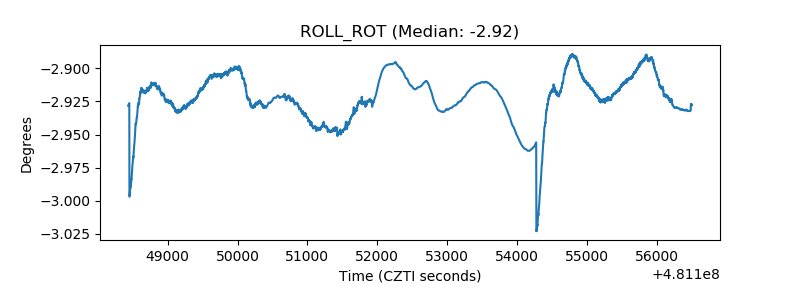 |
| _Roll_DEC | 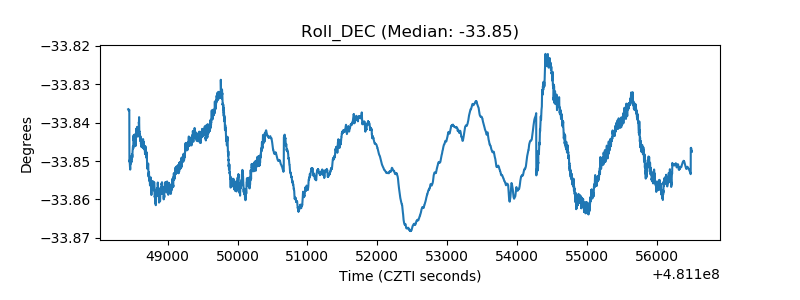 |
| _Roll_RA | 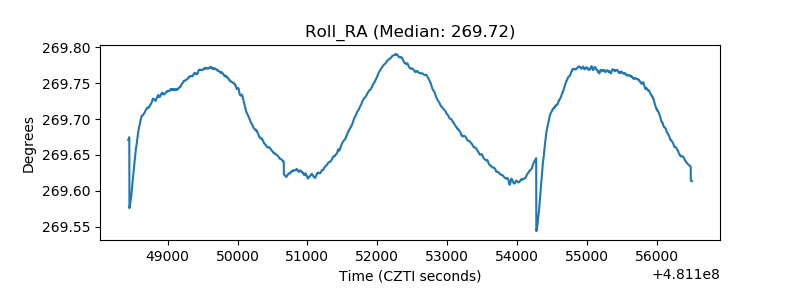 |
| Veto Counter | 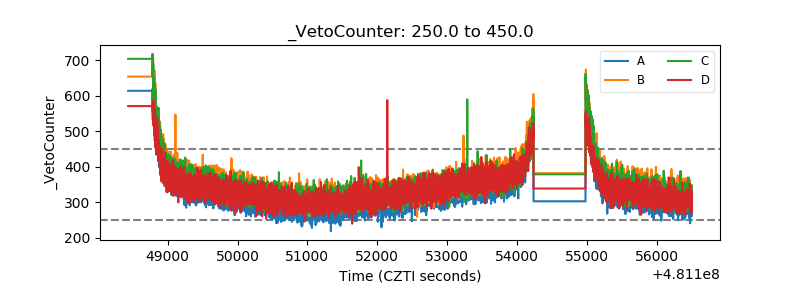 |