| Param | Original file | Final file |
|---|---|---|
| Filename | modeM0/AS1A13_090T01_9000006458_51427cztM0_level2.fits | modeM0/AS1A13_090T01_9000006458_51427cztM0_level2_quad_clean.evt |
| Size (bytes) | 1,024,076,160 | 105,212,160 |
| Size | 976.6 MB | 100.3 MB |
| Events in quadrant A | 9,592,834 | 712,357 |
| Events in quadrant B | 4,779,022 | 860,160 |
| Events in quadrant C | 16,211,414 | 310,951 |
| Events in quadrant D | 6,661,549 | 706,778 |
| Mode M0 | |||
|---|---|---|---|
| Quadrant | BADHDUFLAG | Total packets | Discarded packets |
| A | 0 | 34513 | 6 |
| B | 0 | 20206 | 1 |
| C | 0 | 54024 | 1 |
| D | 0 | 25763 | 1 |
| Mode M9 | |||
|---|---|---|---|
| Quadrant | BADHDUFLAG | Total packets | Discarded packets |
| A | 0 | 1 | 0 |
| B | 0 | 1 | 0 |
| C | 0 | 1 | 0 |
| D | 0 | 1 | 0 |
| Mode SS | |||
|---|---|---|---|
| Quadrant | BADHDUFLAG | Total packets | Discarded packets |
| A | 0 | 172 | 0 |
| B | 0 | 172 | 0 |
| C | 0 | 172 | 0 |
| D | 0 | 172 | 0 |
| Quadrant | Total seconds | Saturated seconds | Saturation percentage |
|---|---|---|---|
| A | 8575 | 1246 | 14.530612% |
| B | 8576 | 305 | 3.556437% |
| C | 8576 | 5388 | 62.826493% |
| D | 8576 | 439 | 5.118937% |
Noise dominated data is calculated using 1-second bins in cleaned event files. If a bin has >2000 counts, and if more than 50% of those come from <1% of pixels, then it is considered to be noise-dominated and hence unusable.
| Quadrant | # 1 sec bins | Bins with >0 counts | Bins with >2000 counts | High rate bins dominated by noise | Noise dominated (total time) | Noise dominated (detector-on time) | Marked lightcurve |
|---|---|---|---|---|---|---|---|
| A | 8680 | 8576 | 979 | 979 | 11.28% | 11.42% | 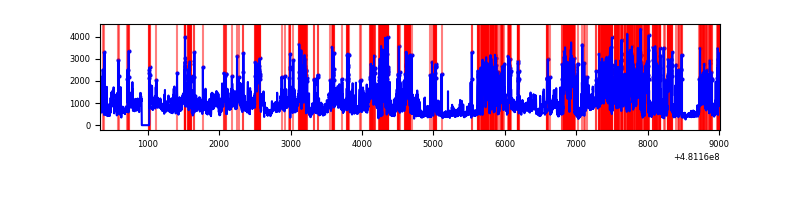 |
| B | 8681 | 8577 | 64 | 64 | 0.74% | 0.75% | 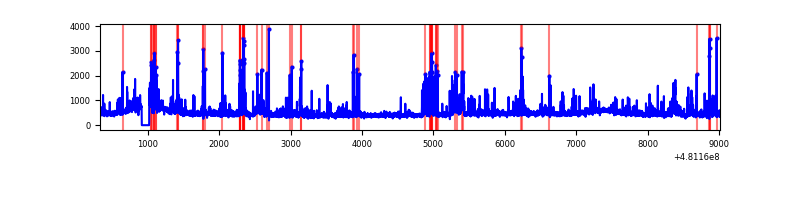 |
| C | 8680 | 8576 | 4908 | 4908 | 56.54% | 57.23% | 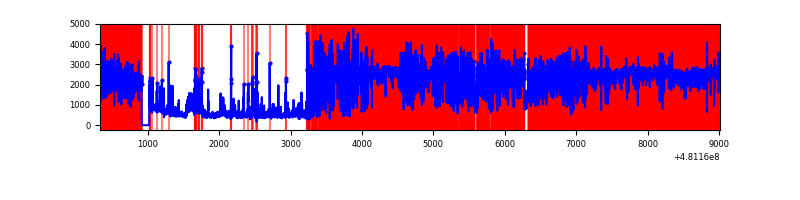 |
| D | 8681 | 8577 | 404 | 404 | 4.65% | 4.71% | 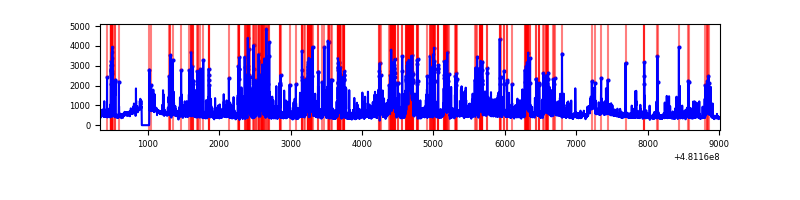 |
Top three noisy pixels from each quadrant. If the there are fewer than three noisy pixels in the level2.evt file, extra rows are filled as -1
| Pixel properties | Quadrant properties | ||||||
|---|---|---|---|---|---|---|---|
| Quadrant | DetID | PixID | Counts | Sigma | Mean | Median | Sigma |
| A | 12 | 3 | 1756359 | 7925.74 | 892 | 871 | 221.5 |
| A | 12 | 250 | 1489046 | 6718.86 | 892 | 871 | 221.5 |
| A | 7 | 64 | 991733 | 4473.58 | 892 | 871 | 221.5 |
| B | 5 | 172 | 253696 | 1251.45 | 937 | 902 | 202.0 |
| B | 5 | 185 | 244758 | 1207.2 | 937 | 902 | 202.0 |
| B | 7 | 252 | 88135 | 431.84 | 937 | 902 | 202.0 |
| C | 4 | 12 | 7914854 | 53145.06 | 542 | 538 | 148.9 |
| C | 15 | 179 | 4567894 | 30670.04 | 542 | 538 | 148.9 |
| C | 15 | 230 | 736180 | 4939.87 | 542 | 538 | 148.9 |
| D | 7 | 80 | 990636 | 3959.19 | 901 | 868 | 250.0 |
| D | 8 | 176 | 551754 | 2203.61 | 901 | 868 | 250.0 |
| D | 6 | 42 | 340284 | 1357.71 | 901 | 868 | 250.0 |
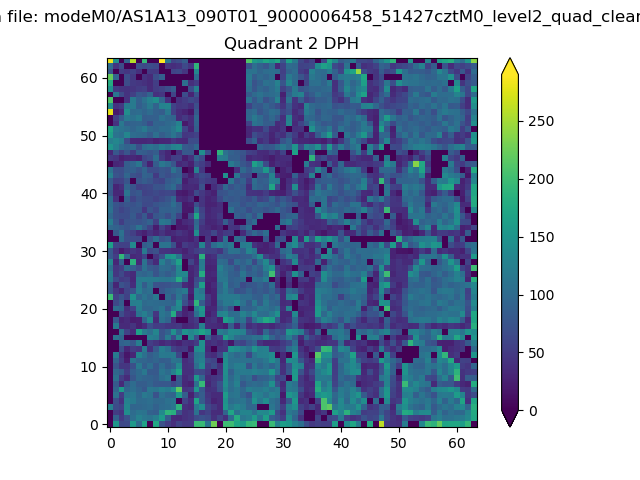
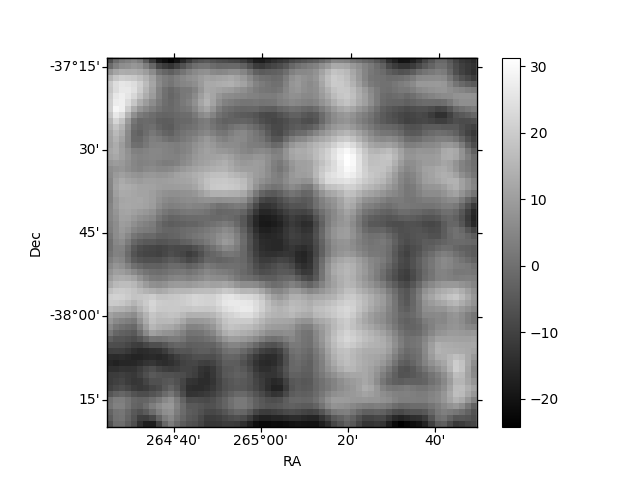
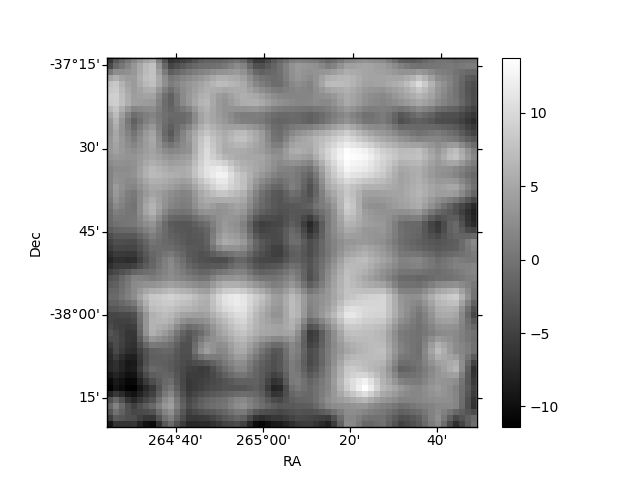
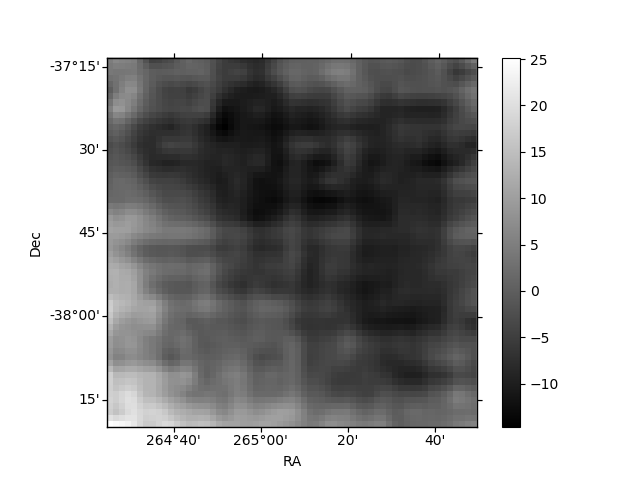
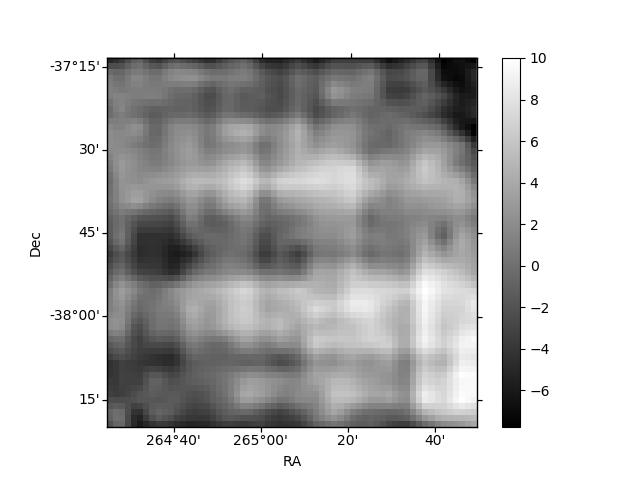
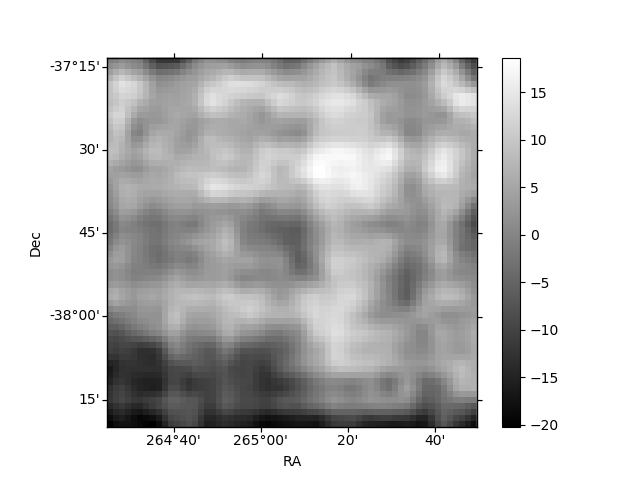
Histogram calculated using DETX and DETY for each event in the final _common_clean file
| Quadrant A | 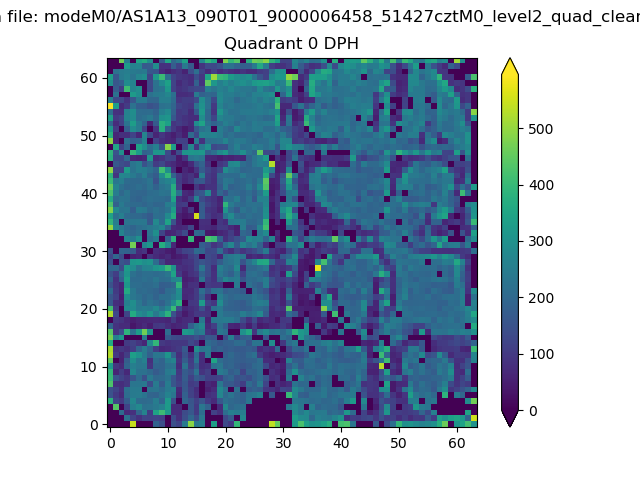 |
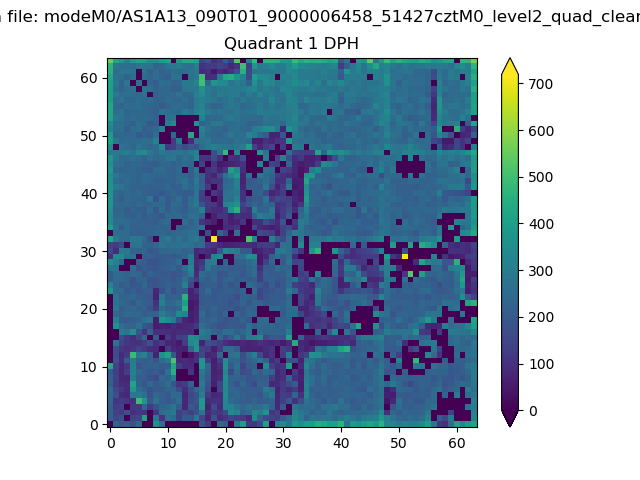 |
Quadrant B |
|---|---|---|---|
| Quadrant D | 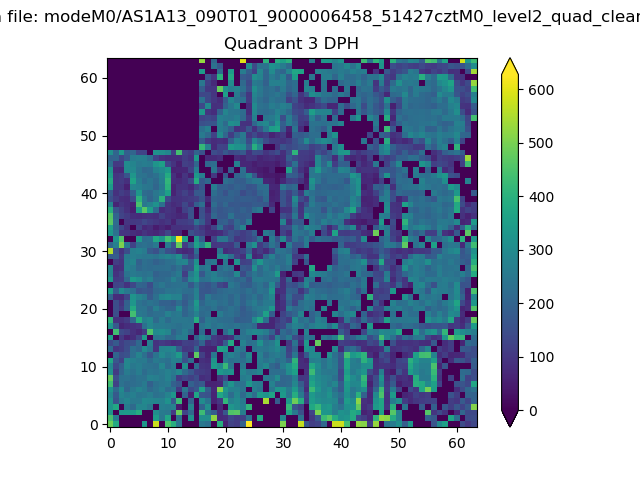 |
 |
Quadrant C |
| Plot type | Count rate plots | Images |
|---|---|---|
| Comparison with Poisson distribution Blue bars denote a histogram of data divided into 1 sec bins. Red curve is a Poisson curve with rate = median count rate of data. |
 |
 |
| Quadrant-wise count rates Data is divided into 100 sec bins |
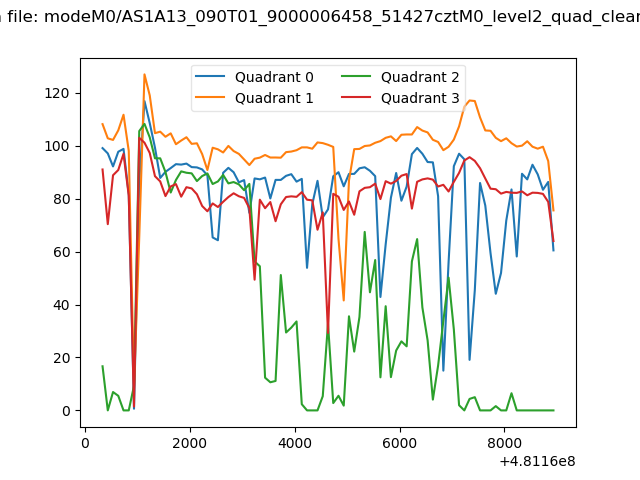 |
|
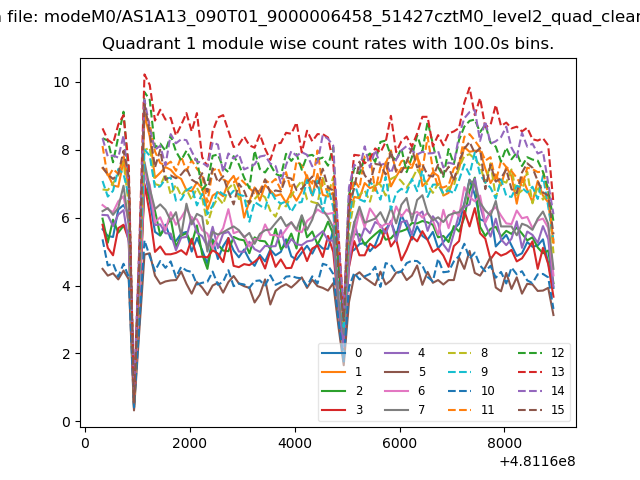
| Module-wise count rates for Quadrant A Data is divided into 100 sec bins |
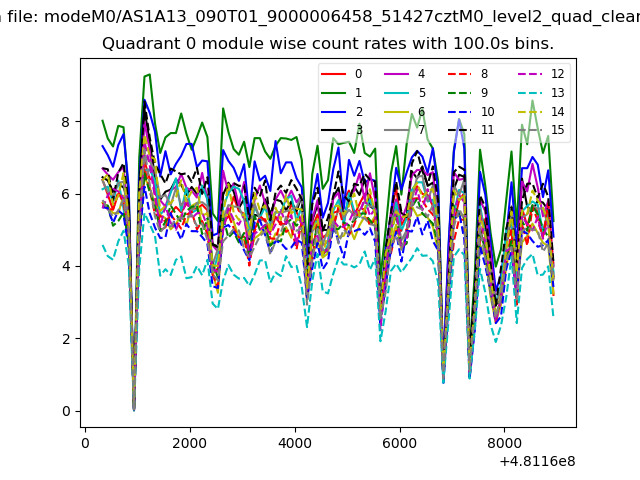 |
 |
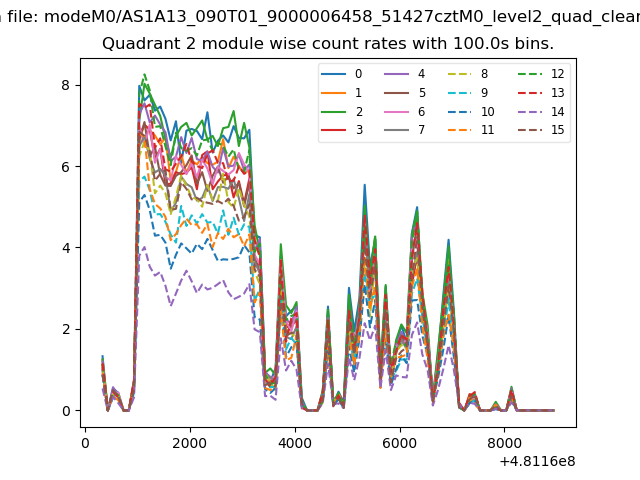
| Module-wise count rates for Quadrant B Data is divided into 100 sec bins |
 |
 |
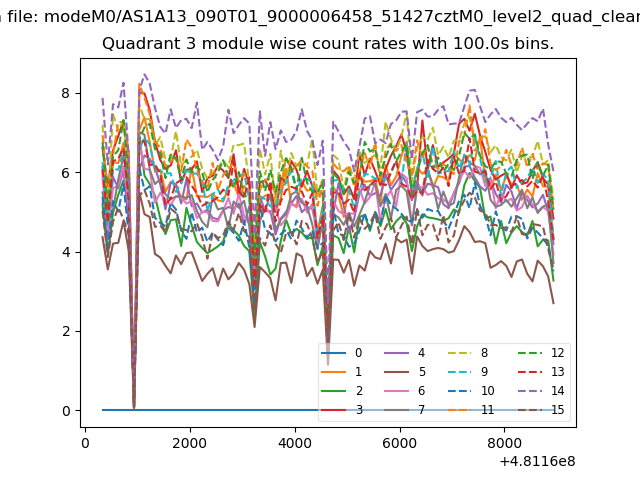
| Module-wise count rates for Quadrant C Data is divided into 100 sec bins |
 |
 |
| Module-wise count rates for Quadrant D Data is divided into 100 sec bins |
 |
 |
| Parameter | Plot |
|---|---|
| CZT HV Monitor | 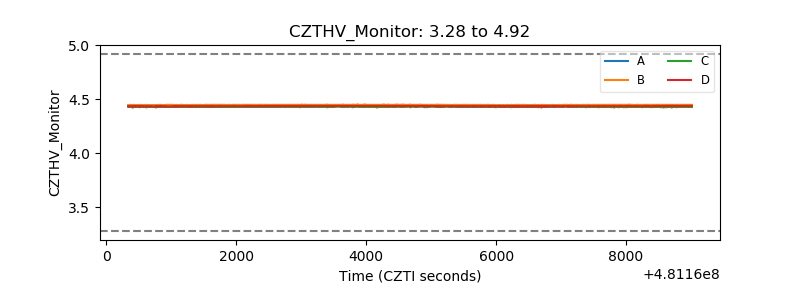 |
| D_VDD | 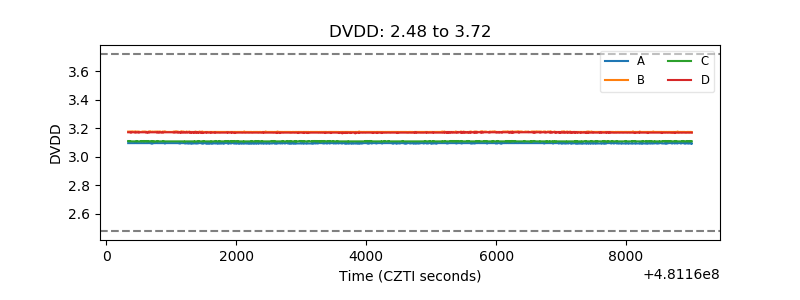 |
| Temperature 1 | 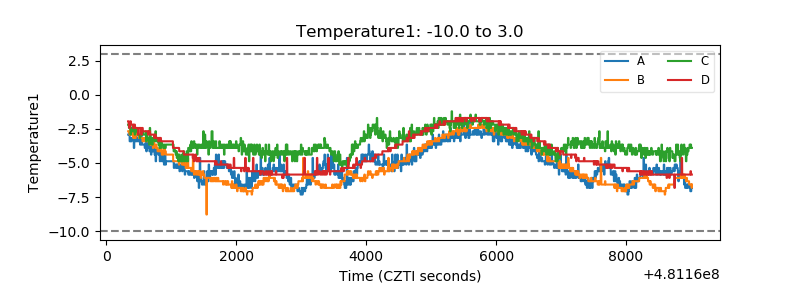 |
| Veto HV Monitor | 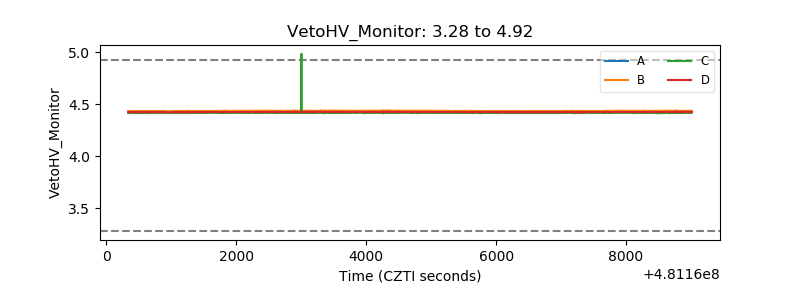 |
| Veto LLD | 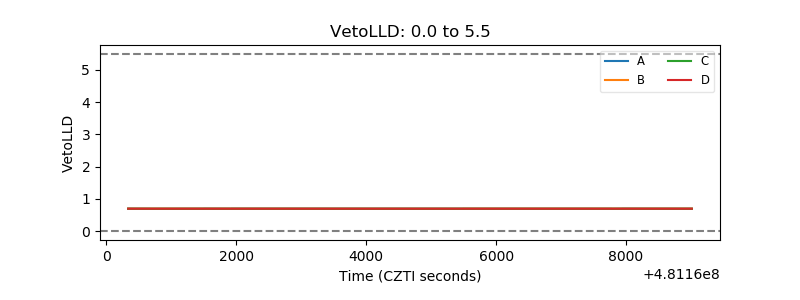 |
| Alpha Counter | 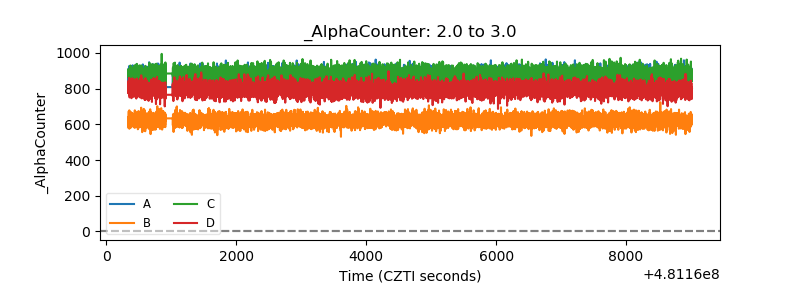 |
| _CPM_Rate | 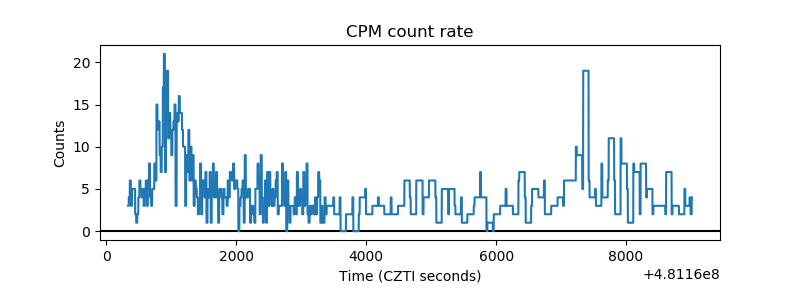 |
| CZT Counter | 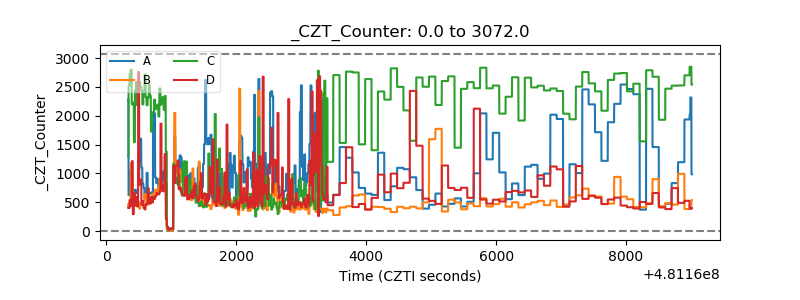 |
| +2.5 Volts monitor | 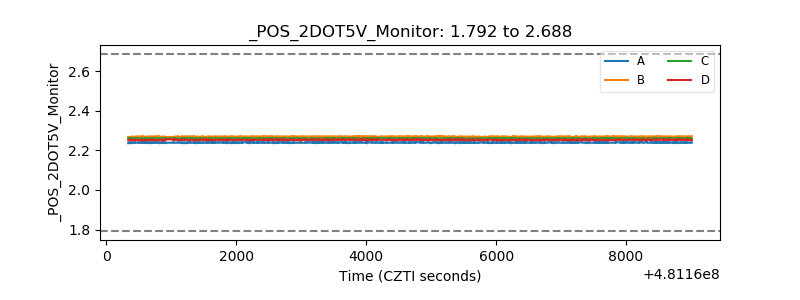 |
| +5 Volts monitor | 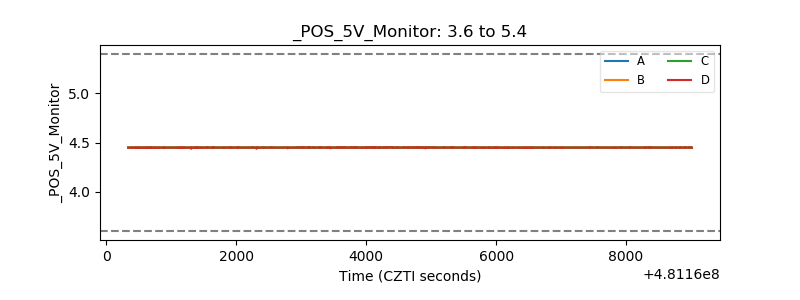 |
| _ROLL_ROT | 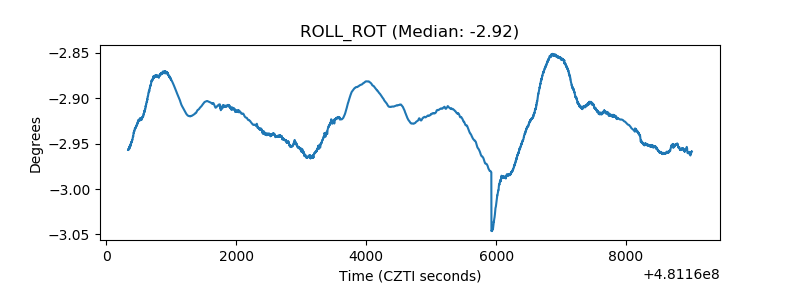 |
| _Roll_DEC | 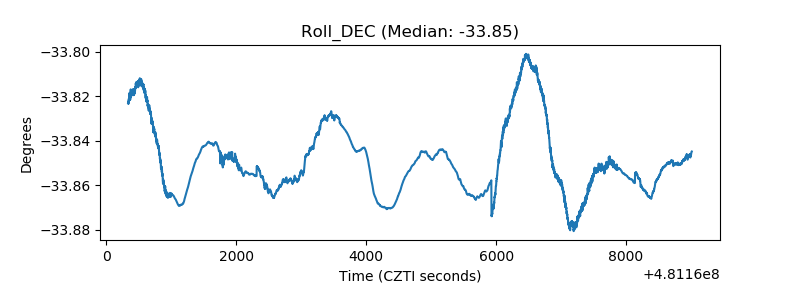 |
| _Roll_RA | 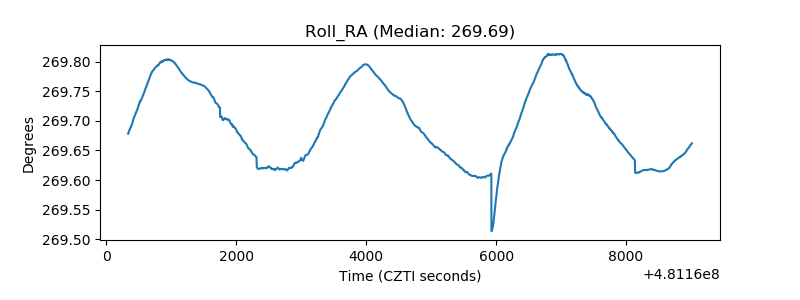 |
| Veto Counter | 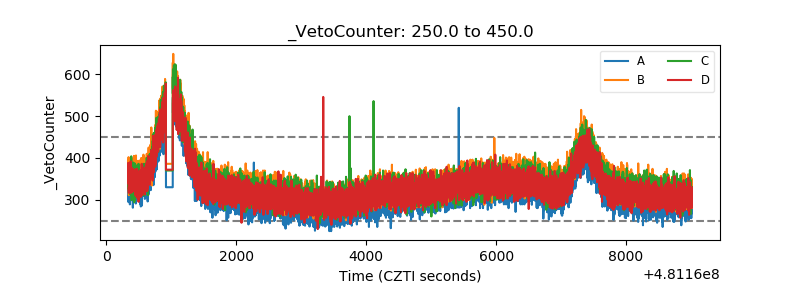 |