| Param | Original file | Final file |
|---|---|---|
| Filename | modeM0/AS1A13_090T01_9000006458_51432cztM0_level2.fits | modeM0/AS1A13_090T01_9000006458_51432cztM0_level2_quad_clean.evt |
| Size (bytes) | 3,585,000,960 | 339,073,920 |
| Size | 3.3 GB | 323.4 MB |
| Events in quadrant A | 29,476,020 | 2,400,235 |
| Events in quadrant B | 17,335,391 | 2,848,419 |
| Events in quadrant C | 60,926,970 | 739,139 |
| Events in quadrant D | 22,708,173 | 2,263,173 |
| Mode M0 | |||
|---|---|---|---|
| Quadrant | BADHDUFLAG | Total packets | Discarded packets |
| A | 0 | 107938 | 2 |
| B | 0 | 72294 | 2 |
| C | 0 | 200955 | 2 |
| D | 0 | 88130 | 2 |
| Mode M9 | |||
|---|---|---|---|
| Quadrant | BADHDUFLAG | Total packets | Discarded packets |
| A | 0 | 10 | 0 |
| B | 0 | 10 | 0 |
| C | 0 | 10 | 0 |
| D | 0 | 10 | 0 |
| Mode SS | |||
|---|---|---|---|
| Quadrant | BADHDUFLAG | Total packets | Discarded packets |
| A | 0 | 590 | 0 |
| B | 0 | 590 | 0 |
| C | 0 | 590 | 0 |
| D | 0 | 590 | 0 |
| Quadrant | Total seconds | Saturated seconds | Saturation percentage |
|---|---|---|---|
| A | 29295 | 3945 | 13.466462% |
| B | 29295 | 1305 | 4.454685% |
| C | 29295 | 21430 | 73.152415% |
| D | 29296 | 2602 | 8.881759% |
Noise dominated data is calculated using 1-second bins in cleaned event files. If a bin has >2000 counts, and if more than 50% of those come from <1% of pixels, then it is considered to be noise-dominated and hence unusable.
| Quadrant | # 1 sec bins | Bins with >0 counts | Bins with >2000 counts | High rate bins dominated by noise | Noise dominated (total time) | Noise dominated (detector-on time) | Marked lightcurve |
|---|---|---|---|---|---|---|---|
| A | 30280 | 29296 | 2828 | 2828 | 9.34% | 9.65% | 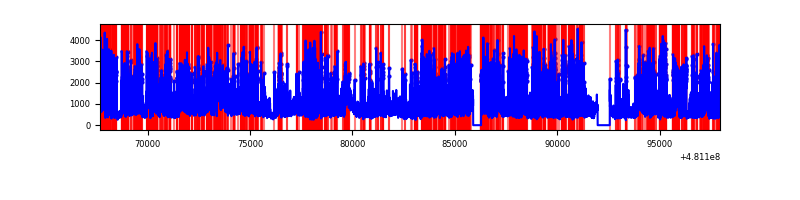 |
| B | 30280 | 29296 | 796 | 796 | 2.63% | 2.72% | 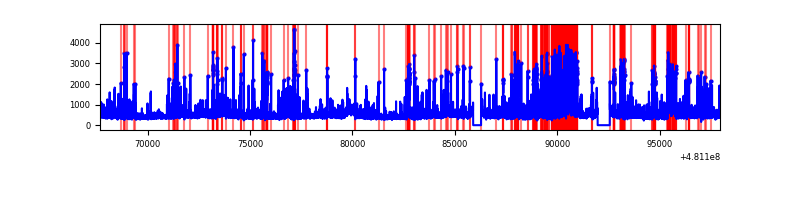 |
| C | 30279 | 29294 | 20173 | 20173 | 66.62% | 68.86% | 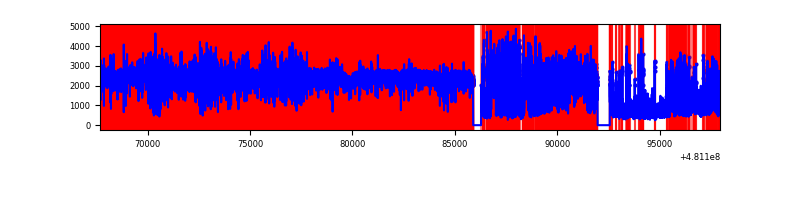 |
| D | 30281 | 29298 | 2307 | 2307 | 7.62% | 7.87% | 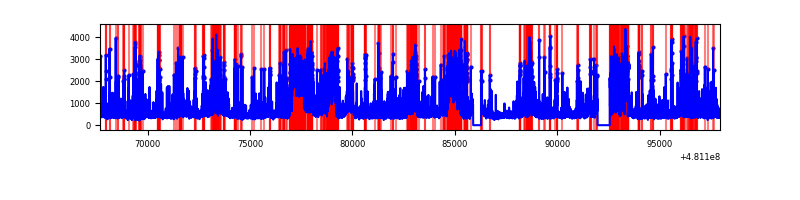 |
Top three noisy pixels from each quadrant. If the there are fewer than three noisy pixels in the level2.evt file, extra rows are filled as -1
| Pixel properties | Quadrant properties | ||||||
|---|---|---|---|---|---|---|---|
| Quadrant | DetID | PixID | Counts | Sigma | Mean | Median | Sigma |
| A | 12 | 250 | 5055889 | 6925.89 | 2955 | 2884 | 729.6 |
| A | 7 | 64 | 4473507 | 6127.65 | 2955 | 2884 | 729.6 |
| A | 12 | 3 | 3833686 | 5250.68 | 2955 | 2884 | 729.6 |
| B | 12 | 18 | 1207156 | 1843.09 | 3045 | 2931 | 653.4 |
| B | 15 | 52 | 774736 | 1181.26 | 3045 | 2931 | 653.4 |
| B | 5 | 185 | 531682 | 809.26 | 3045 | 2931 | 653.4 |
| C | 15 | 179 | 30760655 | 71157.45 | 1562 | 1551 | 432.3 |
| C | 4 | 12 | 19055572 | 44079.16 | 1562 | 1551 | 432.3 |
| C | 10 | 171 | 1484414 | 3430.42 | 1562 | 1551 | 432.3 |
| D | 7 | 60 | 4028452 | 5024.27 | 2903 | 2813 | 801.2 |
| D | 6 | 42 | 1973096 | 2459.05 | 2903 | 2813 | 801.2 |
| D | 3 | 12 | 1335088 | 1662.77 | 2903 | 2813 | 801.2 |
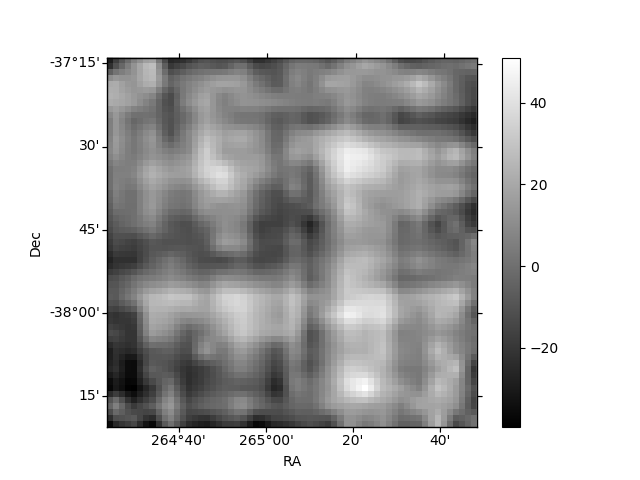
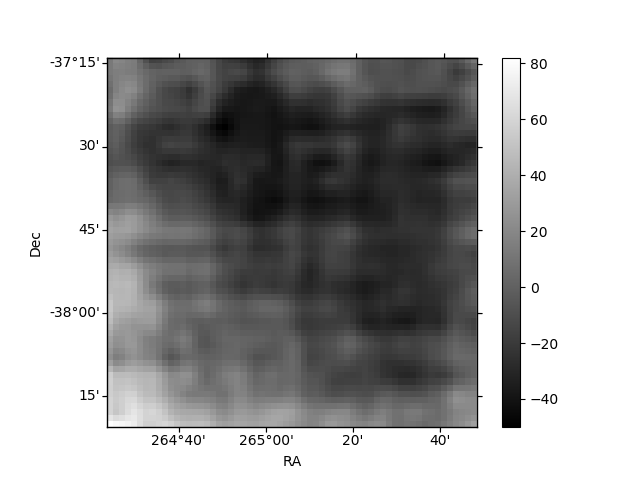
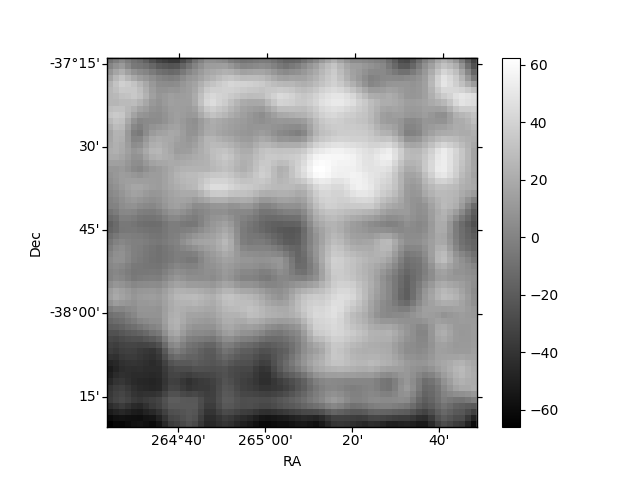
Histogram calculated using DETX and DETY for each event in the final _common_clean file
| Quadrant A | 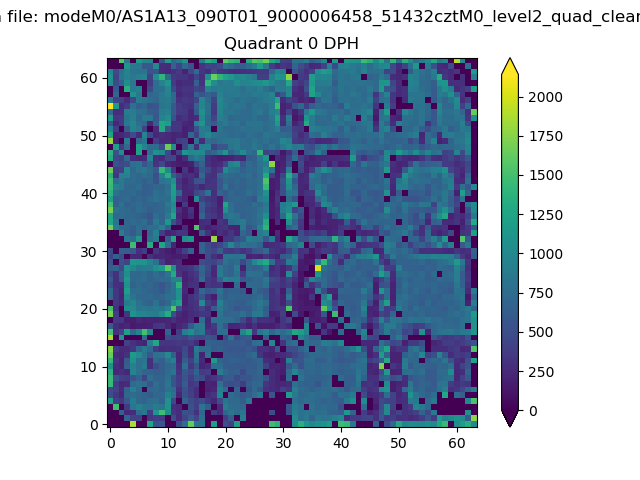 |
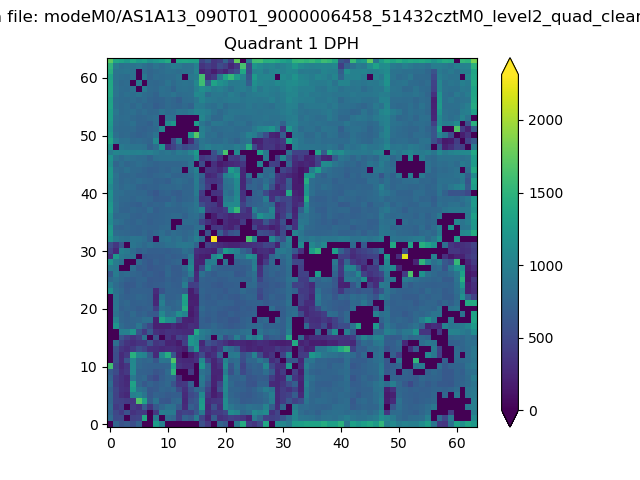 |
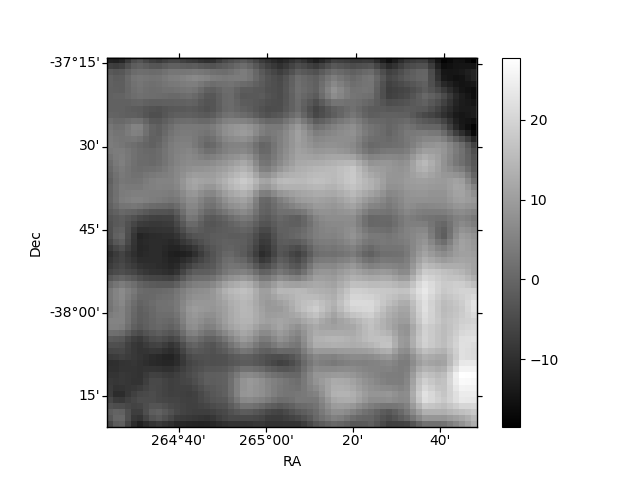
Quadrant B |
|---|---|---|---|
| Quadrant D | 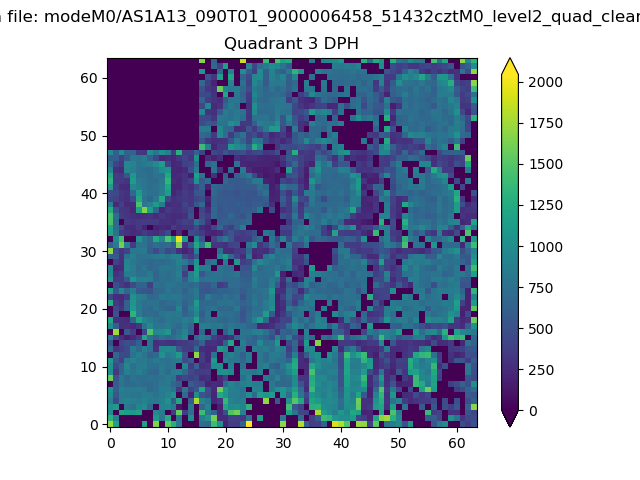 |
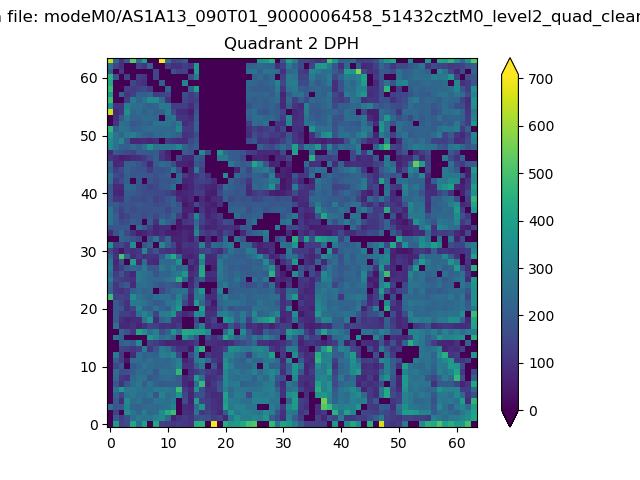 |
Quadrant C |
| Plot type | Count rate plots | Images |
|---|---|---|
| Comparison with Poisson distribution Blue bars denote a histogram of data divided into 1 sec bins. Red curve is a Poisson curve with rate = median count rate of data. |
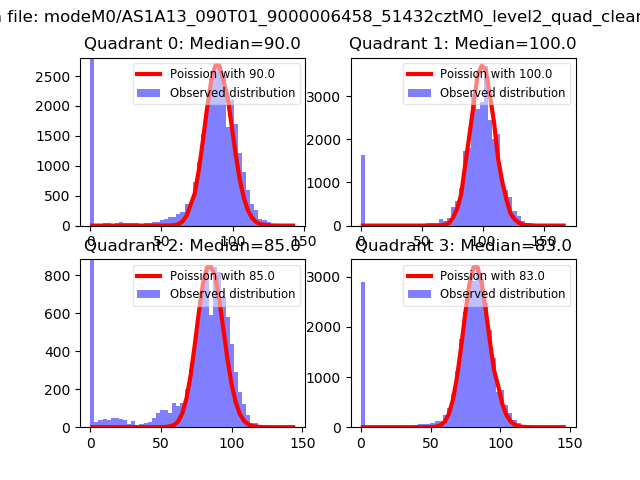 |
 |
| Quadrant-wise count rates Data is divided into 100 sec bins |
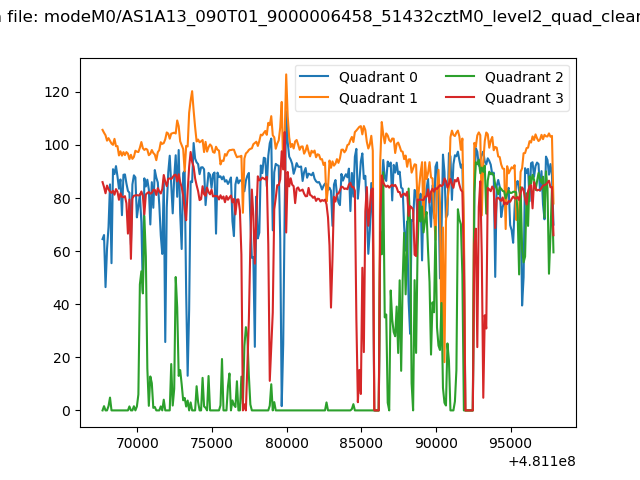 |
|
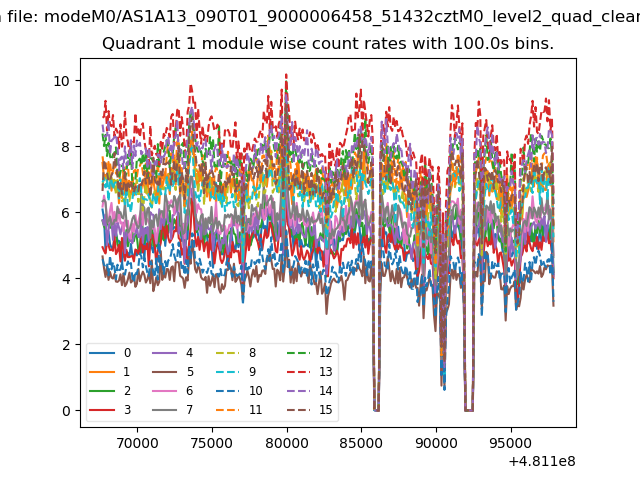
| Module-wise count rates for Quadrant A Data is divided into 100 sec bins |
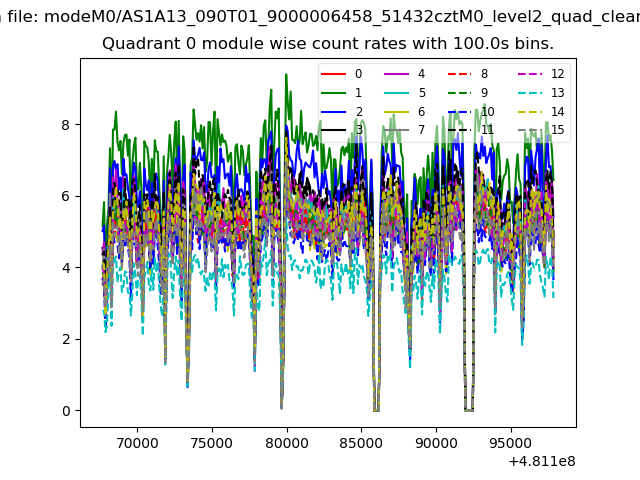 |
 |
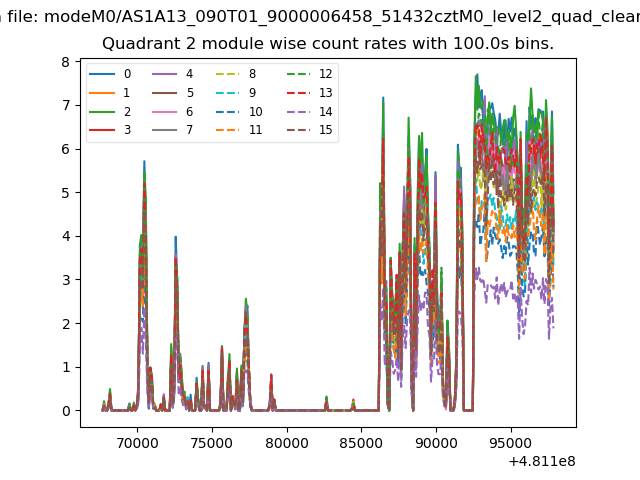
| Module-wise count rates for Quadrant B Data is divided into 100 sec bins |
 |
 |
| Module-wise count rates for Quadrant C Data is divided into 100 sec bins |
 |
 |
| Module-wise count rates for Quadrant D Data is divided into 100 sec bins |
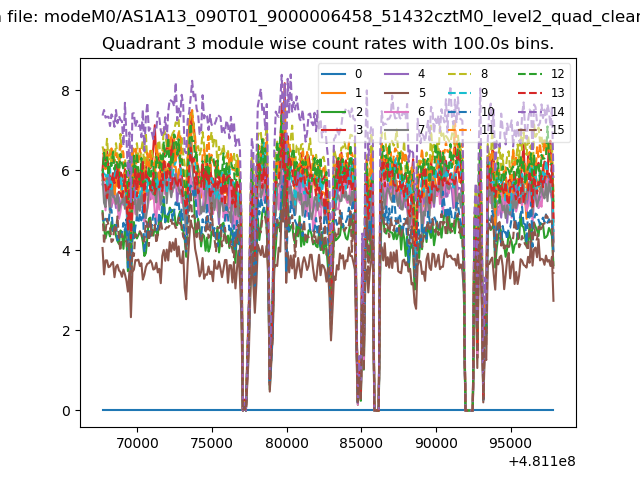 |
 |
| Parameter | Plot |
|---|---|
| CZT HV Monitor | 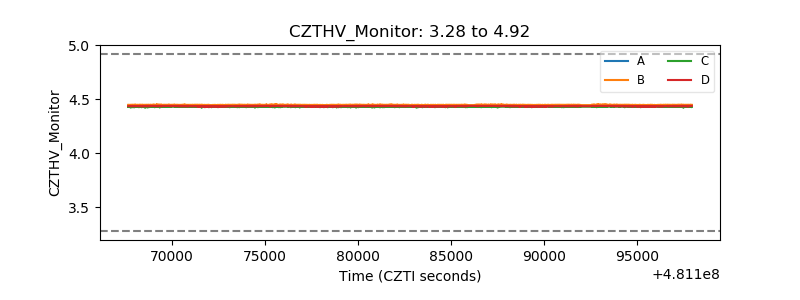 |
| D_VDD | 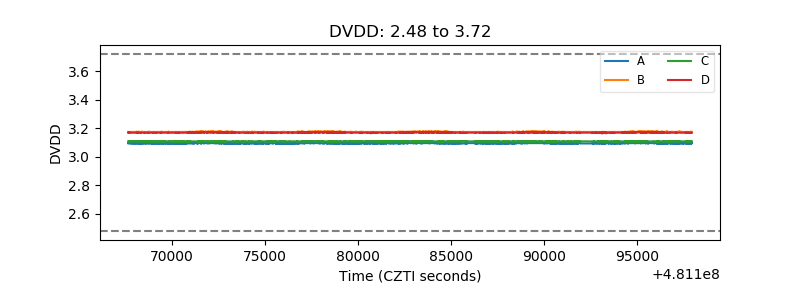 |
| Temperature 1 | 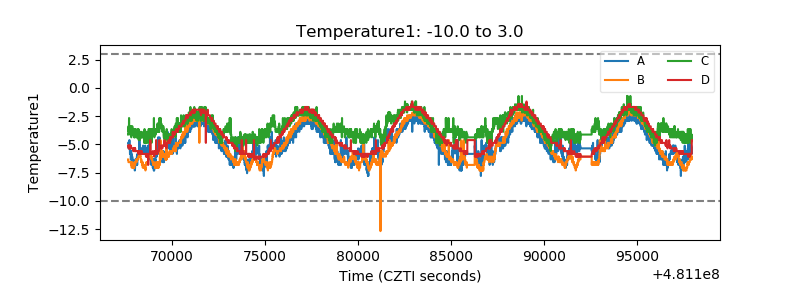 |
| Veto HV Monitor |  |
| Veto LLD | 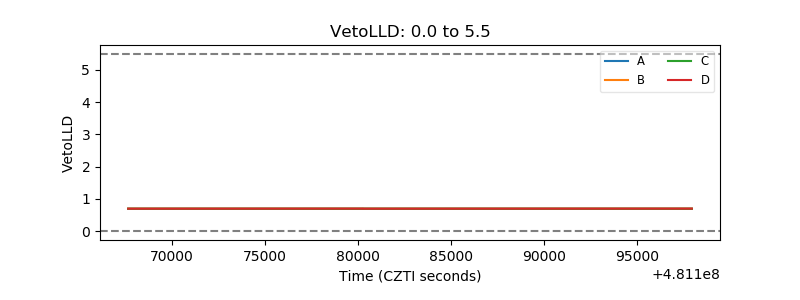 |
| Alpha Counter | 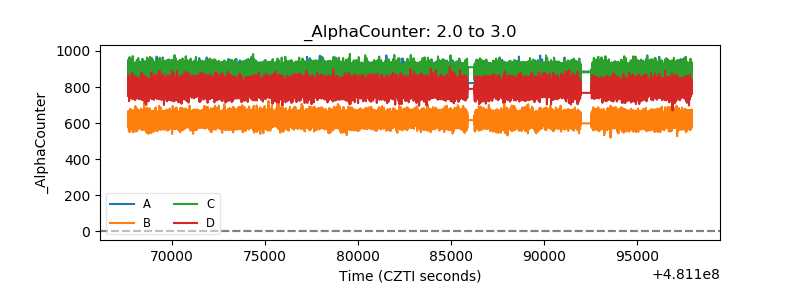 |
| _CPM_Rate | 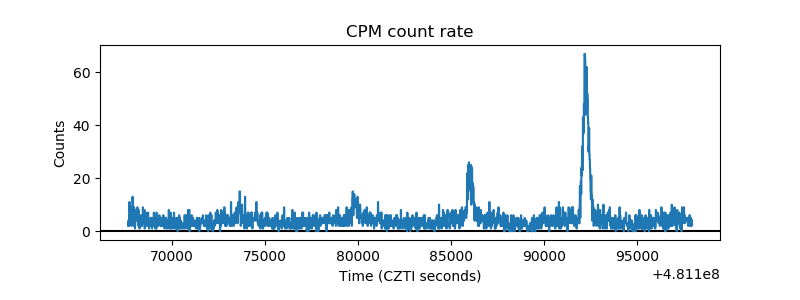 |
| CZT Counter | 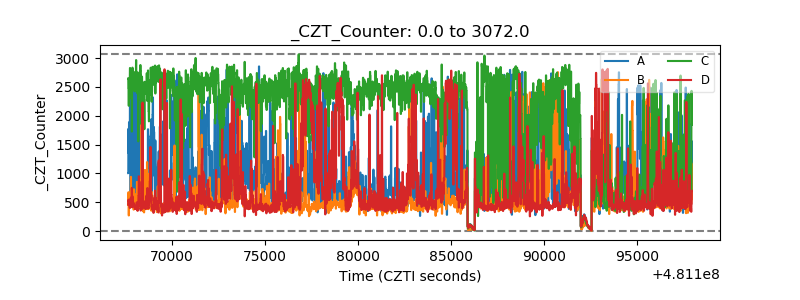 |
| +2.5 Volts monitor | 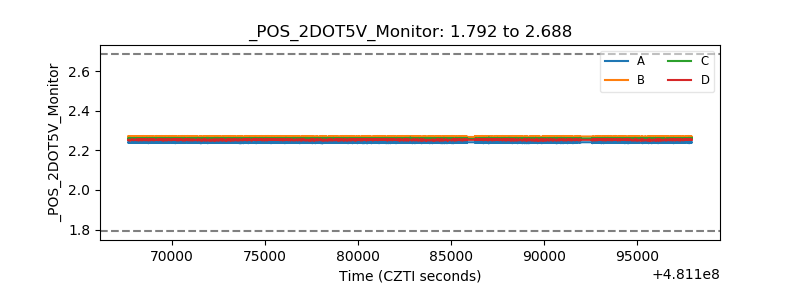 |
| +5 Volts monitor | 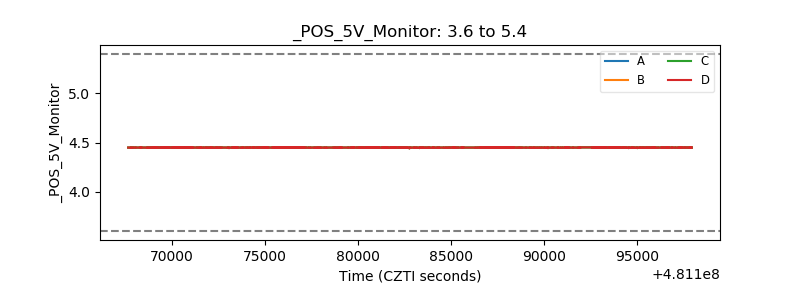 |
| _ROLL_ROT | 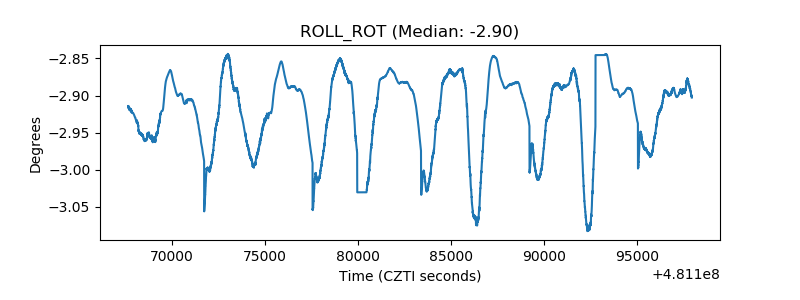 |
| _Roll_DEC | 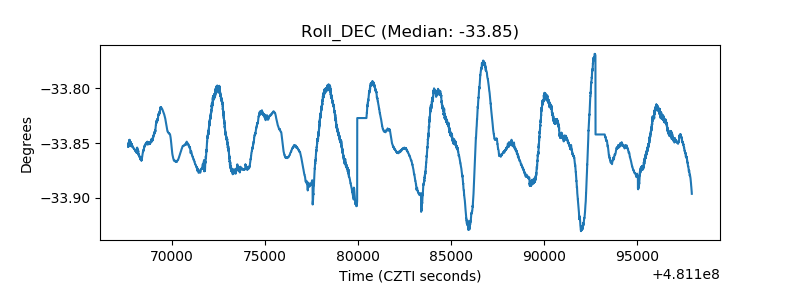 |
| _Roll_RA | 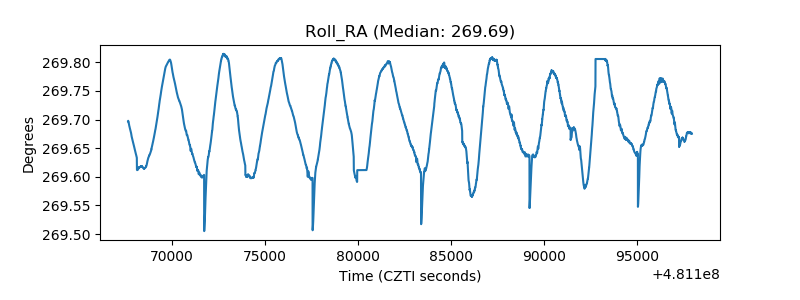 |
| Veto Counter | 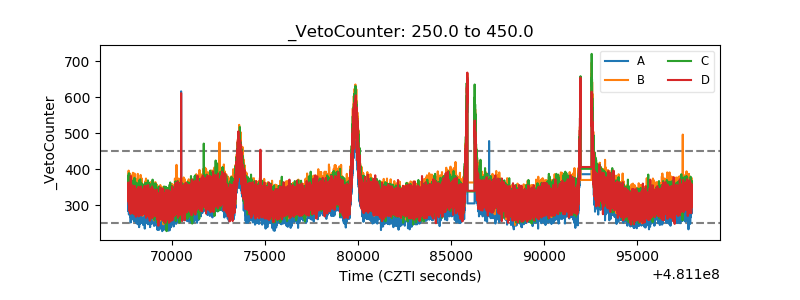 |