| Param | Original file | Final file |
|---|---|---|
| Filename | modeM0/AS1A13_090T01_9000006458_51434cztM0_level2.fits | modeM0/AS1A13_090T01_9000006458_51434cztM0_level2_quad_clean.evt |
| Size (bytes) | 769,939,200 | 91,209,600 |
| Size | 734.3 MB | 87.0 MB |
| Events in quadrant A | 8,138,590 | 552,143 |
| Events in quadrant B | 4,249,759 | 704,212 |
| Events in quadrant C | 10,944,269 | 412,832 |
| Events in quadrant D | 4,615,104 | 595,254 |
| Mode M0 | |||
|---|---|---|---|
| Quadrant | BADHDUFLAG | Total packets | Discarded packets |
| A | 0 | 29191 | 2 |
| B | 0 | 17547 | 2 |
| C | 0 | 37451 | 2 |
| D | 0 | 18640 | 3 |
| Mode M9 | |||
|---|---|---|---|
| Quadrant | BADHDUFLAG | Total packets | Discarded packets |
| A | 0 | 18 | 0 |
| B | 0 | 18 | 0 |
| C | 0 | 18 | 0 |
| D | 0 | 18 | 0 |
| Mode SS | |||
|---|---|---|---|
| Quadrant | BADHDUFLAG | Total packets | Discarded packets |
| A | 0 | 146 | 0 |
| B | 0 | 146 | 0 |
| C | 0 | 146 | 0 |
| D | 0 | 146 | 0 |
| Quadrant | Total seconds | Saturated seconds | Saturation percentage |
|---|---|---|---|
| A | 7136 | 1493 | 20.922085% |
| B | 7137 | 338 | 4.735883% |
| C | 7137 | 2904 | 40.689365% |
| D | 7136 | 292 | 4.091928% |
Noise dominated data is calculated using 1-second bins in cleaned event files. If a bin has >2000 counts, and if more than 50% of those come from <1% of pixels, then it is considered to be noise-dominated and hence unusable.
| Quadrant | # 1 sec bins | Bins with >0 counts | Bins with >2000 counts | High rate bins dominated by noise | Noise dominated (total time) | Noise dominated (detector-on time) | Marked lightcurve |
|---|---|---|---|---|---|---|---|
| A | 8856 | 7136 | 1096 | 1096 | 12.38% | 15.36% | 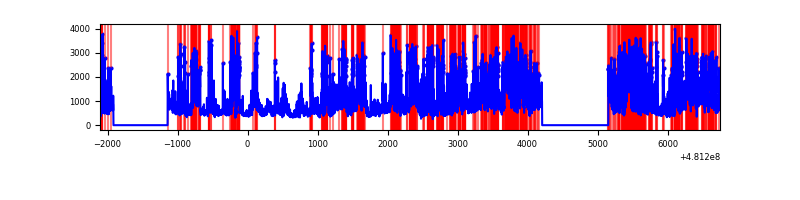 |
| B | 8857 | 7137 | 112 | 112 | 1.26% | 1.57% | 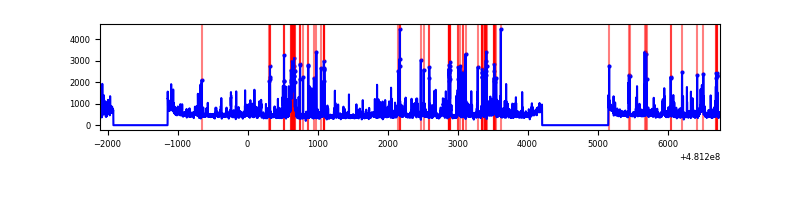 |
| C | 8857 | 7137 | 2550 | 2550 | 28.79% | 35.73% | 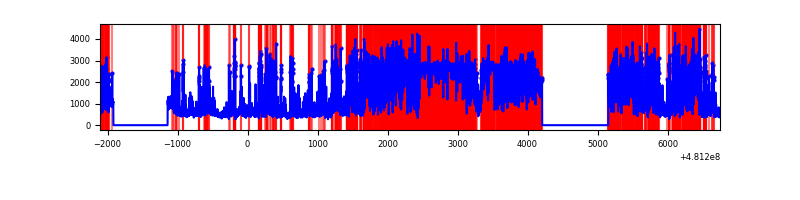 |
| D | 8856 | 7136 | 148 | 148 | 1.67% | 2.07% | 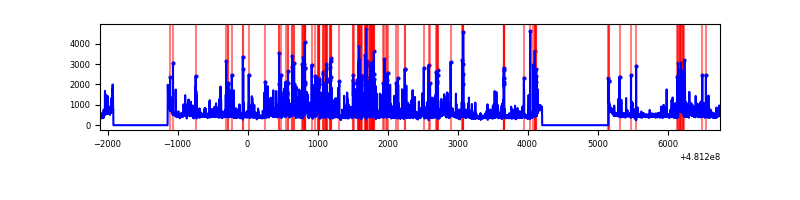 |
Top three noisy pixels from each quadrant. If the there are fewer than three noisy pixels in the level2.evt file, extra rows are filled as -1
| Pixel properties | Quadrant properties | ||||||
|---|---|---|---|---|---|---|---|
| Quadrant | DetID | PixID | Counts | Sigma | Mean | Median | Sigma |
| A | 7 | 64 | 2055402 | 11715.68 | 717 | 698 | 175.4 |
| A | 12 | 3 | 1031839 | 5879.45 | 717 | 698 | 175.4 |
| A | 12 | 250 | 851839 | 4853.11 | 717 | 698 | 175.4 |
| B | 4 | 206 | 437886 | 2635.62 | 768 | 739 | 165.9 |
| B | 6 | 51 | 127933 | 766.87 | 768 | 739 | 165.9 |
| B | 15 | 52 | 118660 | 710.96 | 768 | 739 | 165.9 |
| C | 4 | 12 | 4797198 | 29149.72 | 601 | 598 | 164.6 |
| C | 0 | 176 | 1228319 | 7461.06 | 601 | 598 | 164.6 |
| C | 15 | 179 | 958441 | 5820.97 | 601 | 598 | 164.6 |
| D | 8 | 176 | 400680 | 1890.19 | 756 | 730 | 211.6 |
| D | 7 | 96 | 354576 | 1672.3 | 756 | 730 | 211.6 |
| D | 3 | 12 | 319940 | 1508.6 | 756 | 730 | 211.6 |
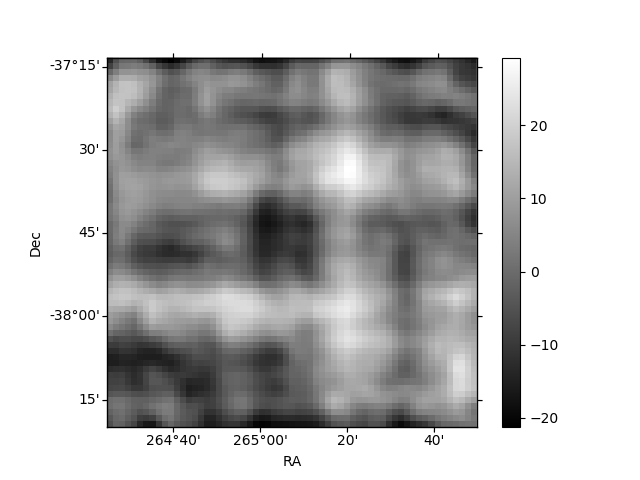
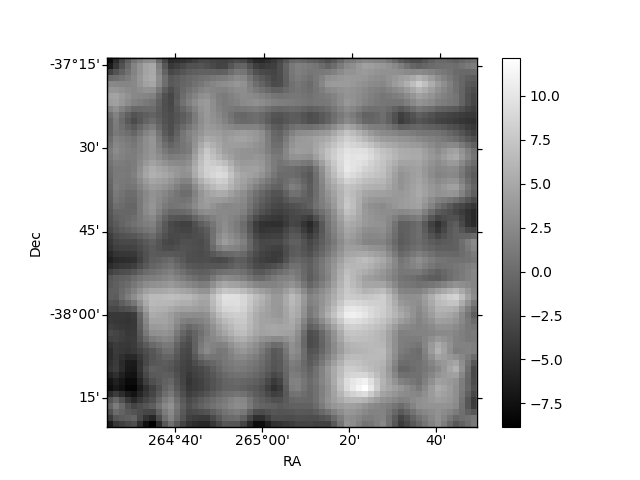
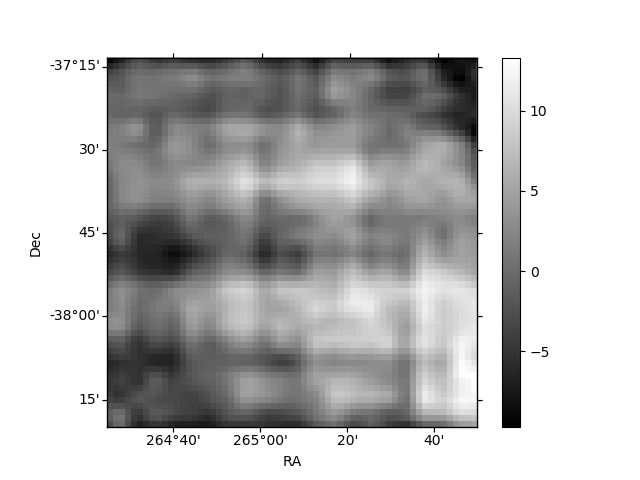
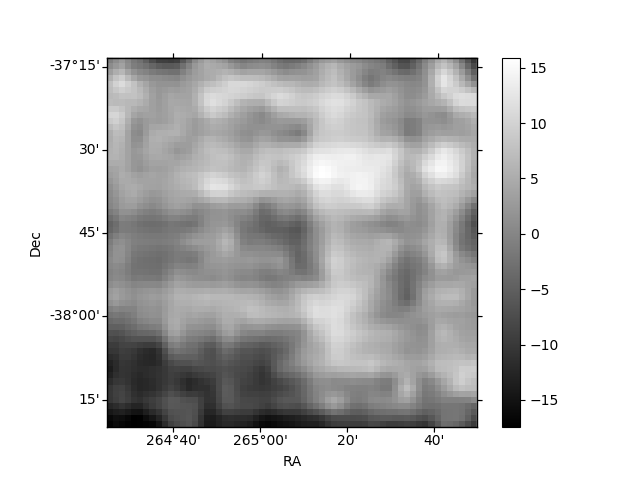
Histogram calculated using DETX and DETY for each event in the final _common_clean file
| Quadrant A | 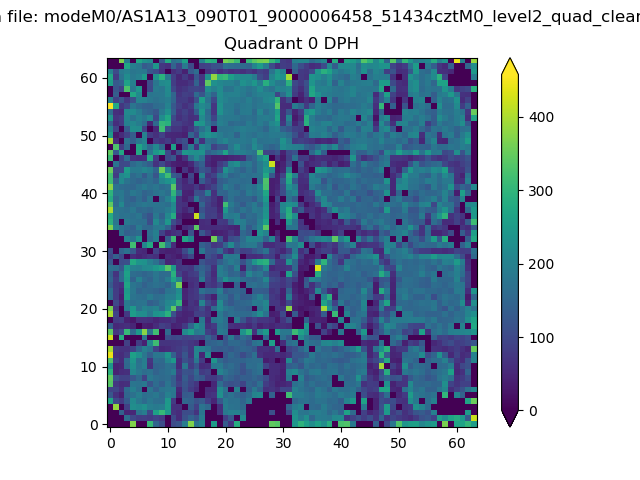 |
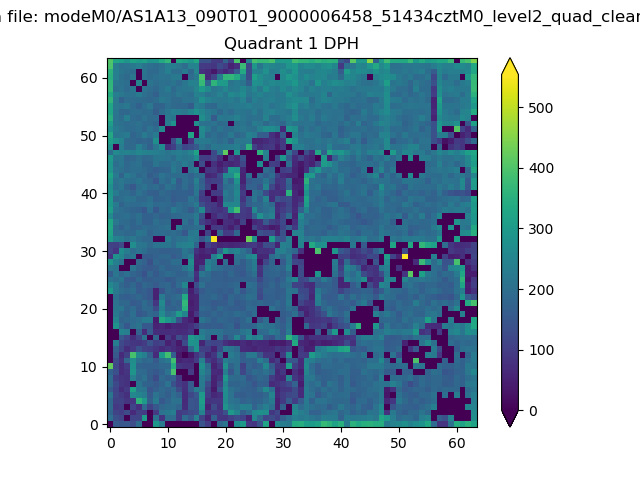 |
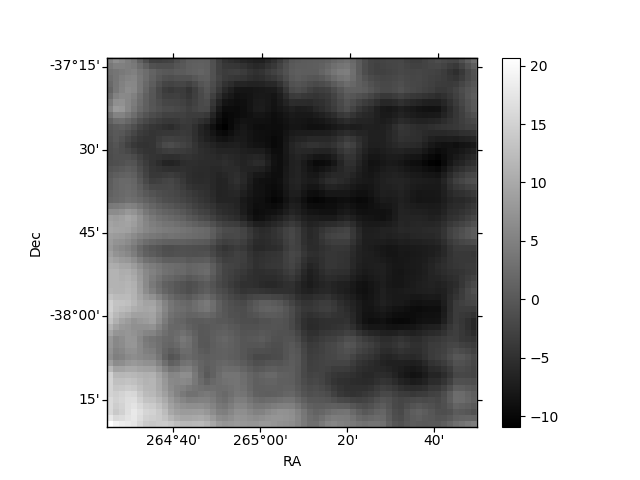
Quadrant B |
|---|---|---|---|
| Quadrant D | 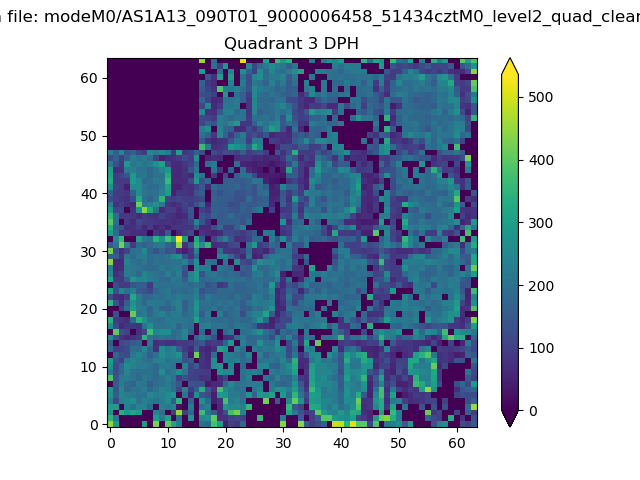 |
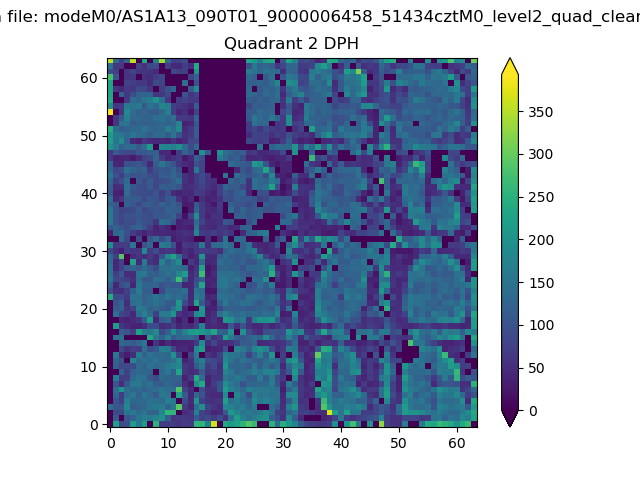 |
Quadrant C |
| Plot type | Count rate plots | Images |
|---|---|---|
| Comparison with Poisson distribution Blue bars denote a histogram of data divided into 1 sec bins. Red curve is a Poisson curve with rate = median count rate of data. |
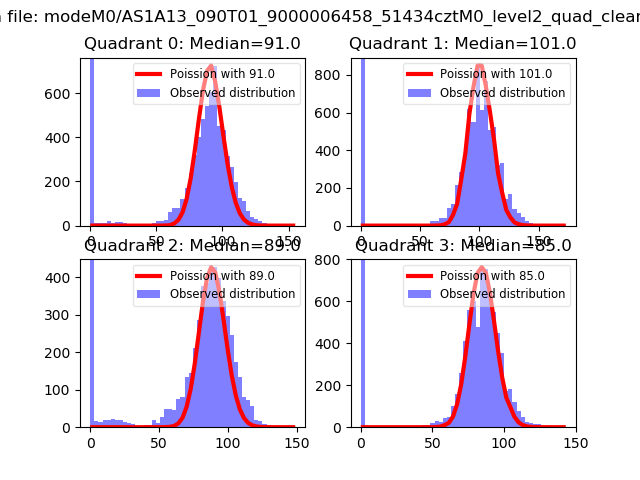 |
 |
| Quadrant-wise count rates Data is divided into 100 sec bins |
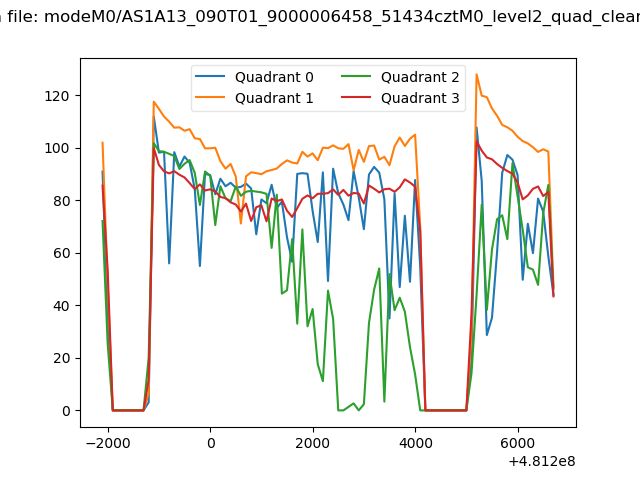 |
|
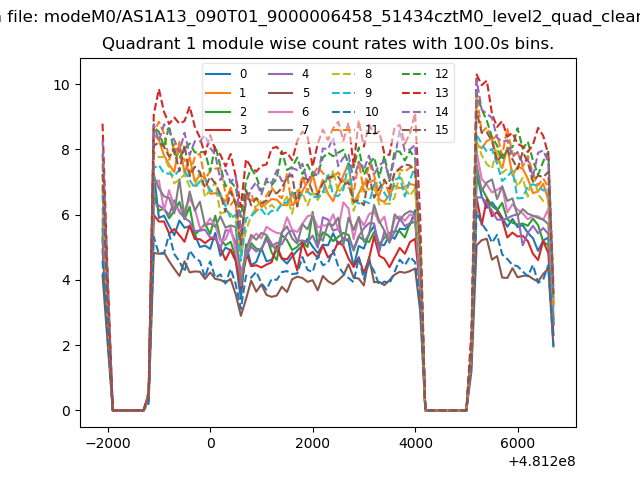
| Module-wise count rates for Quadrant A Data is divided into 100 sec bins |
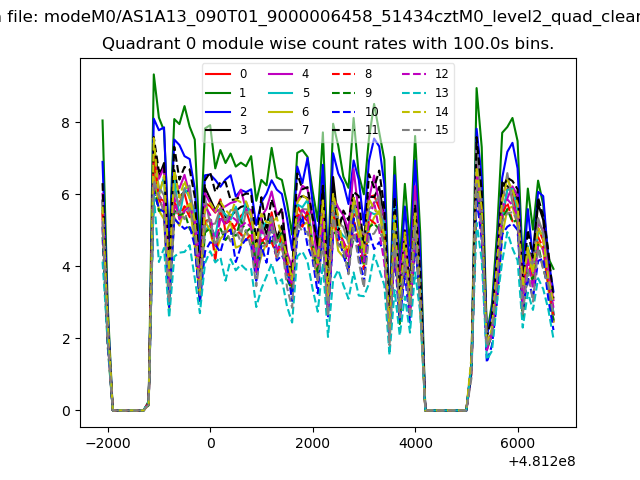 |
 |
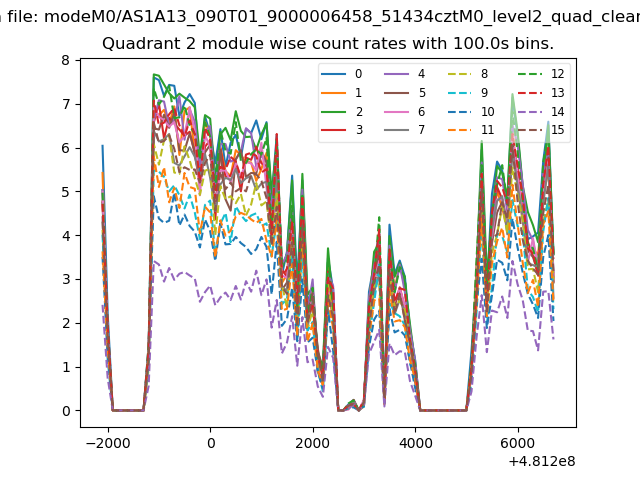
| Module-wise count rates for Quadrant B Data is divided into 100 sec bins |
 |
 |
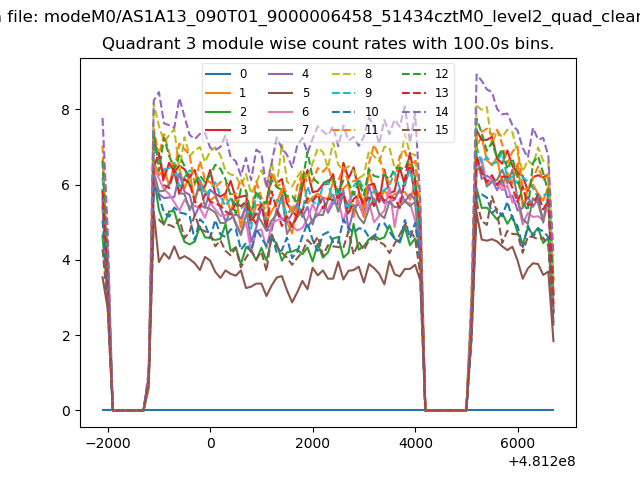
| Module-wise count rates for Quadrant C Data is divided into 100 sec bins |
 |
 |
| Module-wise count rates for Quadrant D Data is divided into 100 sec bins |
 |
 |
| Parameter | Plot |
|---|---|
| CZT HV Monitor | 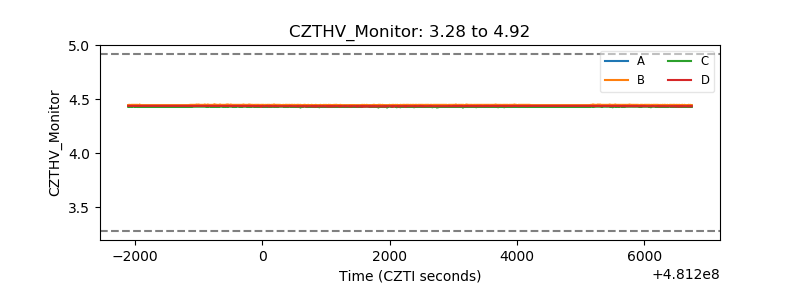 |
| D_VDD | 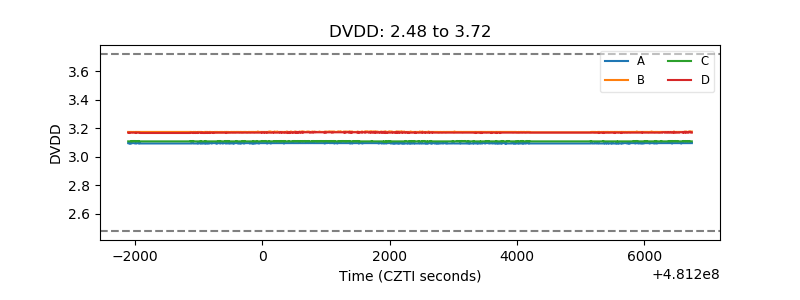 |
| Temperature 1 | 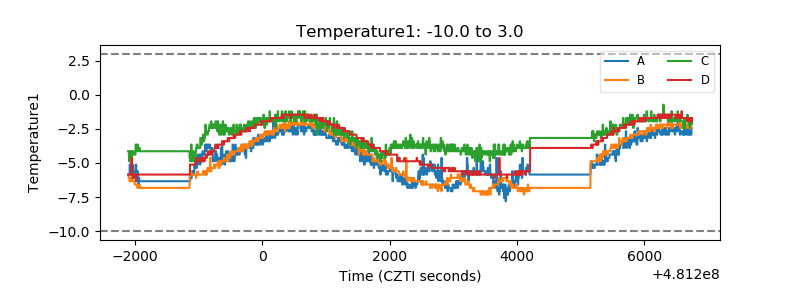 |
| Veto HV Monitor | 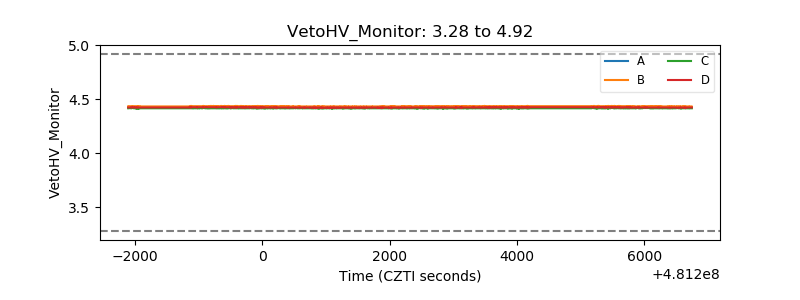 |
| Veto LLD | 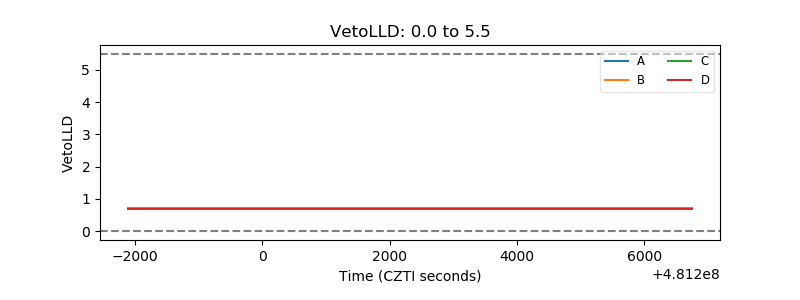 |
| Alpha Counter | 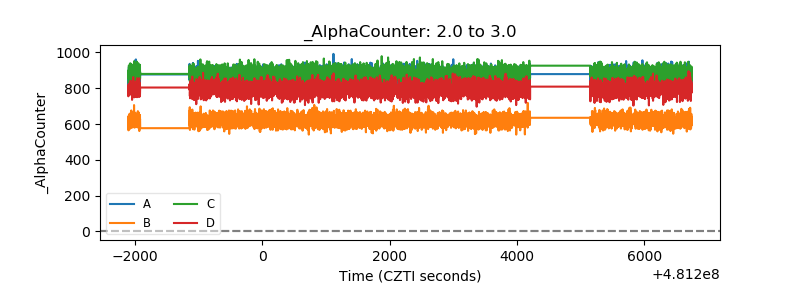 |
| _CPM_Rate | 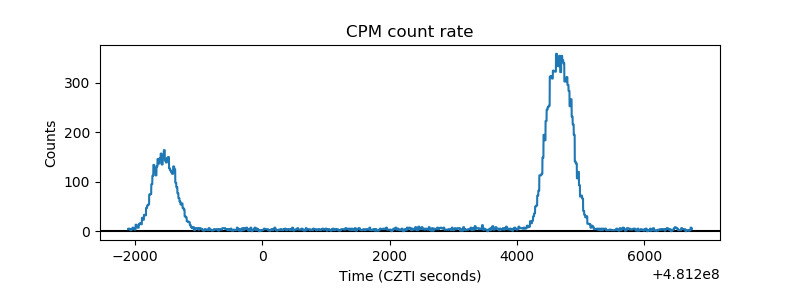 |
| CZT Counter | 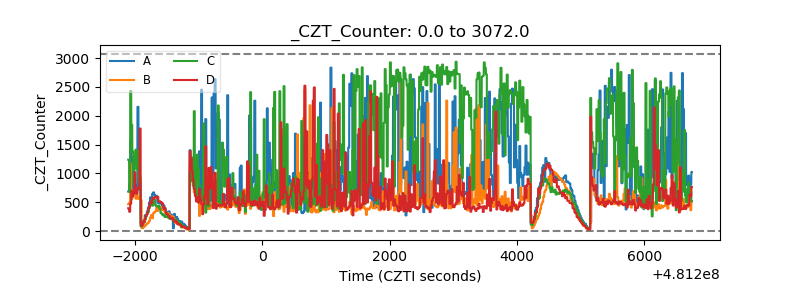 |
| +2.5 Volts monitor | 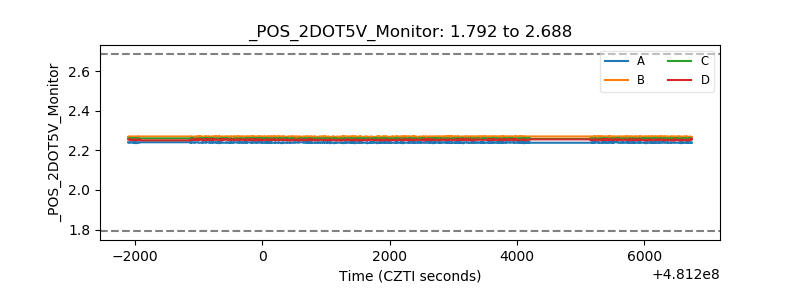 |
| +5 Volts monitor | 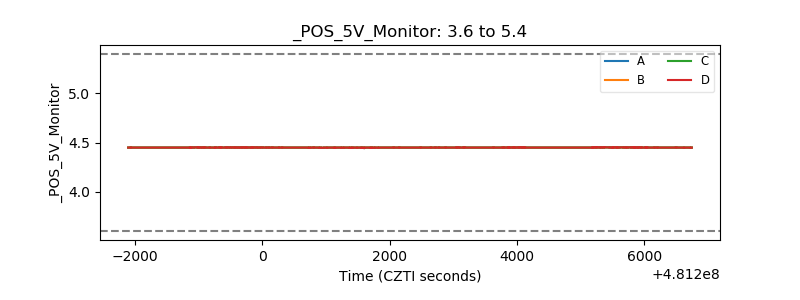 |
| _ROLL_ROT | 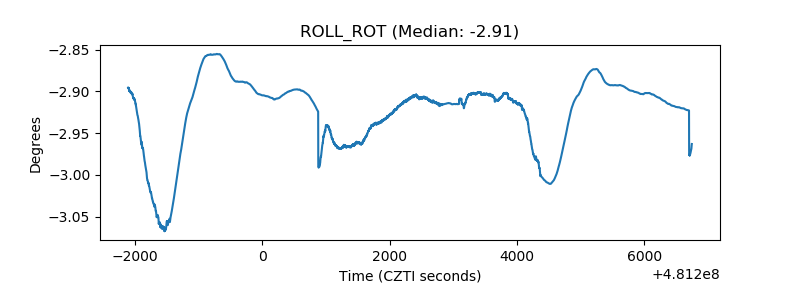 |
| _Roll_DEC | 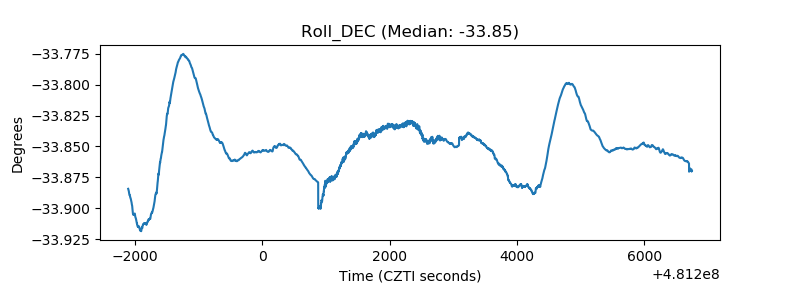 |
| _Roll_RA | 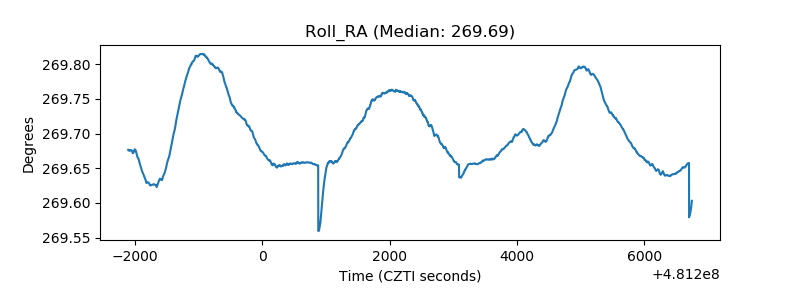 |
| Veto Counter | 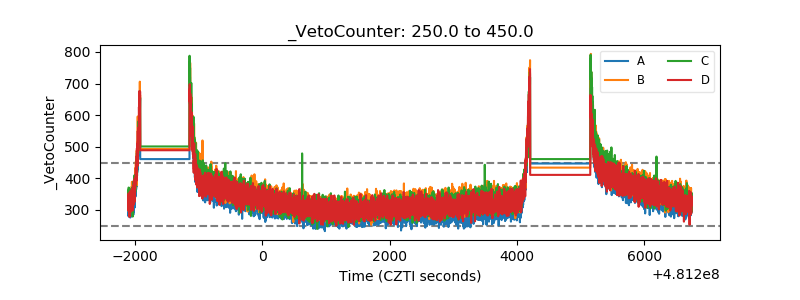 |