| Param | Original file | Final file |
|---|---|---|
| Filename | modeM0/AS1A13_090T01_9000006458_51435cztM0_level2.fits | modeM0/AS1A13_090T01_9000006458_51435cztM0_level2_quad_clean.evt |
| Size (bytes) | 728,835,840 | 79,632,000 |
| Size | 695.1 MB | 75.9 MB |
| Events in quadrant A | 7,112,280 | 494,992 |
| Events in quadrant B | 3,783,914 | 613,454 |
| Events in quadrant C | 10,927,745 | 336,761 |
| Events in quadrant D | 4,667,400 | 526,303 |
| Mode M0 | |||
|---|---|---|---|
| Quadrant | BADHDUFLAG | Total packets | Discarded packets |
| A | 0 | 25414 | 1 |
| B | 0 | 15567 | 1 |
| C | 0 | 36807 | 4 |
| D | 0 | 18241 | 1 |
| Mode M9 | |||
|---|---|---|---|
| Quadrant | BADHDUFLAG | Total packets | Discarded packets |
| A | 0 | 10 | 0 |
| B | 0 | 10 | 0 |
| C | 0 | 10 | 0 |
| D | 0 | 10 | 0 |
| Mode SS | |||
|---|---|---|---|
| Quadrant | BADHDUFLAG | Total packets | Discarded packets |
| A | 0 | 128 | 0 |
| B | 0 | 128 | 0 |
| C | 0 | 128 | 0 |
| D | 0 | 128 | 0 |
| Quadrant | Total seconds | Saturated seconds | Saturation percentage |
|---|---|---|---|
| A | 6295 | 1345 | 21.366164% |
| B | 6296 | 403 | 6.400889% |
| C | 6295 | 2978 | 47.307387% |
| D | 6295 | 377 | 5.988880% |
Noise dominated data is calculated using 1-second bins in cleaned event files. If a bin has >2000 counts, and if more than 50% of those come from <1% of pixels, then it is considered to be noise-dominated and hence unusable.
| Quadrant | # 1 sec bins | Bins with >0 counts | Bins with >2000 counts | High rate bins dominated by noise | Noise dominated (total time) | Noise dominated (detector-on time) | Marked lightcurve |
|---|---|---|---|---|---|---|---|
| A | 7370 | 6295 | 1144 | 1144 | 15.52% | 18.17% | 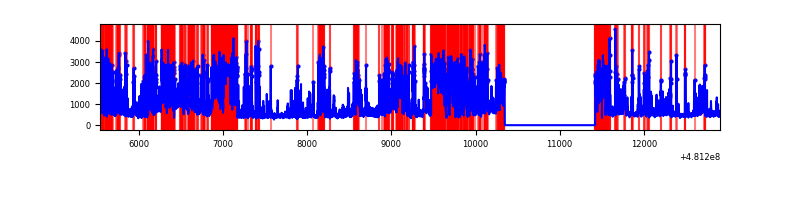 |
| B | 7371 | 6296 | 167 | 167 | 2.27% | 2.65% | 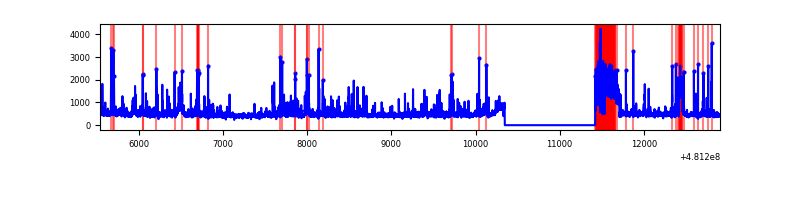 |
| C | 7370 | 6295 | 2768 | 2768 | 37.56% | 43.97% | 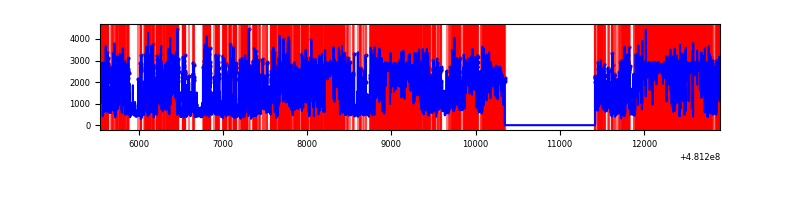 |
| D | 7370 | 6295 | 328 | 328 | 4.45% | 5.21% | 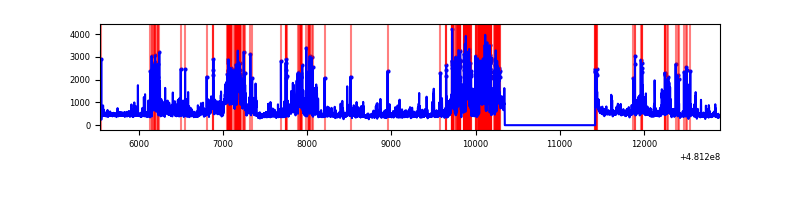 |
Top three noisy pixels from each quadrant. If the there are fewer than three noisy pixels in the level2.evt file, extra rows are filled as -1
| Pixel properties | Quadrant properties | ||||||
|---|---|---|---|---|---|---|---|
| Quadrant | DetID | PixID | Counts | Sigma | Mean | Median | Sigma |
| A | 7 | 64 | 3170705 | 21121.12 | 609 | 593 | 150.1 |
| A | 12 | 250 | 732755 | 4878.09 | 609 | 593 | 150.1 |
| A | 12 | 3 | 246160 | 1636.11 | 609 | 593 | 150.1 |
| B | 5 | 172 | 495737 | 3591.54 | 647 | 625 | 137.9 |
| B | 4 | 206 | 119013 | 858.79 | 647 | 625 | 137.9 |
| B | 15 | 52 | 95476 | 688.05 | 647 | 625 | 137.9 |
| C | 4 | 12 | 5840052 | 43879.12 | 485 | 481 | 133.1 |
| C | 0 | 176 | 1330737 | 9995.68 | 485 | 481 | 133.1 |
| C | 10 | 171 | 598921 | 4496.74 | 485 | 481 | 133.1 |
| D | 6 | 42 | 780893 | 4266.46 | 650 | 625 | 182.9 |
| D | 8 | 176 | 391712 | 2138.44 | 650 | 625 | 182.9 |
| D | 8 | 192 | 281461 | 1535.59 | 650 | 625 | 182.9 |
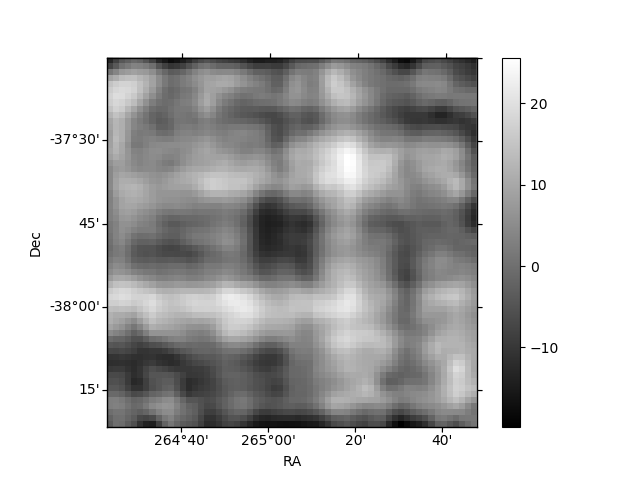
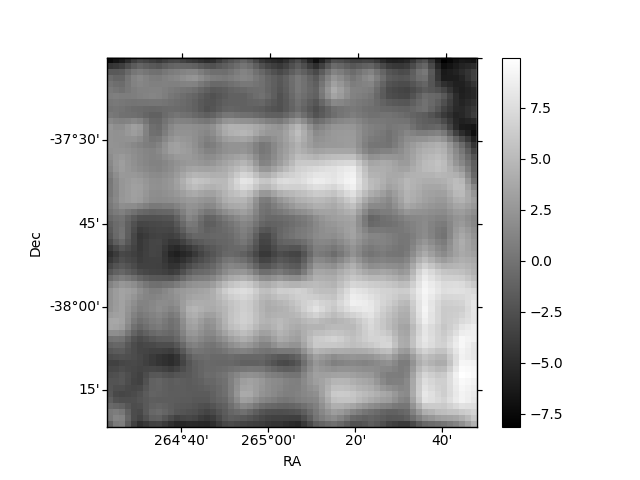
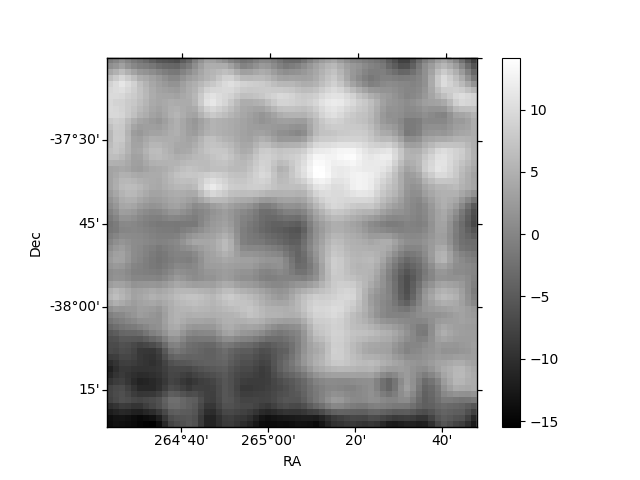
Histogram calculated using DETX and DETY for each event in the final _common_clean file
| Quadrant A | 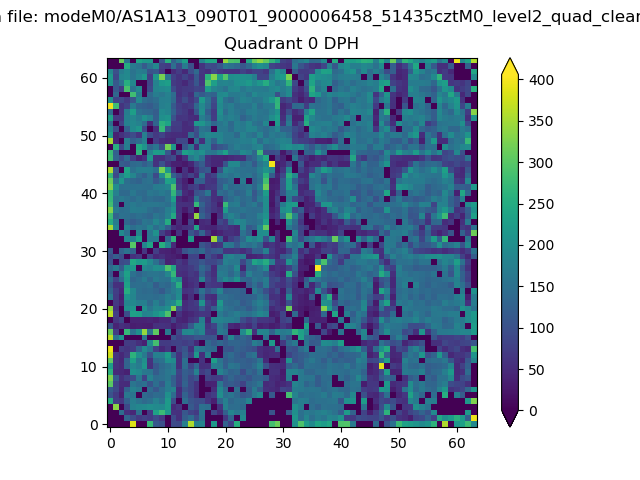 |
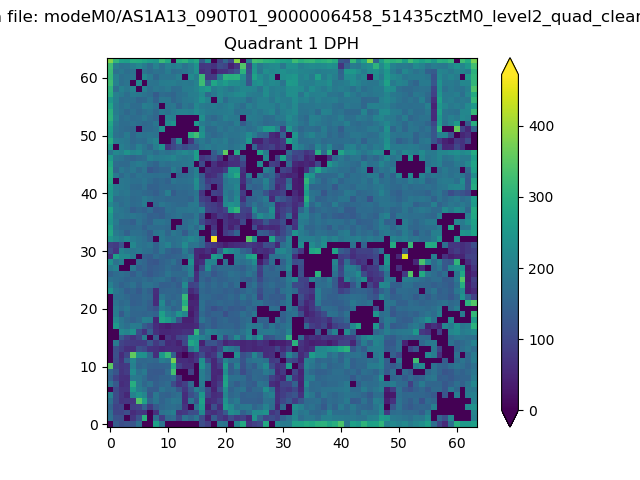 |
Quadrant B |
|---|---|---|---|
| Quadrant D | 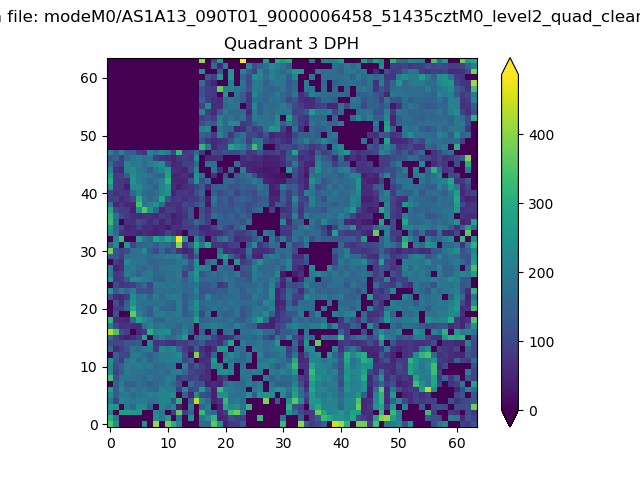 |
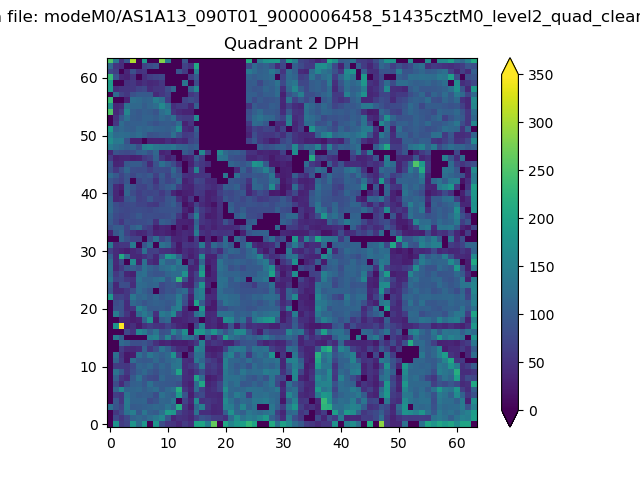 |
Quadrant C |
| Plot type | Count rate plots | Images |
|---|---|---|
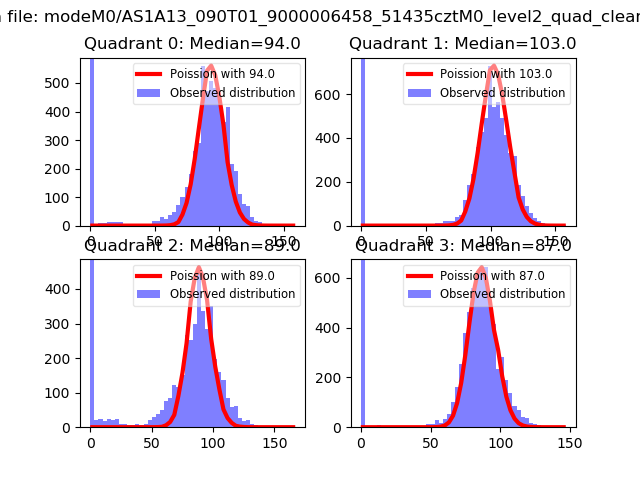
| Comparison with Poisson distribution Blue bars denote a histogram of data divided into 1 sec bins. Red curve is a Poisson curve with rate = median count rate of data. |
 |
 |
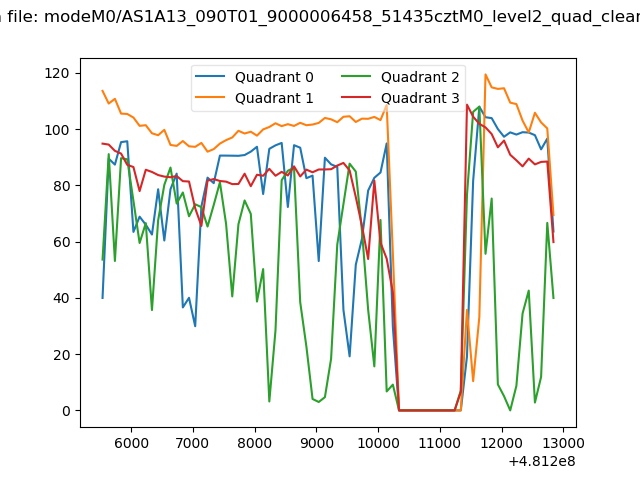
| Quadrant-wise count rates Data is divided into 100 sec bins |
 |
|
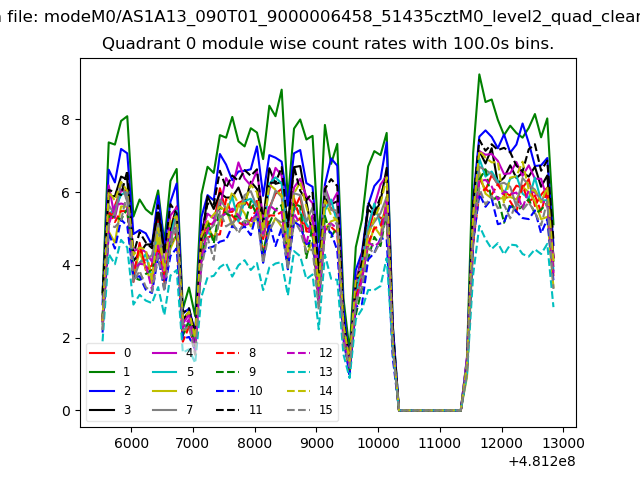
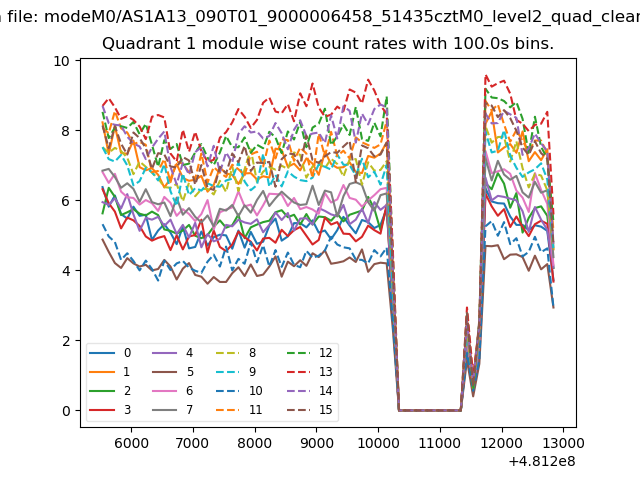
| Module-wise count rates for Quadrant A Data is divided into 100 sec bins |
 |
 |
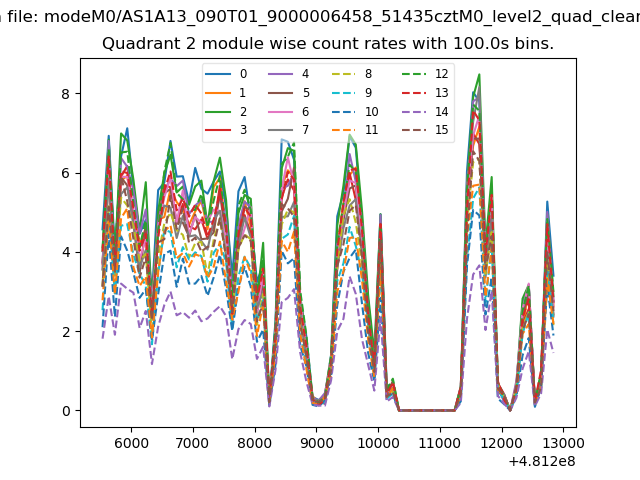
| Module-wise count rates for Quadrant B Data is divided into 100 sec bins |
 |
 |
| Module-wise count rates for Quadrant C Data is divided into 100 sec bins |
 |
 |
| Module-wise count rates for Quadrant D Data is divided into 100 sec bins |
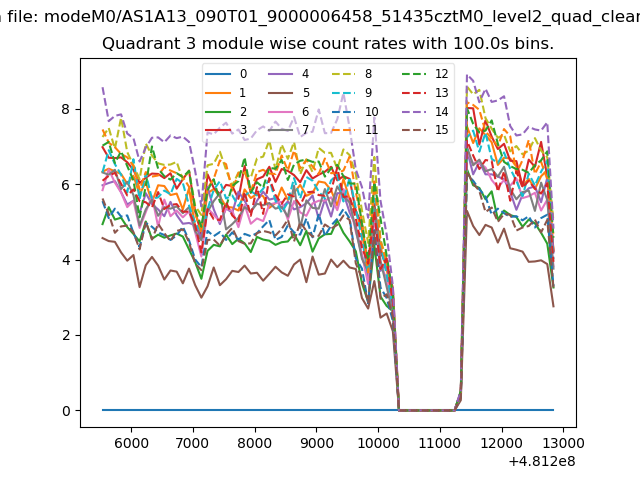 |
 |
| Parameter | Plot |
|---|---|
| CZT HV Monitor | 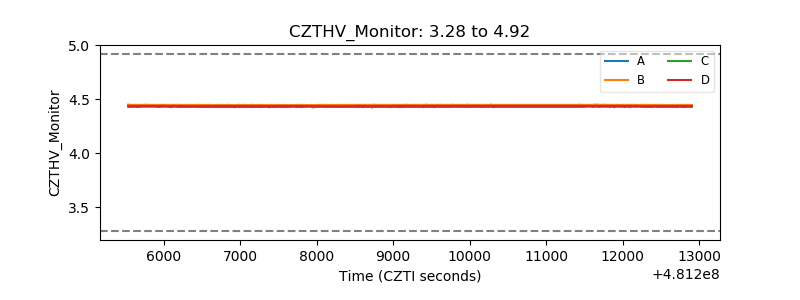 |
| D_VDD | 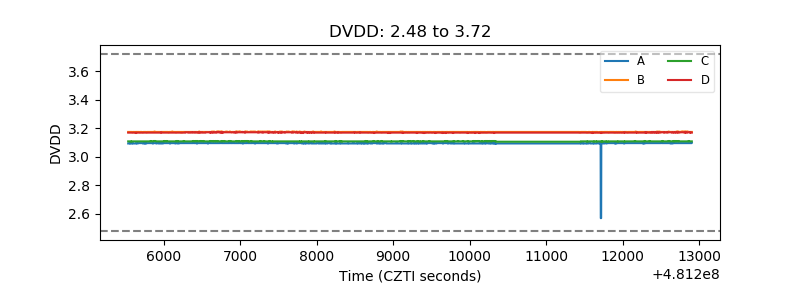 |
| Temperature 1 | 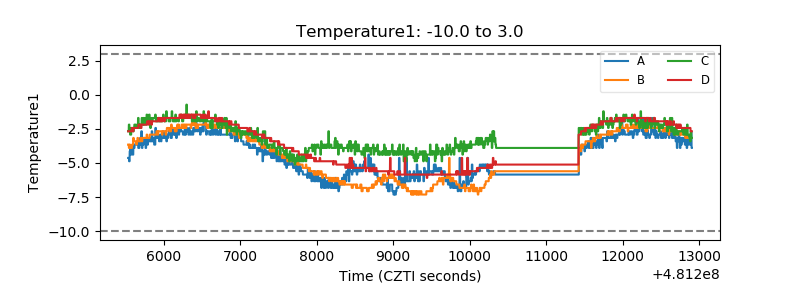 |
| Veto HV Monitor |  |
| Veto LLD | 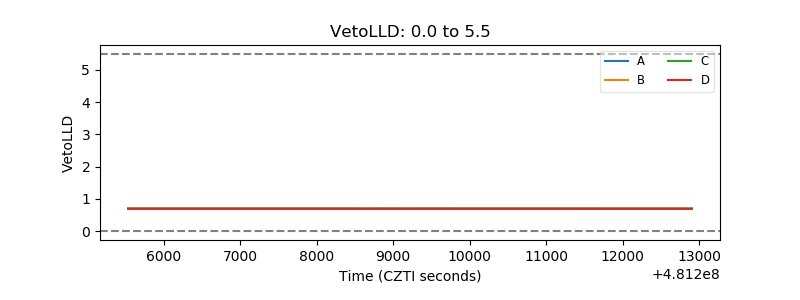 |
| Alpha Counter | 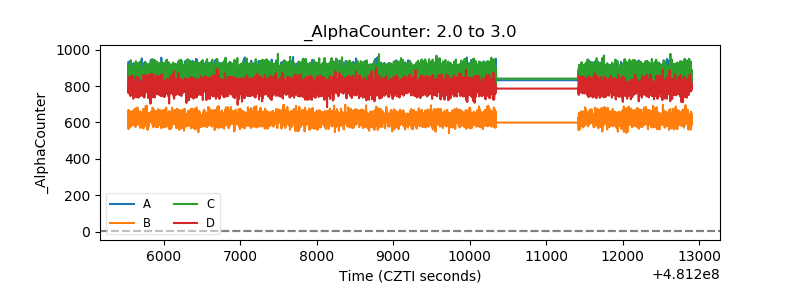 |
| _CPM_Rate | 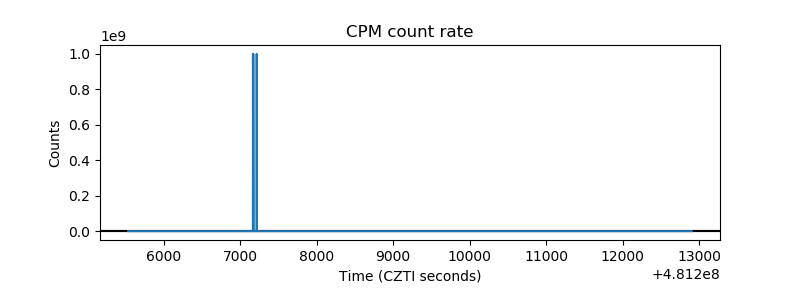 |
| CZT Counter | 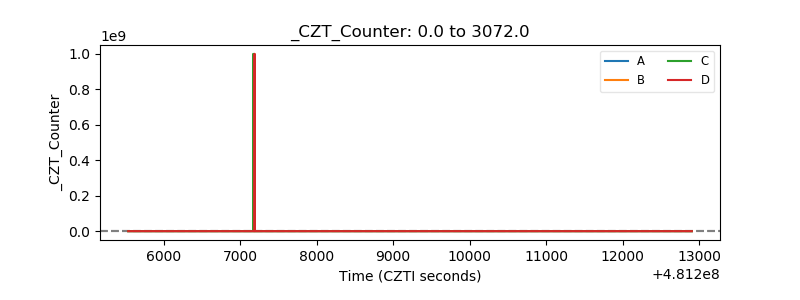 |
| +2.5 Volts monitor | 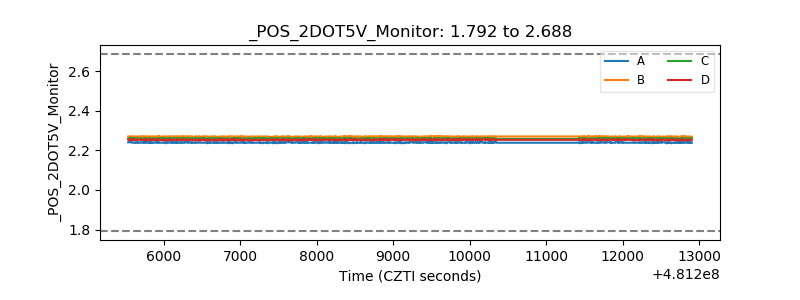 |
| +5 Volts monitor | 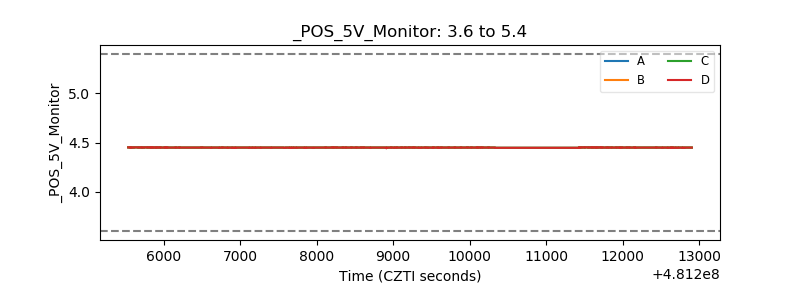 |
| _ROLL_ROT | 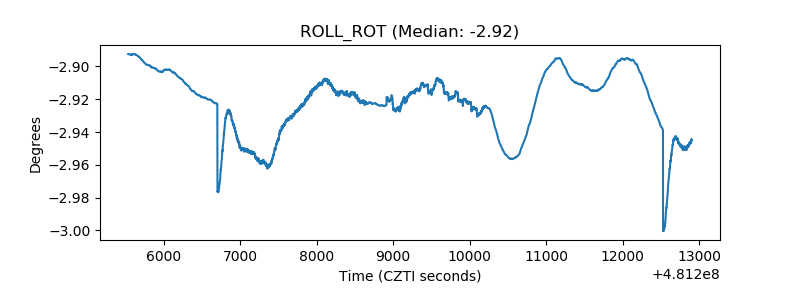 |
| _Roll_DEC | 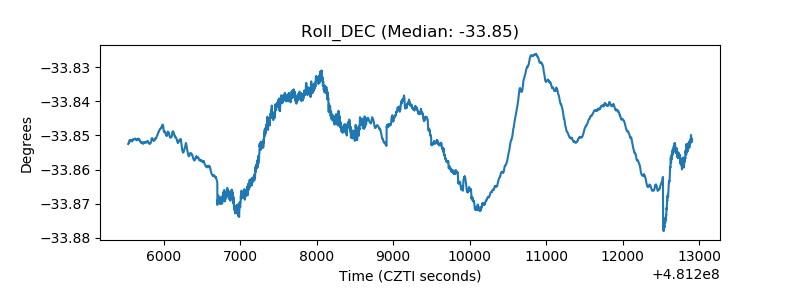 |
| _Roll_RA | 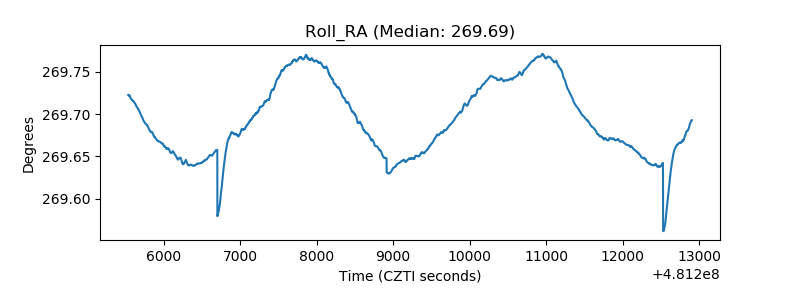 |
| Veto Counter | 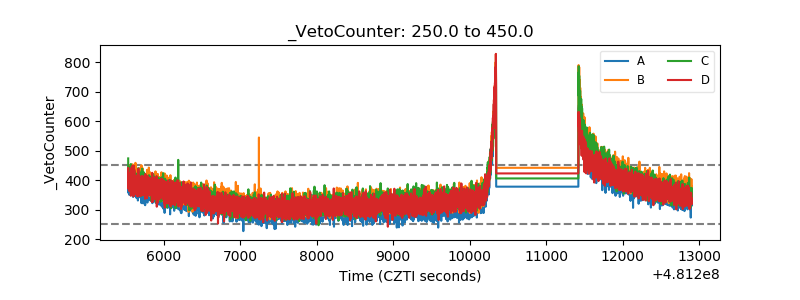 |