| Param | Original file | Final file |
|---|---|---|
| Filename | modeM0/AS1A13_090T01_9000006458_51437cztM0_level2.fits | modeM0/AS1A13_090T01_9000006458_51437cztM0_level2_quad_clean.evt |
| Size (bytes) | 583,410,240 | 92,620,800 |
| Size | 556.4 MB | 88.3 MB |
| Events in quadrant A | 5,877,897 | 586,730 |
| Events in quadrant B | 3,784,621 | 690,039 |
| Events in quadrant C | 6,951,249 | 515,808 |
| Events in quadrant D | 4,483,664 | 564,300 |
| Mode M0 | |||
|---|---|---|---|
| Quadrant | BADHDUFLAG | Total packets | Discarded packets |
| A | 0 | 21797 | 2 |
| B | 0 | 15571 | 2 |
| C | 0 | 25067 | 4 |
| D | 0 | 17770 | 2 |
| Mode M9 | |||
|---|---|---|---|
| Quadrant | BADHDUFLAG | Total packets | Discarded packets |
| A | 0 | 23 | 0 |
| B | 0 | 24 | 0 |
| C | 0 | 24 | 0 |
| D | 0 | 24 | 0 |
| Mode SS | |||
|---|---|---|---|
| Quadrant | BADHDUFLAG | Total packets | Discarded packets |
| A | 0 | 130 | 0 |
| B | 0 | 130 | 0 |
| C | 0 | 130 | 0 |
| D | 0 | 130 | 0 |
| Quadrant | Total seconds | Saturated seconds | Saturation percentage |
|---|---|---|---|
| A | 6426 | 858 | 13.352007% |
| B | 6426 | 278 | 4.326175% |
| C | 6425 | 1318 | 20.513619% |
| D | 6425 | 332 | 5.167315% |
Noise dominated data is calculated using 1-second bins in cleaned event files. If a bin has >2000 counts, and if more than 50% of those come from <1% of pixels, then it is considered to be noise-dominated and hence unusable.
| Quadrant | # 1 sec bins | Bins with >0 counts | Bins with >2000 counts | High rate bins dominated by noise | Noise dominated (total time) | Noise dominated (detector-on time) | Marked lightcurve |
|---|---|---|---|---|---|---|---|
| A | 7576 | 6426 | 690 | 690 | 9.11% | 10.74% | 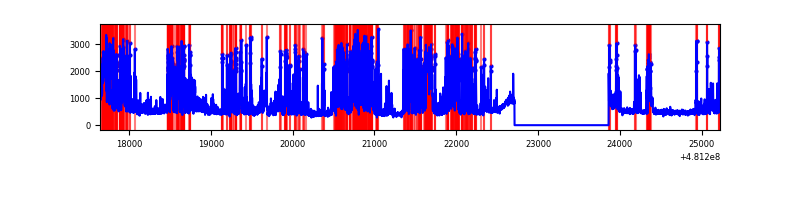 |
| B | 7576 | 6426 | 118 | 118 | 1.56% | 1.84% | 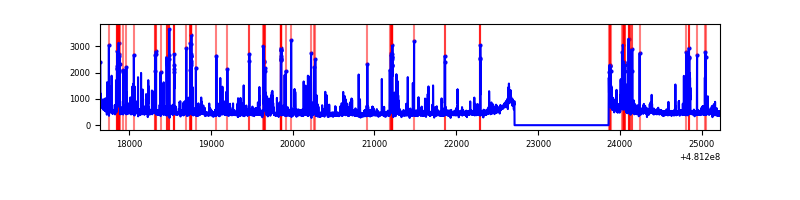 |
| C | 7574 | 6424 | 1115 | 1115 | 14.72% | 17.36% | 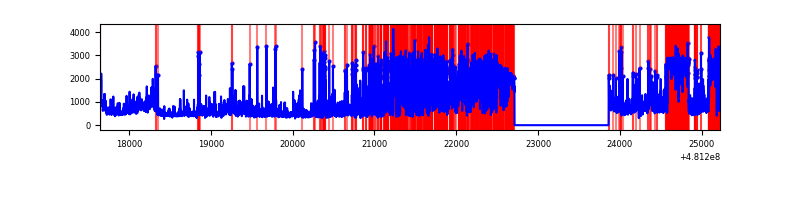 |
| D | 7575 | 6425 | 238 | 238 | 3.14% | 3.70% | 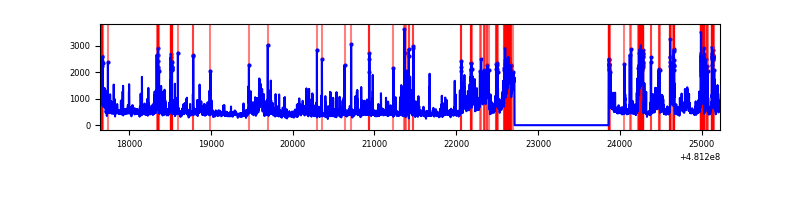 |
Top three noisy pixels from each quadrant. If the there are fewer than three noisy pixels in the level2.evt file, extra rows are filled as -1
| Pixel properties | Quadrant properties | ||||||
|---|---|---|---|---|---|---|---|
| Quadrant | DetID | PixID | Counts | Sigma | Mean | Median | Sigma |
| A | 7 | 64 | 2070293 | 12198.16 | 697 | 680 | 169.7 |
| A | 4 | 175 | 313550 | 1844.04 | 697 | 680 | 169.7 |
| A | 12 | 250 | 238859 | 1403.81 | 697 | 680 | 169.7 |
| B | 4 | 206 | 338298 | 2230.4 | 715 | 691 | 151.4 |
| B | 0 | 172 | 131024 | 861.04 | 715 | 691 | 151.4 |
| B | 5 | 185 | 90524 | 593.48 | 715 | 691 | 151.4 |
| C | 0 | 176 | 1606770 | 9377.79 | 627 | 621 | 171.3 |
| C | 4 | 12 | 1174921 | 6856.36 | 627 | 621 | 171.3 |
| C | 10 | 171 | 701605 | 4092.82 | 627 | 621 | 171.3 |
| D | 6 | 42 | 1041965 | 5434.24 | 680 | 656 | 191.6 |
| D | 8 | 176 | 151457 | 786.98 | 680 | 656 | 191.6 |
| D | 0 | 113 | 111484 | 578.37 | 680 | 656 | 191.6 |
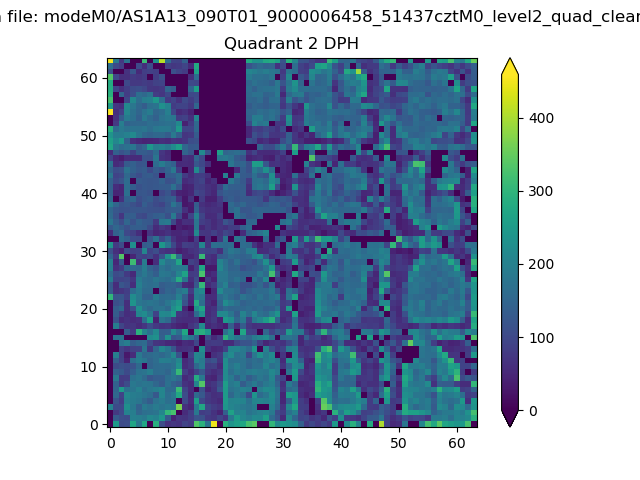
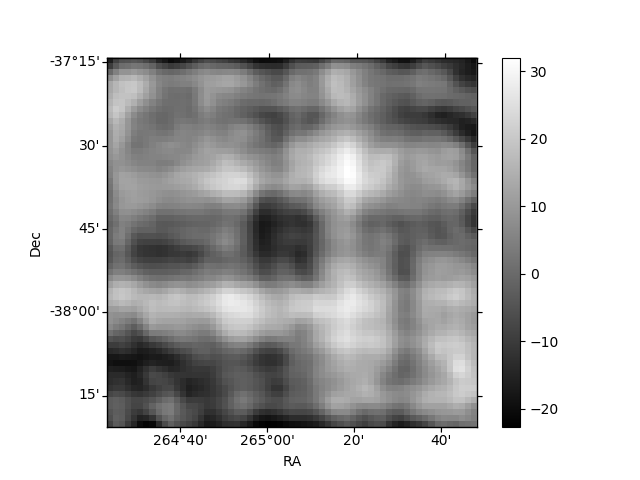
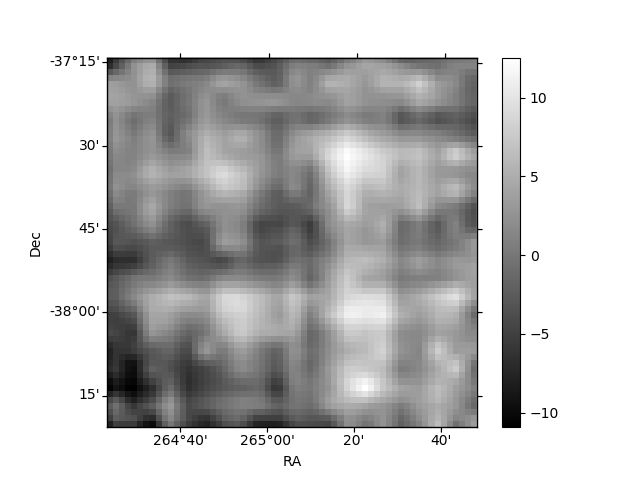
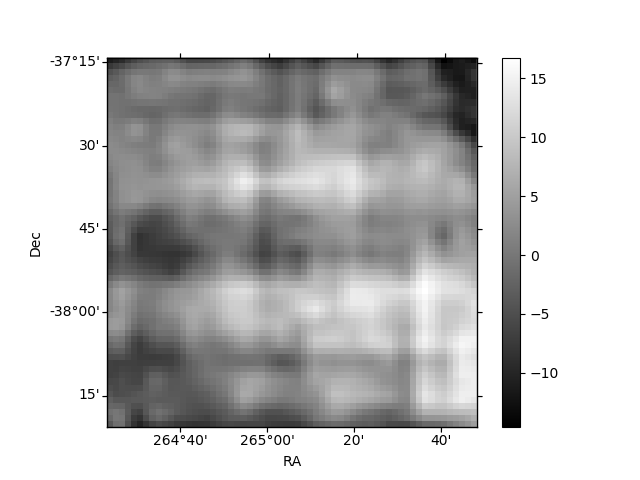
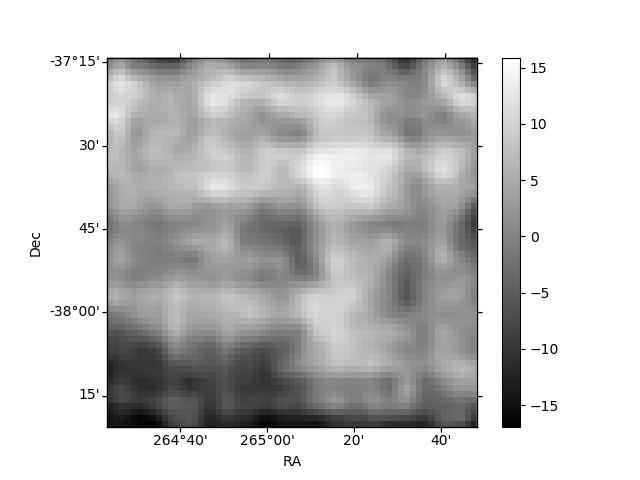
Histogram calculated using DETX and DETY for each event in the final _common_clean file
| Quadrant A | 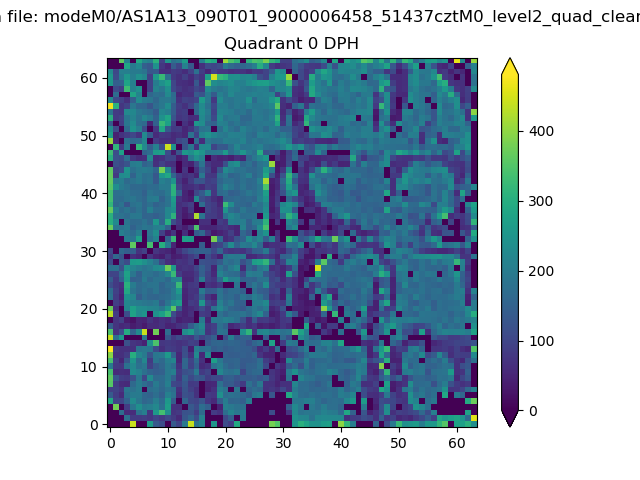 |
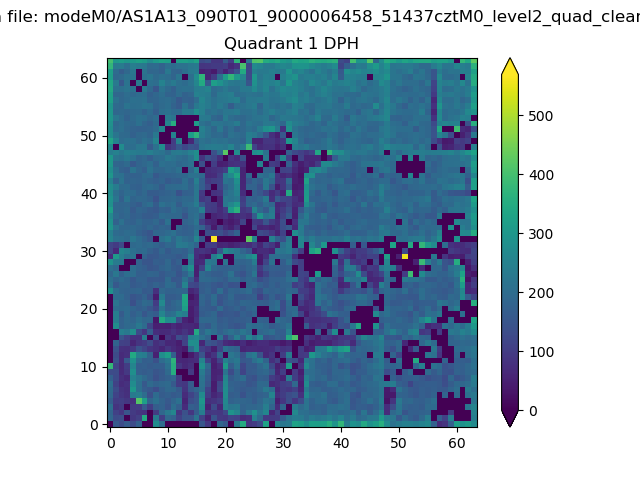 |
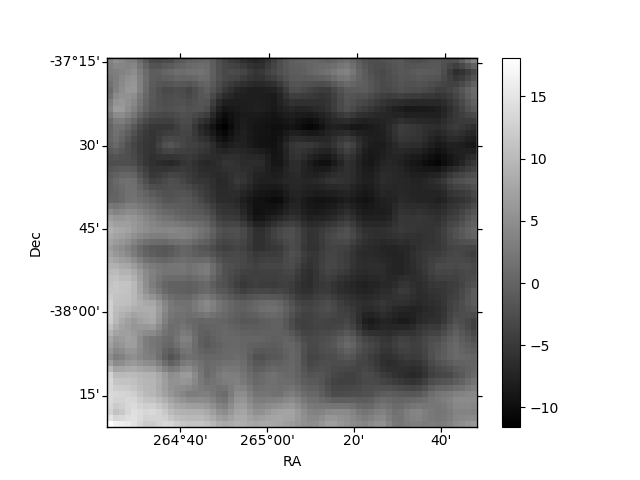
Quadrant B |
|---|---|---|---|
| Quadrant D | 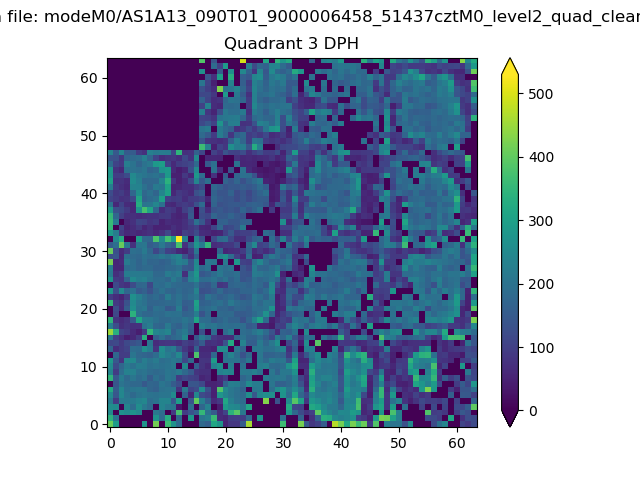 |
 |
Quadrant C |
| Plot type | Count rate plots | Images |
|---|---|---|
| Comparison with Poisson distribution Blue bars denote a histogram of data divided into 1 sec bins. Red curve is a Poisson curve with rate = median count rate of data. |
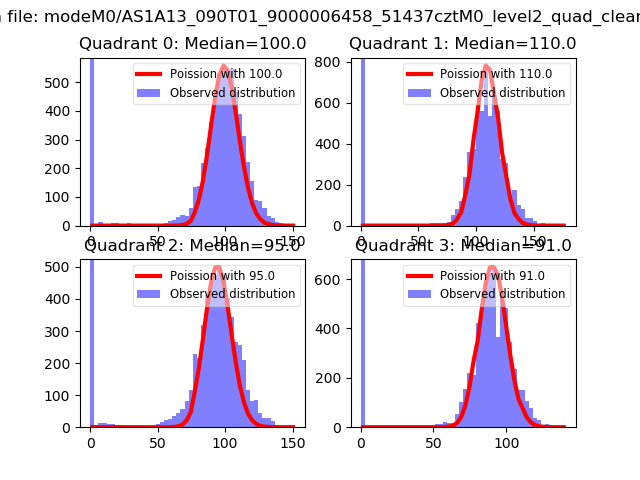 |
 |
| Quadrant-wise count rates Data is divided into 100 sec bins |
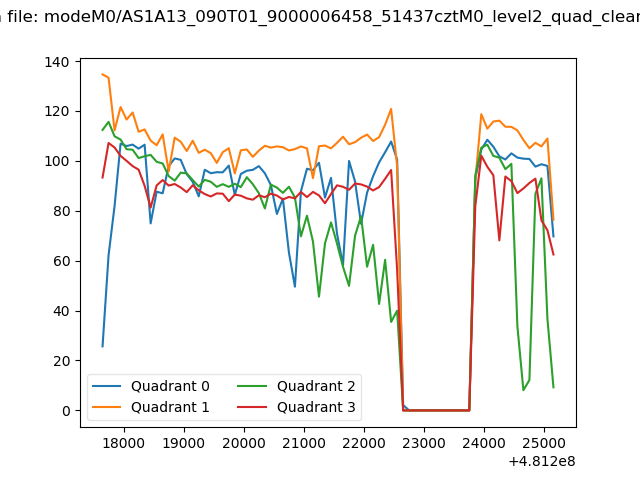 |
|
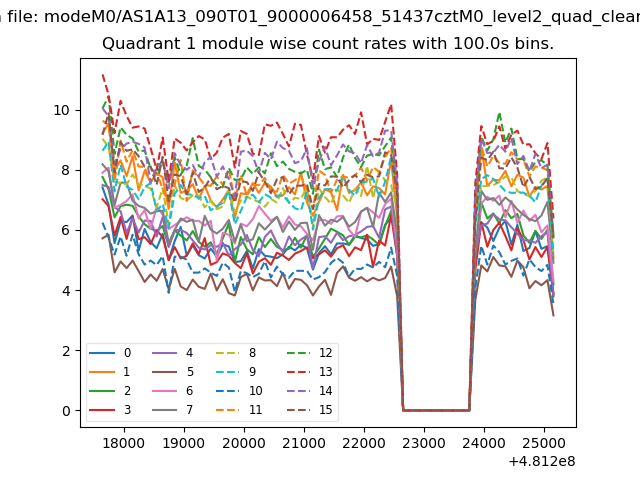
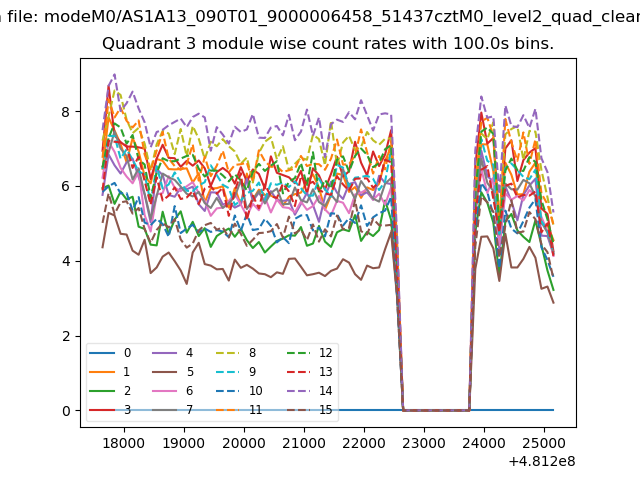
| Module-wise count rates for Quadrant A Data is divided into 100 sec bins |
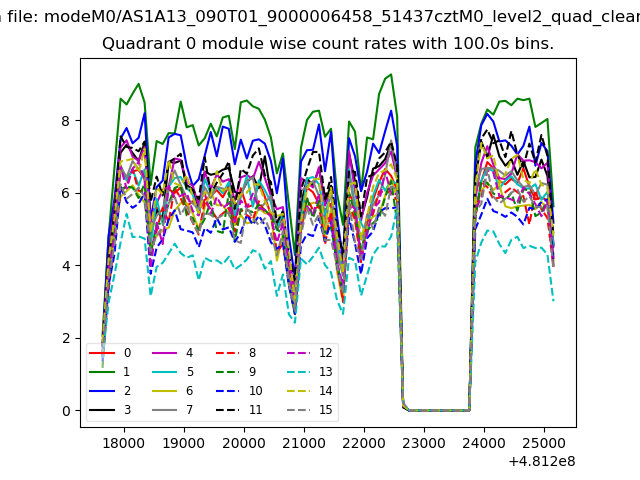 |
 |
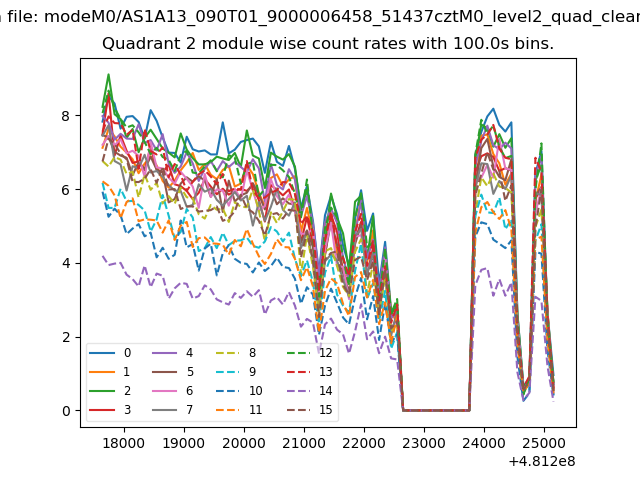
| Module-wise count rates for Quadrant B Data is divided into 100 sec bins |
 |
 |
| Module-wise count rates for Quadrant C Data is divided into 100 sec bins |
 |
 |
| Module-wise count rates for Quadrant D Data is divided into 100 sec bins |
 |
 |
| Parameter | Plot |
|---|---|
| CZT HV Monitor | 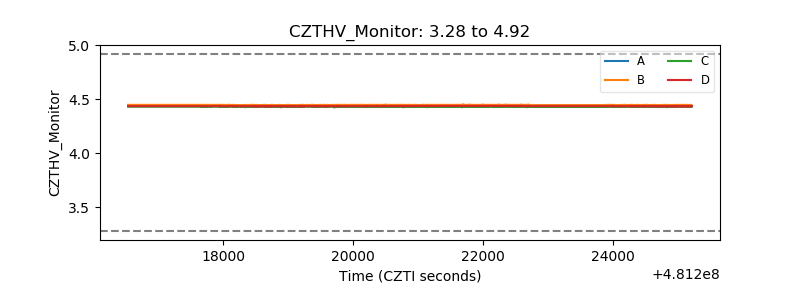 |
| D_VDD | 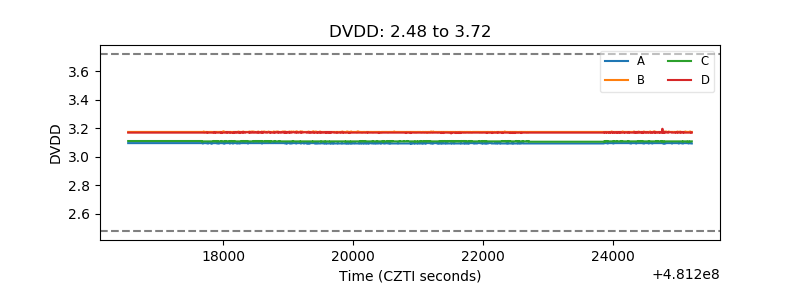 |
| Temperature 1 | 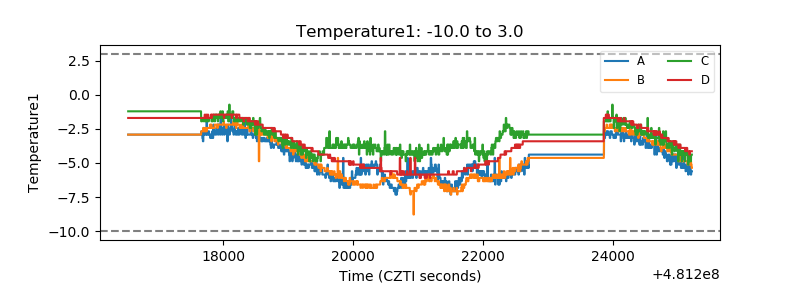 |
| Veto HV Monitor | 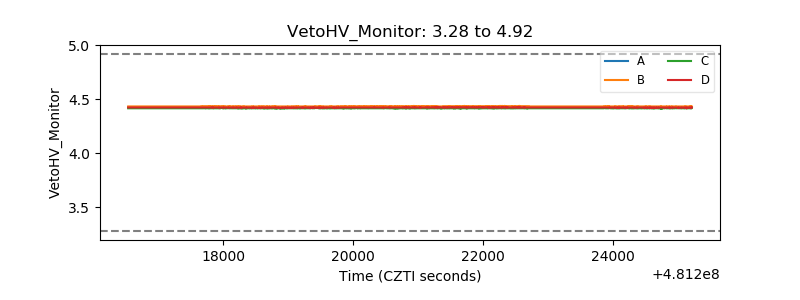 |
| Veto LLD | 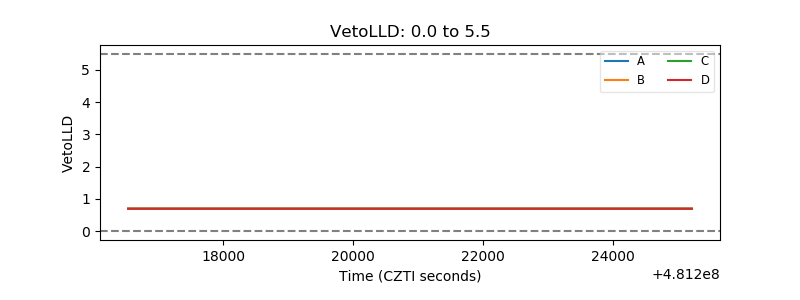 |
| Alpha Counter | 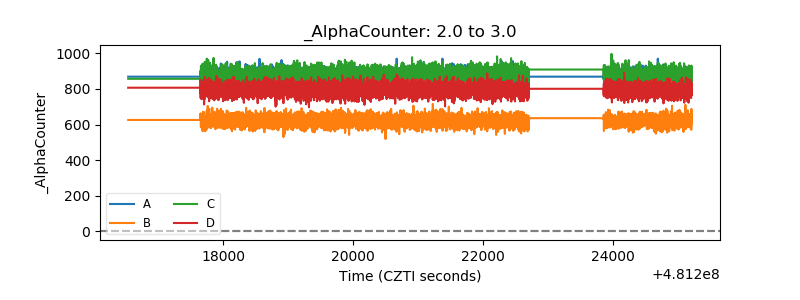 |
| _CPM_Rate | 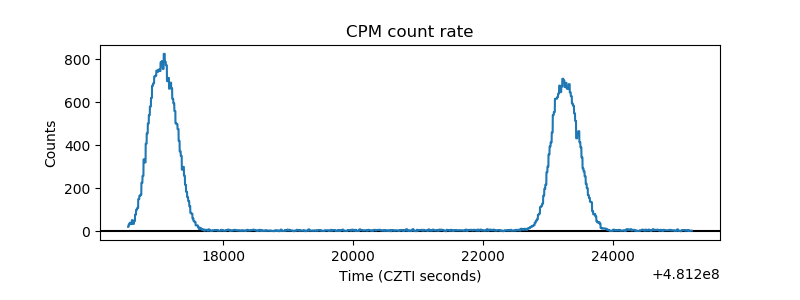 |
| CZT Counter | 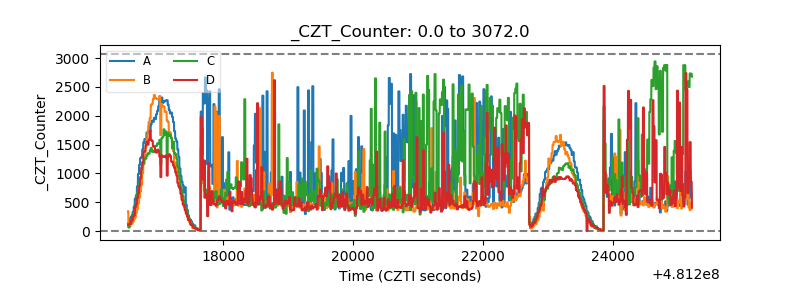 |
| +2.5 Volts monitor | 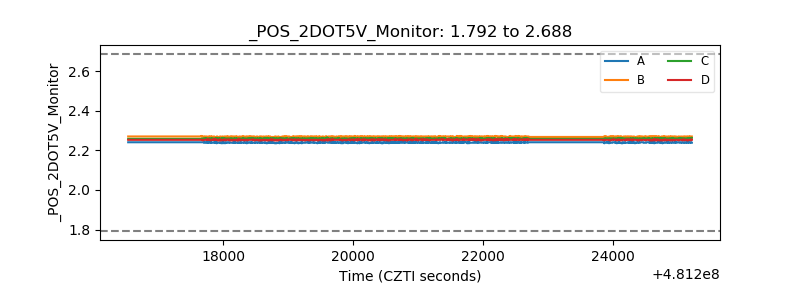 |
| +5 Volts monitor | 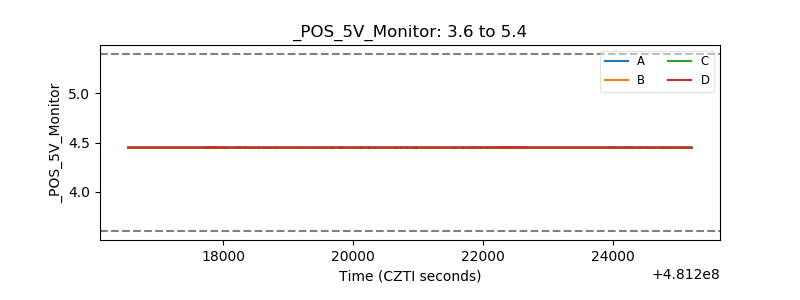 |
| _ROLL_ROT | 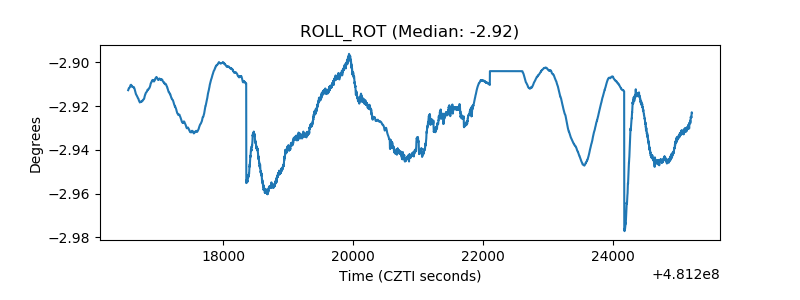 |
| _Roll_DEC | 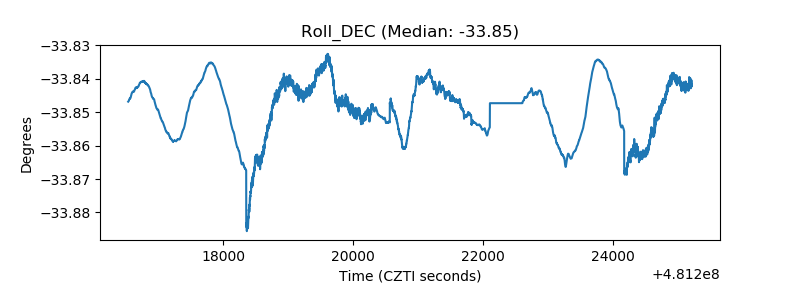 |
| _Roll_RA | 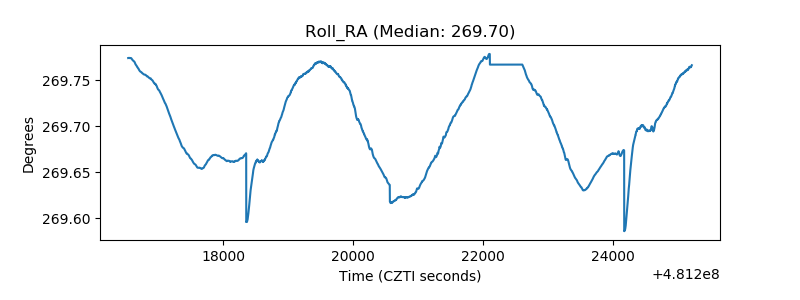 |
| Veto Counter | 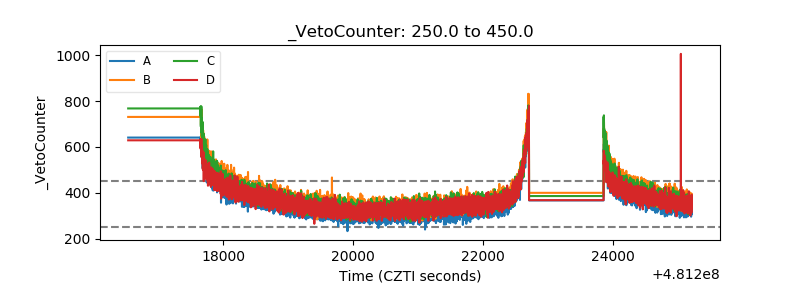 |