| Param | Original file | Final file |
|---|---|---|
| Filename | modeM0/AS1A13_090T01_9000006458_51438cztM0_level2.fits | modeM0/AS1A13_090T01_9000006458_51438cztM0_level2_quad_clean.evt |
| Size (bytes) | 775,267,200 | 83,088,000 |
| Size | 739.4 MB | 79.2 MB |
| Events in quadrant A | 6,451,655 | 575,072 |
| Events in quadrant B | 4,186,932 | 670,912 |
| Events in quadrant C | 12,774,460 | 256,962 |
| Events in quadrant D | 4,778,420 | 557,213 |
| Mode M0 | |||
|---|---|---|---|
| Quadrant | BADHDUFLAG | Total packets | Discarded packets |
| A | 0 | 23593 | 4 |
| B | 0 | 16872 | 2 |
| C | 0 | 42394 | 2 |
| D | 0 | 18849 | 2 |
| Mode M9 | |||
|---|---|---|---|
| Quadrant | BADHDUFLAG | Total packets | Discarded packets |
| A | 0 | 23 | 0 |
| B | 0 | 23 | 0 |
| C | 0 | 23 | 0 |
| D | 0 | 23 | 0 |
| Mode SS | |||
|---|---|---|---|
| Quadrant | BADHDUFLAG | Total packets | Discarded packets |
| A | 0 | 134 | 0 |
| B | 0 | 134 | 0 |
| C | 0 | 134 | 0 |
| D | 0 | 134 | 0 |
| Quadrant | Total seconds | Saturated seconds | Saturation percentage |
|---|---|---|---|
| A | 6533 | 959 | 14.679320% |
| B | 6534 | 443 | 6.779920% |
| C | 6534 | 4099 | 62.733395% |
| D | 6534 | 416 | 6.366697% |
Noise dominated data is calculated using 1-second bins in cleaned event files. If a bin has >2000 counts, and if more than 50% of those come from <1% of pixels, then it is considered to be noise-dominated and hence unusable.
| Quadrant | # 1 sec bins | Bins with >0 counts | Bins with >2000 counts | High rate bins dominated by noise | Noise dominated (total time) | Noise dominated (detector-on time) | Marked lightcurve |
|---|---|---|---|---|---|---|---|
| A | 8793 | 6533 | 629 | 629 | 7.15% | 9.63% | 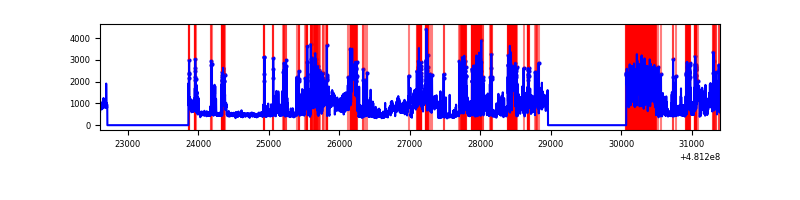 |
| B | 8794 | 6534 | 187 | 187 | 2.13% | 2.86% | 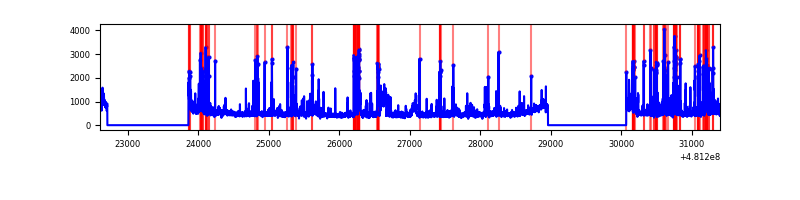 |
| C | 8794 | 6534 | 3947 | 3947 | 44.88% | 60.41% | 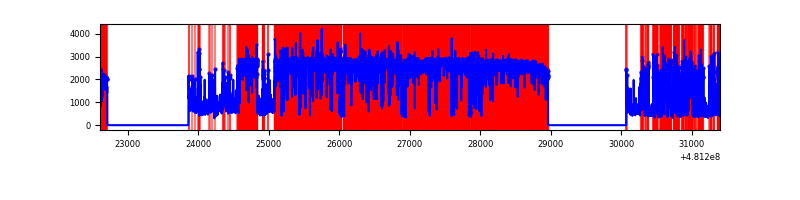 |
| D | 8794 | 6535 | 306 | 306 | 3.48% | 4.68% | 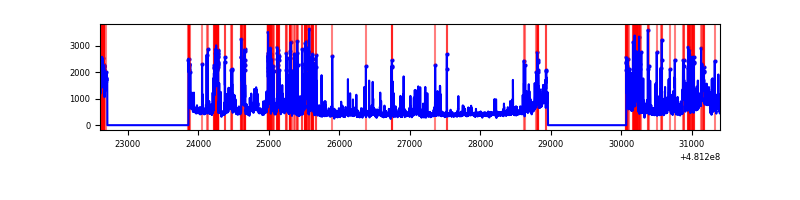 |
Top three noisy pixels from each quadrant. If the there are fewer than three noisy pixels in the level2.evt file, extra rows are filled as -1
| Pixel properties | Quadrant properties | ||||||
|---|---|---|---|---|---|---|---|
| Quadrant | DetID | PixID | Counts | Sigma | Mean | Median | Sigma |
| A | 7 | 64 | 1336494 | 7726.88 | 705 | 688 | 172.9 |
| A | 12 | 3 | 1088755 | 6293.85 | 705 | 688 | 172.9 |
| A | 15 | 174 | 507873 | 2933.78 | 705 | 688 | 172.9 |
| B | 0 | 172 | 302265 | 1942.67 | 723 | 697 | 155.2 |
| B | 5 | 172 | 284701 | 1829.53 | 723 | 697 | 155.2 |
| B | 4 | 206 | 227080 | 1458.34 | 723 | 697 | 155.2 |
| C | 4 | 12 | 7927196 | 64018.97 | 442 | 438 | 123.8 |
| C | 0 | 176 | 1516068 | 12240.7 | 442 | 438 | 123.8 |
| C | 15 | 179 | 634889 | 5124.02 | 442 | 438 | 123.8 |
| D | 6 | 42 | 857277 | 4411.5 | 688 | 663 | 194.2 |
| D | 8 | 176 | 553099 | 2845.01 | 688 | 663 | 194.2 |
| D | 13 | 170 | 112609 | 576.51 | 688 | 663 | 194.2 |
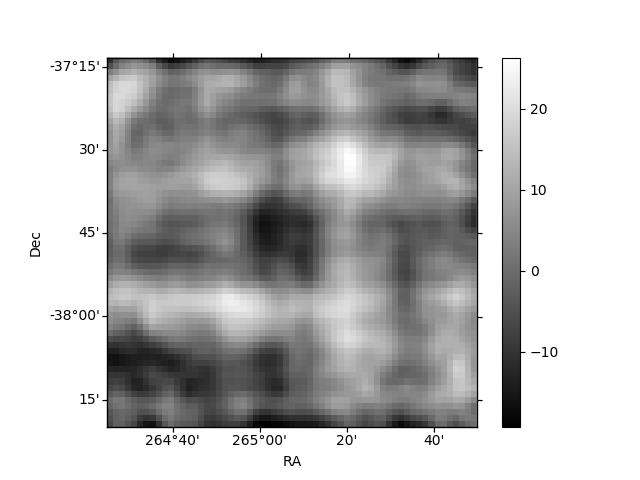
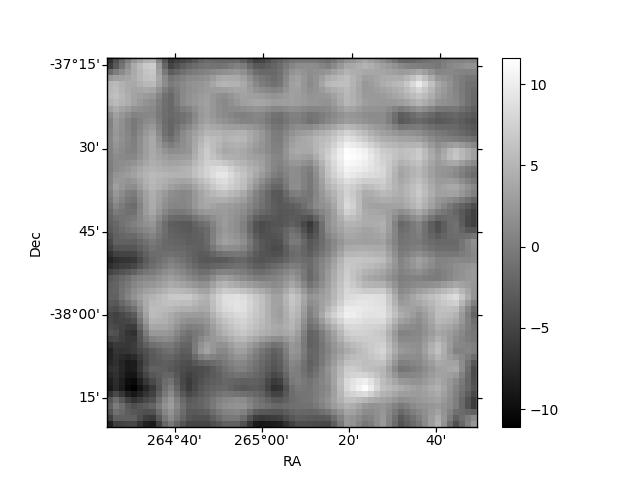
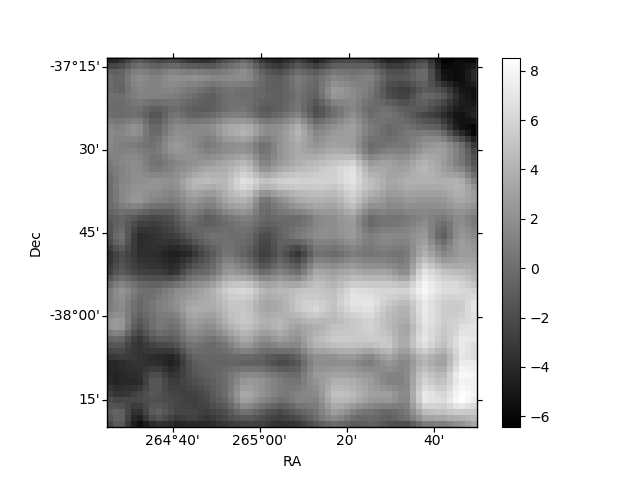
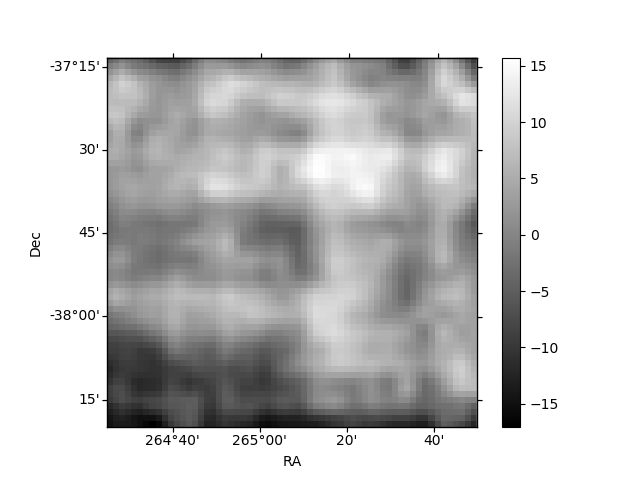
Histogram calculated using DETX and DETY for each event in the final _common_clean file
| Quadrant A | 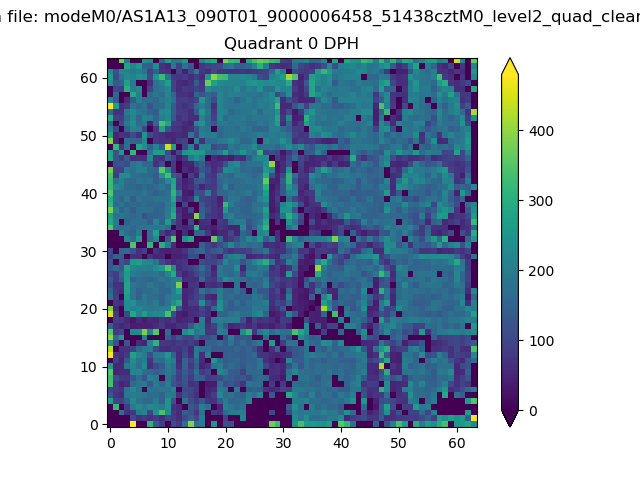 |
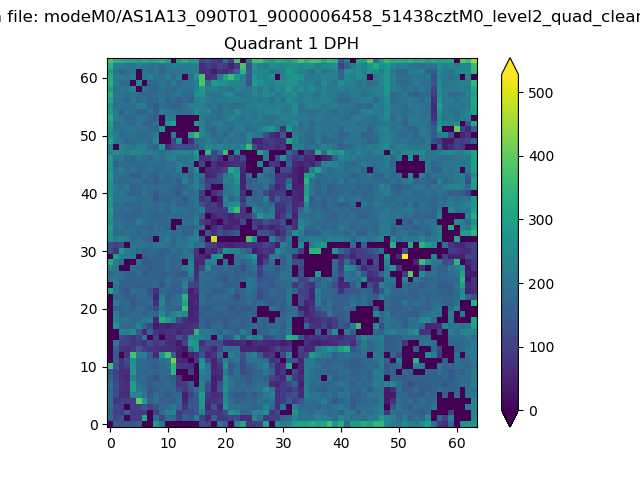 |
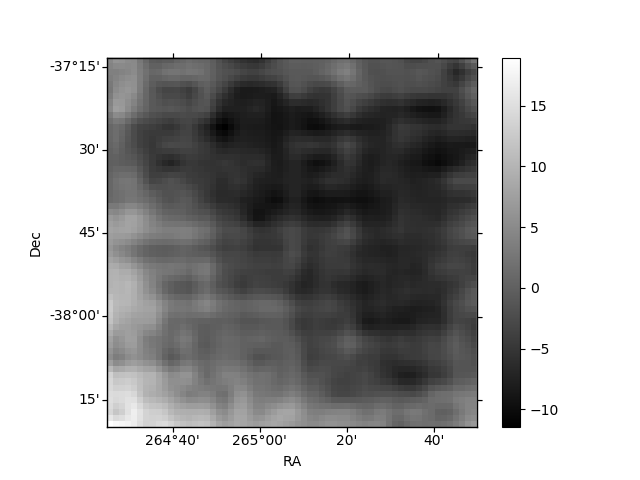
Quadrant B |
|---|---|---|---|
| Quadrant D | 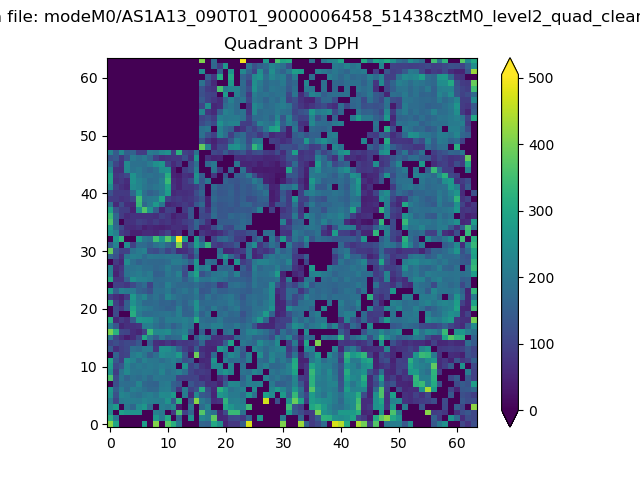 |
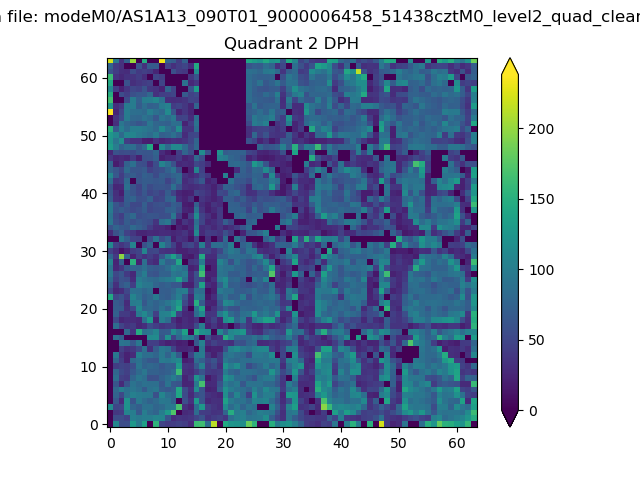 |
Quadrant C |
| Plot type | Count rate plots | Images |
|---|---|---|
| Comparison with Poisson distribution Blue bars denote a histogram of data divided into 1 sec bins. Red curve is a Poisson curve with rate = median count rate of data. |
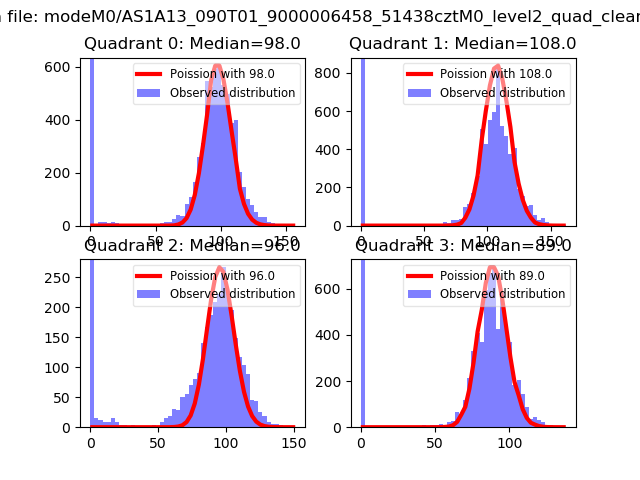 |
 |
| Quadrant-wise count rates Data is divided into 100 sec bins |
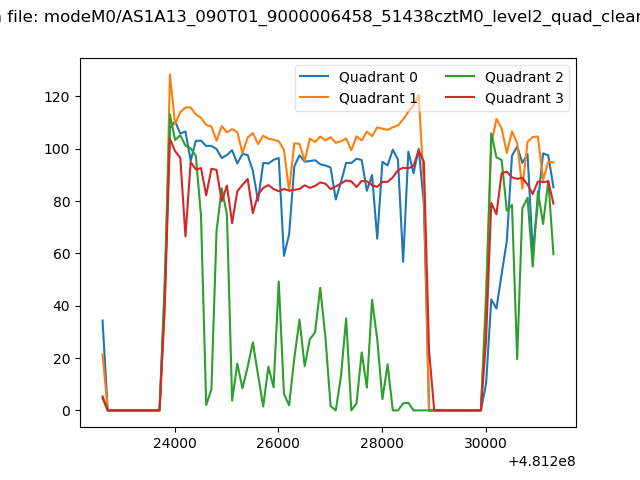 |
|
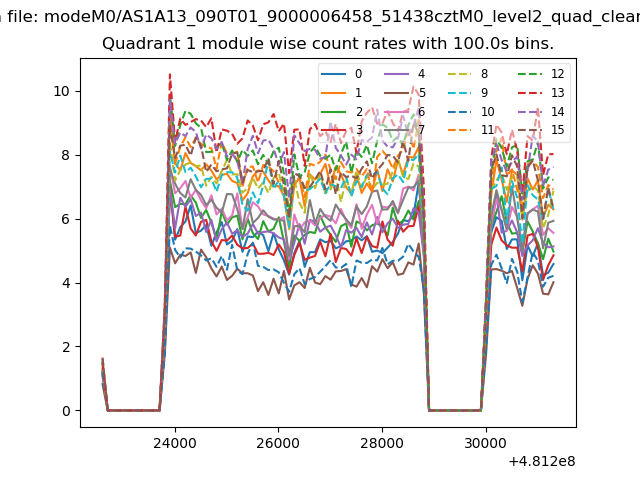
| Module-wise count rates for Quadrant A Data is divided into 100 sec bins |
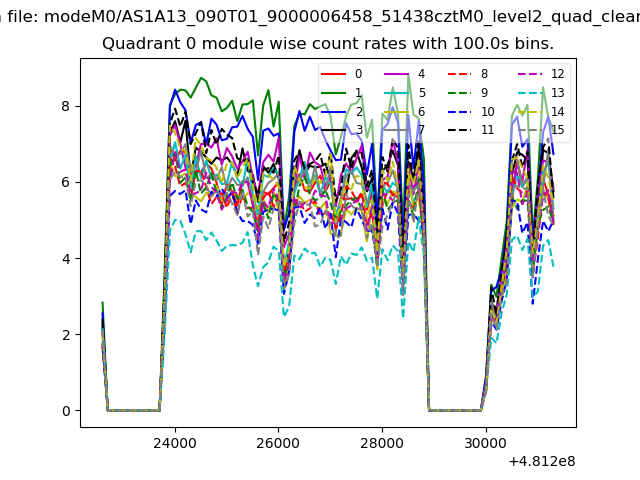 |
 |
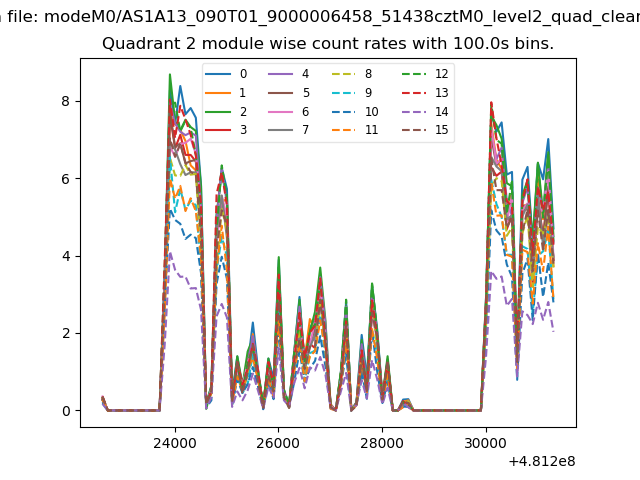
| Module-wise count rates for Quadrant B Data is divided into 100 sec bins |
 |
 |
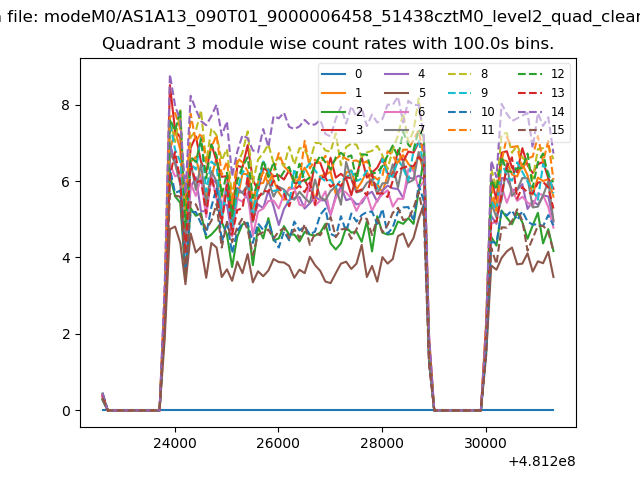
| Module-wise count rates for Quadrant C Data is divided into 100 sec bins |
 |
 |
| Module-wise count rates for Quadrant D Data is divided into 100 sec bins |
 |
 |
| Parameter | Plot |
|---|---|
| CZT HV Monitor | 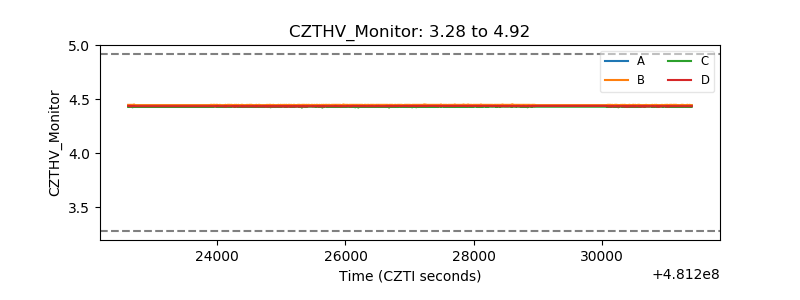 |
| D_VDD |  |
| Temperature 1 | 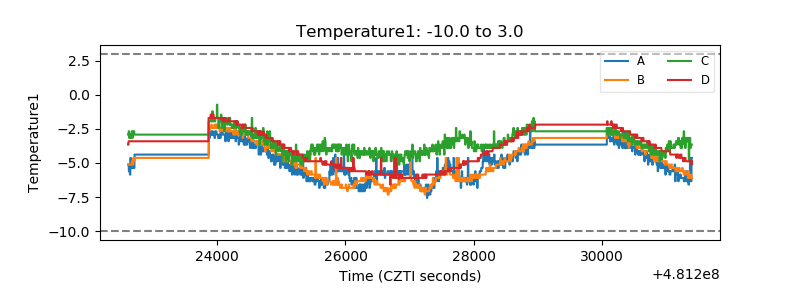 |
| Veto HV Monitor |  |
| Veto LLD | 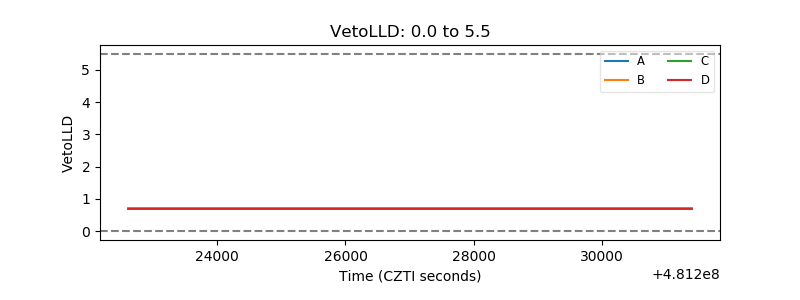 |
| Alpha Counter | 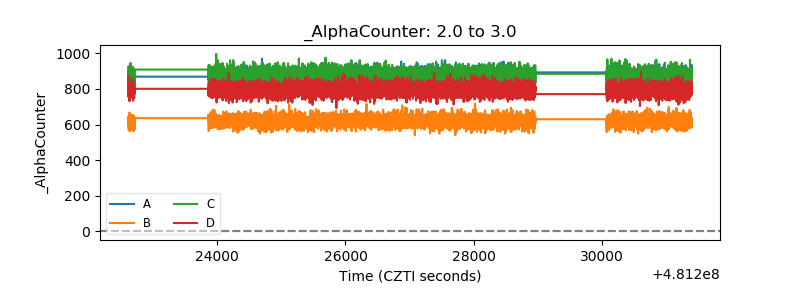 |
| _CPM_Rate | 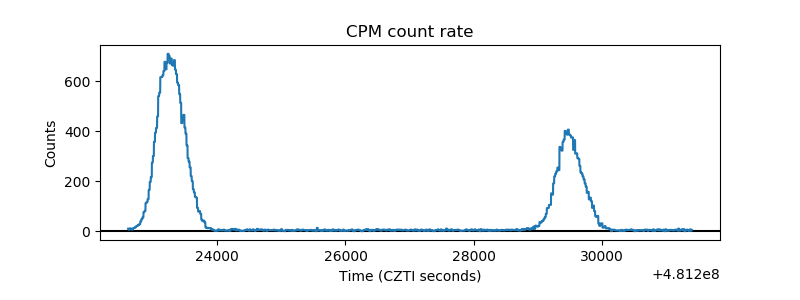 |
| CZT Counter | 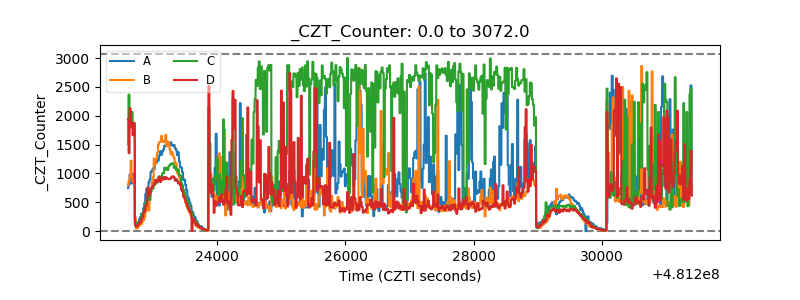 |
| +2.5 Volts monitor | 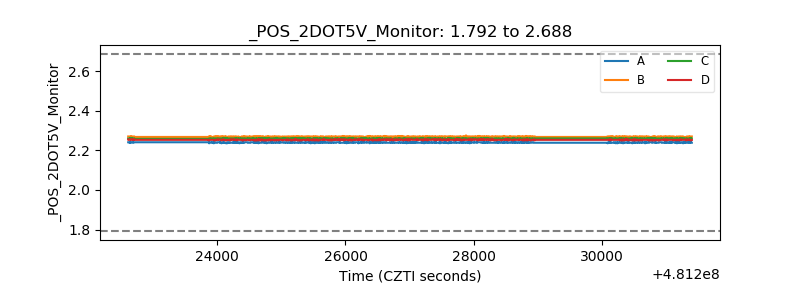 |
| +5 Volts monitor | 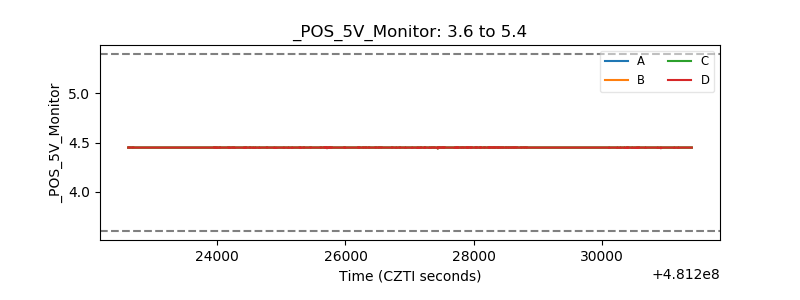 |
| _ROLL_ROT | 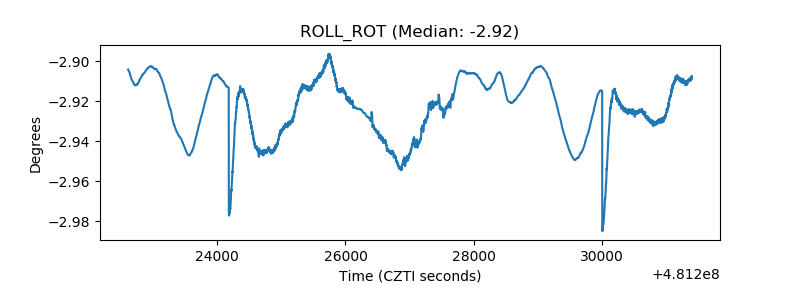 |
| _Roll_DEC | 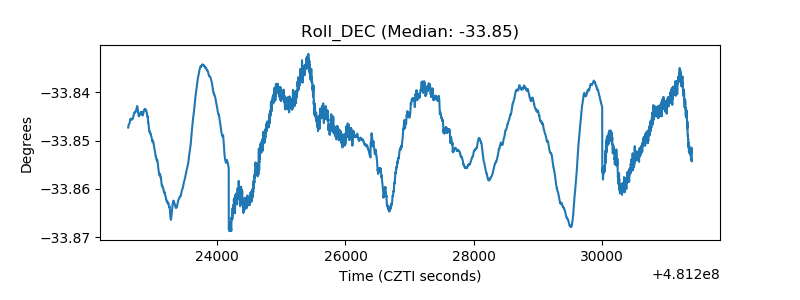 |
| _Roll_RA | 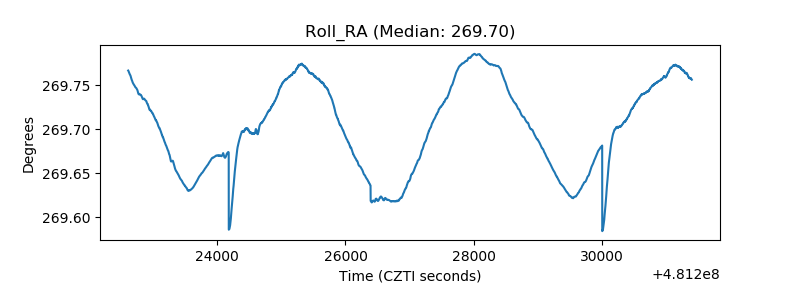 |
| Veto Counter | 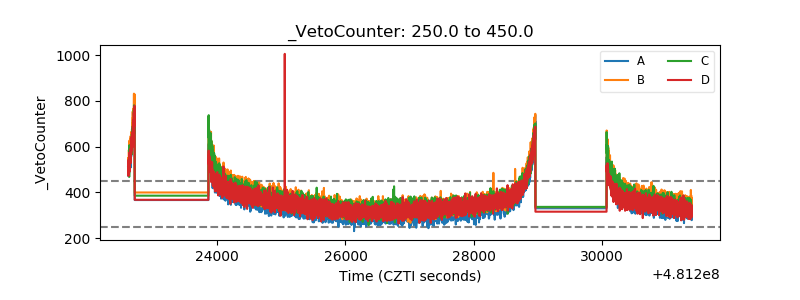 |