| Param | Original file | Final file |
|---|---|---|
| Filename | modeM0/AS1A13_090T01_9000006458_51439cztM0_level2.fits | modeM0/AS1A13_090T01_9000006458_51439cztM0_level2_quad_clean.evt |
| Size (bytes) | 741,458,880 | 87,042,240 |
| Size | 707.1 MB | 83.0 MB |
| Events in quadrant A | 8,470,389 | 519,611 |
| Events in quadrant B | 4,155,986 | 677,380 |
| Events in quadrant C | 9,497,249 | 418,861 |
| Events in quadrant D | 4,810,713 | 558,602 |
| Mode M0 | |||
|---|---|---|---|
| Quadrant | BADHDUFLAG | Total packets | Discarded packets |
| A | 0 | 29786 | 2 |
| B | 0 | 16863 | 2 |
| C | 0 | 32752 | 3 |
| D | 0 | 19051 | 3 |
| Mode M9 | |||
|---|---|---|---|
| Quadrant | BADHDUFLAG | Total packets | Discarded packets |
| A | 0 | 20 | 0 |
| B | 0 | 21 | 0 |
| C | 0 | 21 | 0 |
| D | 0 | 21 | 0 |
| Mode SS | |||
|---|---|---|---|
| Quadrant | BADHDUFLAG | Total packets | Discarded packets |
| A | 0 | 134 | 0 |
| B | 0 | 134 | 0 |
| C | 0 | 134 | 0 |
| D | 0 | 134 | 0 |
| Quadrant | Total seconds | Saturated seconds | Saturation percentage |
|---|---|---|---|
| A | 6617 | 1485 | 22.442194% |
| B | 6618 | 283 | 4.276216% |
| C | 6617 | 2435 | 36.799154% |
| D | 6616 | 290 | 4.383313% |
Noise dominated data is calculated using 1-second bins in cleaned event files. If a bin has >2000 counts, and if more than 50% of those come from <1% of pixels, then it is considered to be noise-dominated and hence unusable.
| Quadrant | # 1 sec bins | Bins with >0 counts | Bins with >2000 counts | High rate bins dominated by noise | Noise dominated (total time) | Noise dominated (detector-on time) | Marked lightcurve |
|---|---|---|---|---|---|---|---|
| A | 7558 | 6619 | 1247 | 1247 | 16.50% | 18.84% | 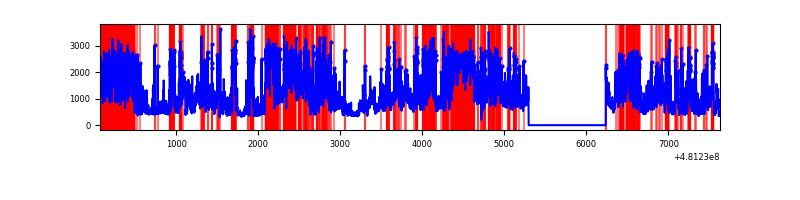 |
| B | 7558 | 6619 | 163 | 163 | 2.16% | 2.46% | 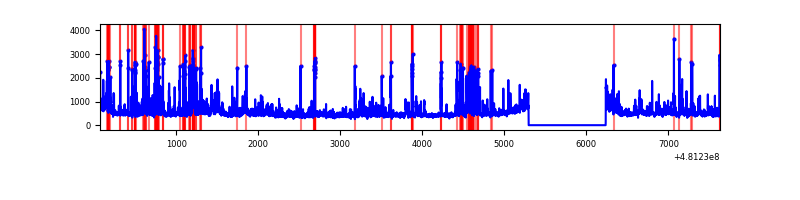 |
| C | 7557 | 6617 | 2184 | 2184 | 28.90% | 33.01% | 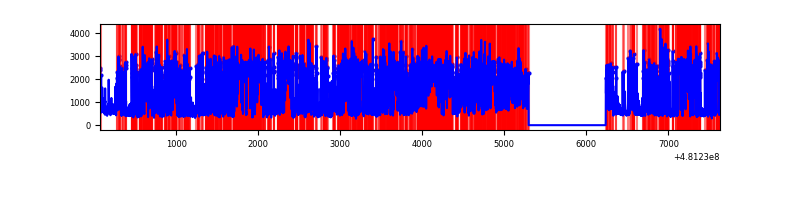 |
| D | 7557 | 6618 | 245 | 245 | 3.24% | 3.70% | 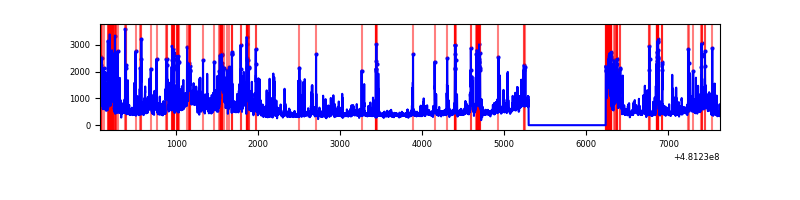 |
Top three noisy pixels from each quadrant. If the there are fewer than three noisy pixels in the level2.evt file, extra rows are filled as -1
| Pixel properties | Quadrant properties | ||||||
|---|---|---|---|---|---|---|---|
| Quadrant | DetID | PixID | Counts | Sigma | Mean | Median | Sigma |
| A | 12 | 3 | 1993999 | 12365.82 | 651 | 637 | 161.2 |
| A | 7 | 64 | 1751825 | 10863.49 | 651 | 637 | 161.2 |
| A | 15 | 174 | 929198 | 5760.33 | 651 | 637 | 161.2 |
| B | 5 | 172 | 306385 | 2024.11 | 709 | 684 | 151.0 |
| B | 0 | 172 | 215029 | 1419.22 | 709 | 684 | 151.0 |
| B | 4 | 206 | 150851 | 994.29 | 709 | 684 | 151.0 |
| C | 0 | 176 | 3585999 | 22546.57 | 574 | 569 | 159.0 |
| C | 4 | 12 | 1249342 | 7852.77 | 574 | 569 | 159.0 |
| C | 15 | 179 | 1109752 | 6974.97 | 574 | 569 | 159.0 |
| D | 8 | 176 | 974117 | 5176.62 | 677 | 652 | 188.1 |
| D | 13 | 170 | 351358 | 1864.96 | 677 | 652 | 188.1 |
| D | 6 | 42 | 191549 | 1015.14 | 677 | 652 | 188.1 |
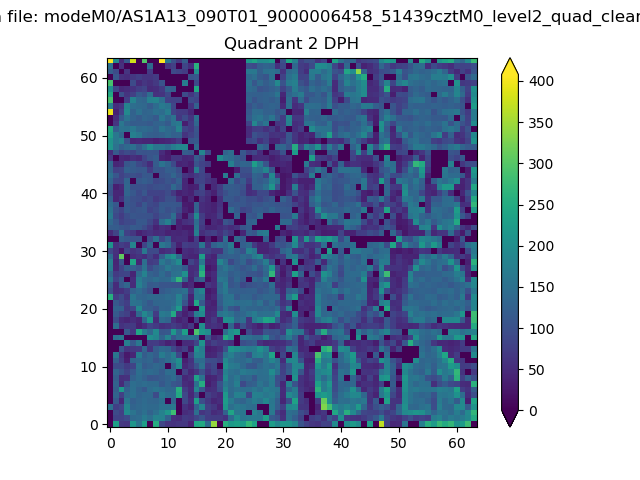
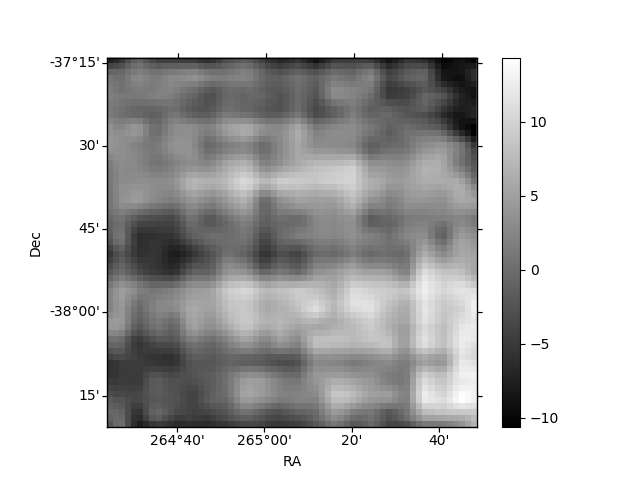
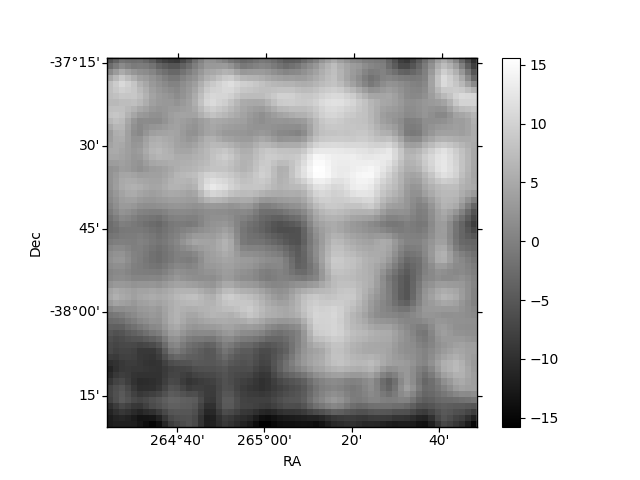
Histogram calculated using DETX and DETY for each event in the final _common_clean file
| Quadrant A | 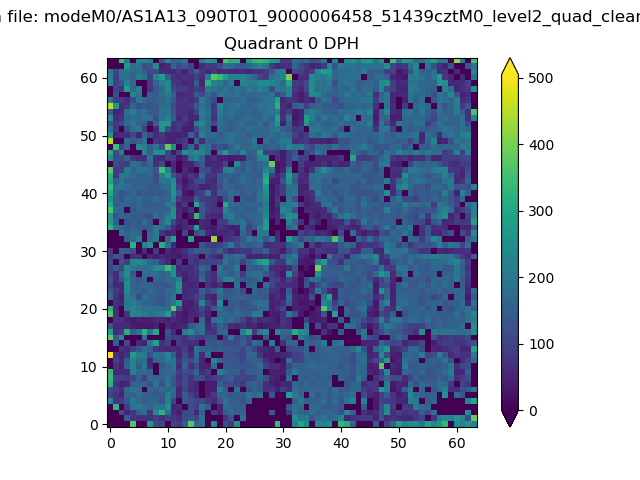 |
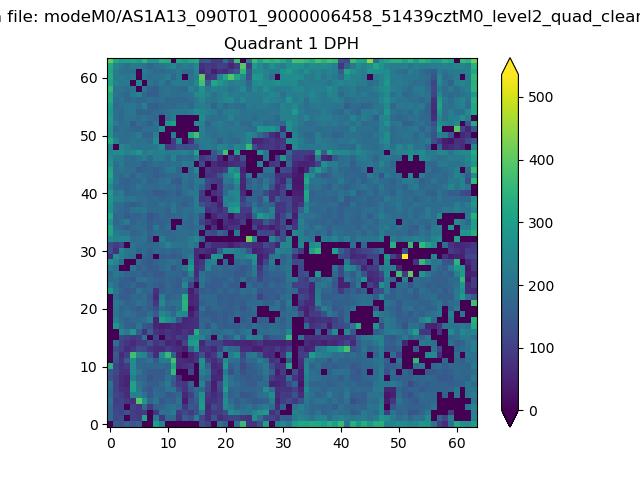 |
Quadrant B |
|---|---|---|---|
| Quadrant D | 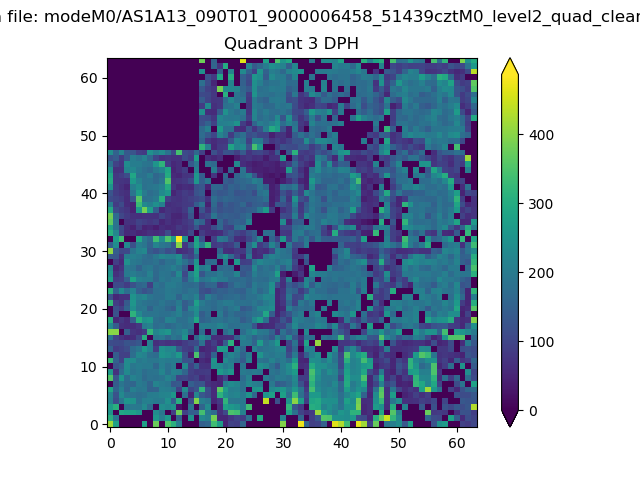 |
 |
Quadrant C |
| Plot type | Count rate plots | Images |
|---|---|---|
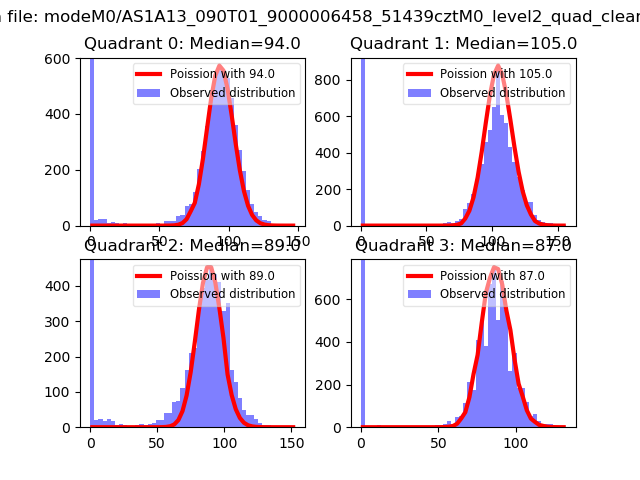
| Comparison with Poisson distribution Blue bars denote a histogram of data divided into 1 sec bins. Red curve is a Poisson curve with rate = median count rate of data. |
 |
 |
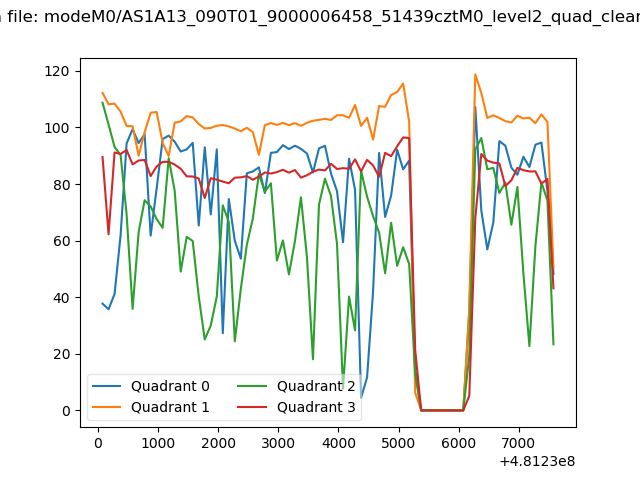
| Quadrant-wise count rates Data is divided into 100 sec bins |
 |
|
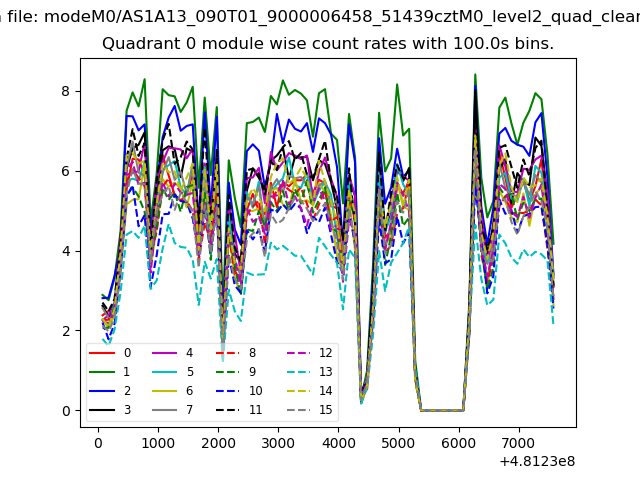
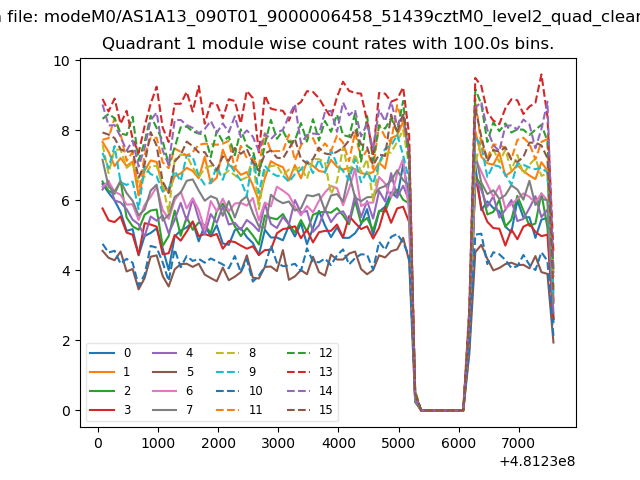
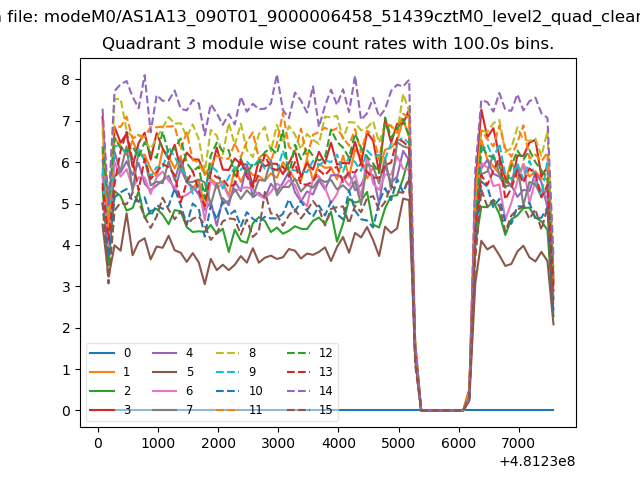
| Module-wise count rates for Quadrant A Data is divided into 100 sec bins |
 |
 |
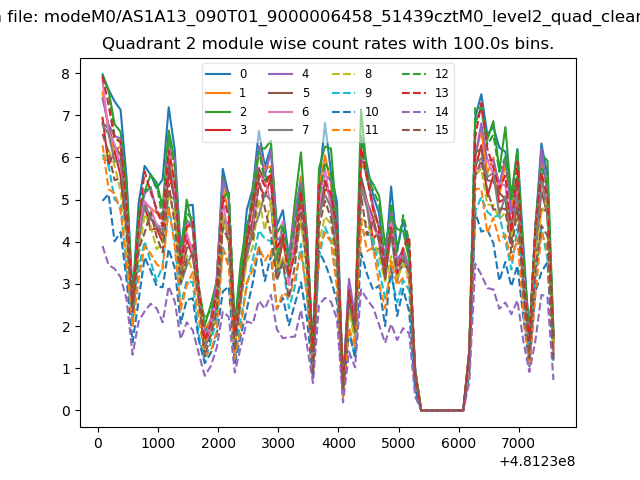
| Module-wise count rates for Quadrant B Data is divided into 100 sec bins |
 |
 |
| Module-wise count rates for Quadrant C Data is divided into 100 sec bins |
 |
 |
| Module-wise count rates for Quadrant D Data is divided into 100 sec bins |
 |
 |
| Parameter | Plot |
|---|---|
| CZT HV Monitor |  |
| D_VDD |  |
| Temperature 1 | 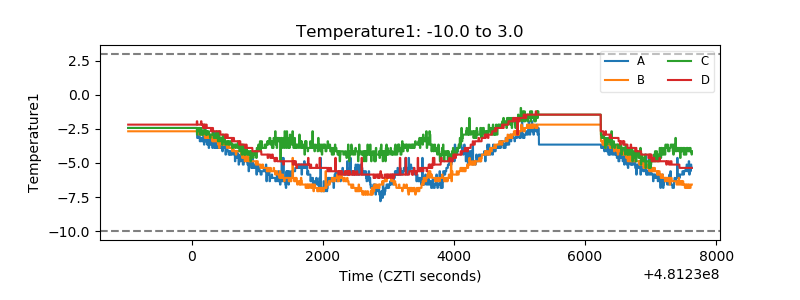 |
| Veto HV Monitor | 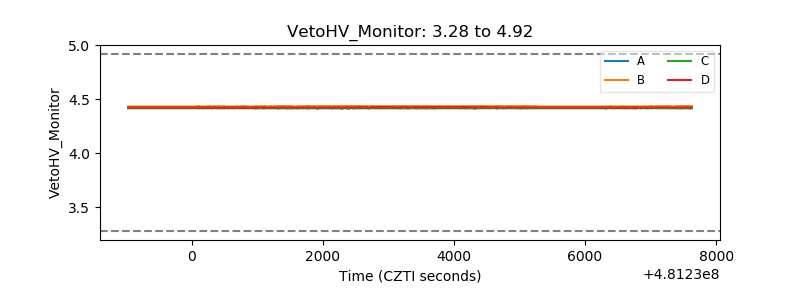 |
| Veto LLD | 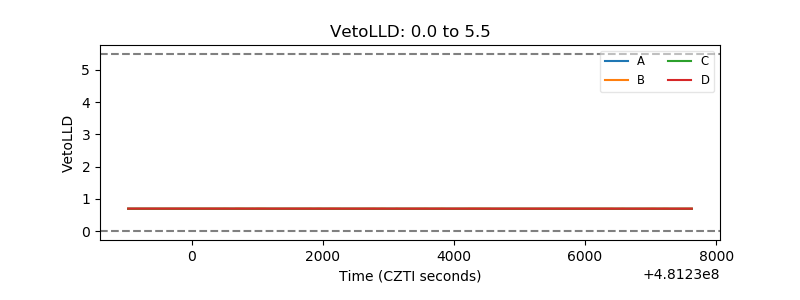 |
| Alpha Counter | 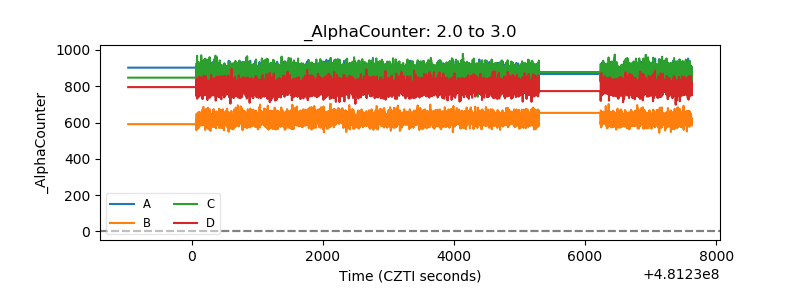 |
| _CPM_Rate | 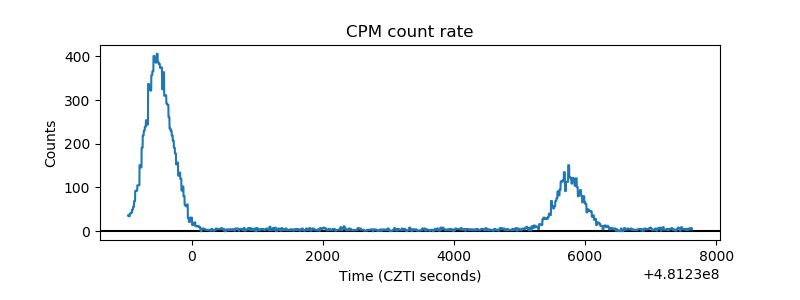 |
| CZT Counter | 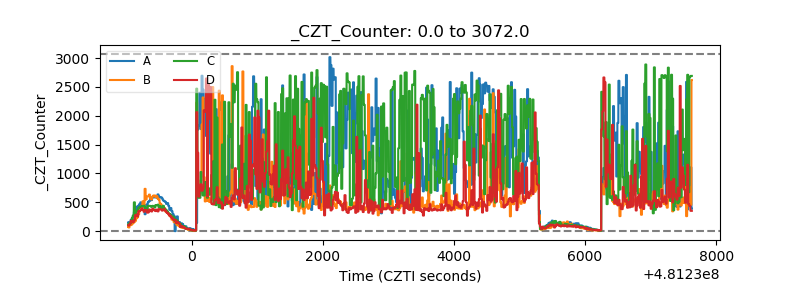 |
| +2.5 Volts monitor | 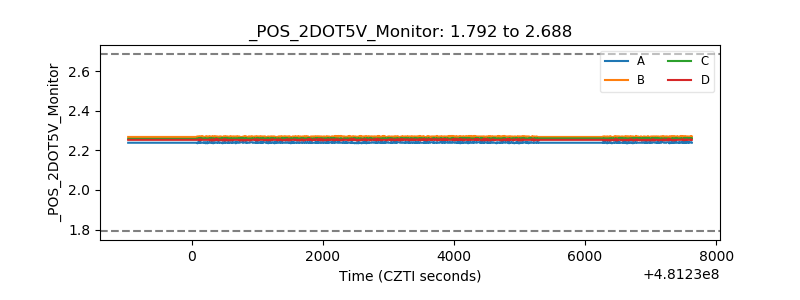 |
| +5 Volts monitor | 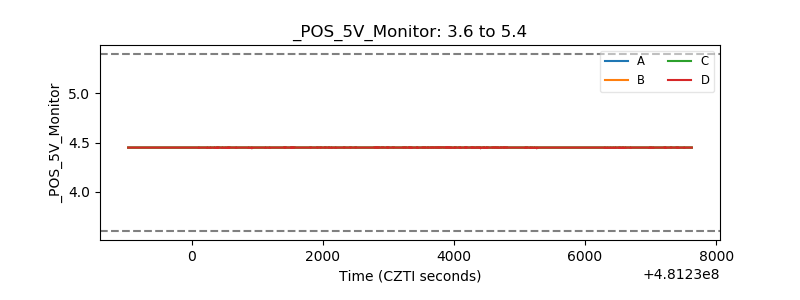 |
| _ROLL_ROT | 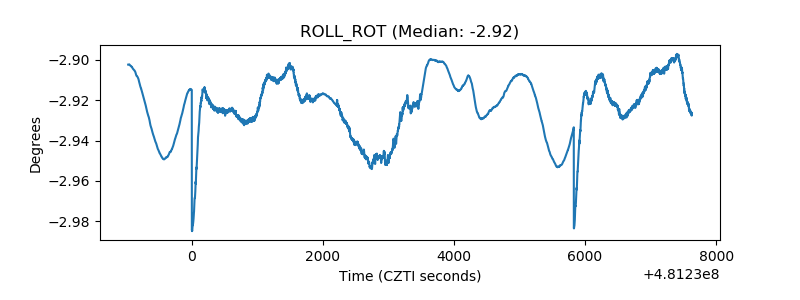 |
| _Roll_DEC | 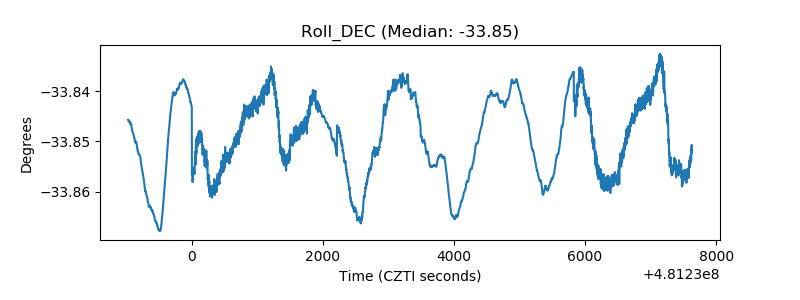 |
| _Roll_RA | 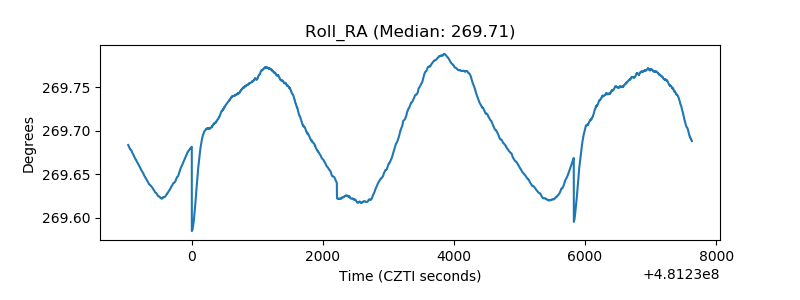 |
| Veto Counter | 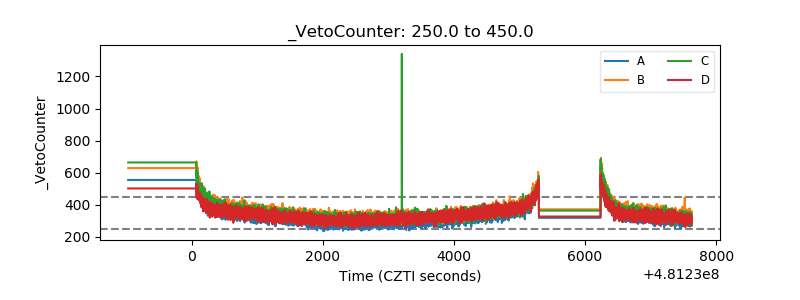 |