| Param | Original file | Final file |
|---|---|---|
| Filename | modeM0/AS1A13_090T01_9000006458_51440cztM0_level2.fits | modeM0/AS1A13_090T01_9000006458_51440cztM0_level2_quad_clean.evt |
| Size (bytes) | 758,352,960 | 93,562,560 |
| Size | 723.2 MB | 89.2 MB |
| Events in quadrant A | 7,319,678 | 629,396 |
| Events in quadrant B | 3,898,008 | 730,638 |
| Events in quadrant C | 11,373,335 | 381,294 |
| Events in quadrant D | 4,926,104 | 592,754 |
| Mode M0 | |||
|---|---|---|---|
| Quadrant | BADHDUFLAG | Total packets | Discarded packets |
| A | 0 | 26737 | 2 |
| B | 0 | 16622 | 2 |
| C | 0 | 38658 | 2 |
| D | 0 | 19749 | 2 |
| Mode M9 | |||
|---|---|---|---|
| Quadrant | BADHDUFLAG | Total packets | Discarded packets |
| A | 0 | 5 | 0 |
| B | 0 | 5 | 0 |
| C | 0 | 5 | 0 |
| D | 0 | 5 | 0 |
| Mode SS | |||
|---|---|---|---|
| Quadrant | BADHDUFLAG | Total packets | Discarded packets |
| A | 0 | 146 | 0 |
| B | 0 | 146 | 0 |
| C | 0 | 146 | 0 |
| D | 0 | 146 | 0 |
| Quadrant | Total seconds | Saturated seconds | Saturation percentage |
|---|---|---|---|
| A | 7162 | 648 | 9.047752% |
| B | 7161 | 125 | 1.745566% |
| C | 7161 | 3271 | 45.677978% |
| D | 7161 | 315 | 4.398827% |
Noise dominated data is calculated using 1-second bins in cleaned event files. If a bin has >2000 counts, and if more than 50% of those come from <1% of pixels, then it is considered to be noise-dominated and hence unusable.
| Quadrant | # 1 sec bins | Bins with >0 counts | Bins with >2000 counts | High rate bins dominated by noise | Noise dominated (total time) | Noise dominated (detector-on time) | Marked lightcurve |
|---|---|---|---|---|---|---|---|
| A | 7697 | 7162 | 491 | 491 | 6.38% | 6.86% | 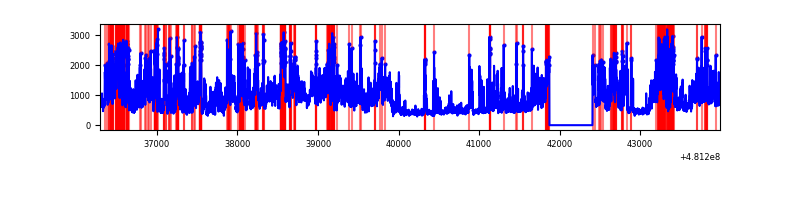 |
| B | 7696 | 7162 | 55 | 55 | 0.71% | 0.77% | 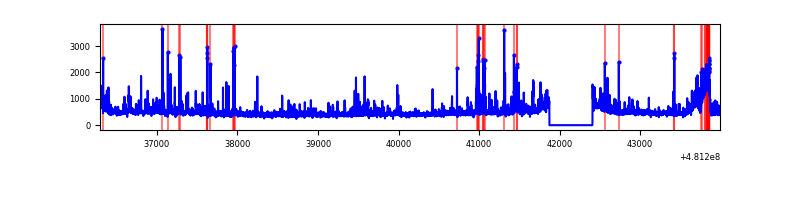 |
| C | 7696 | 7162 | 3035 | 3035 | 39.44% | 42.38% | 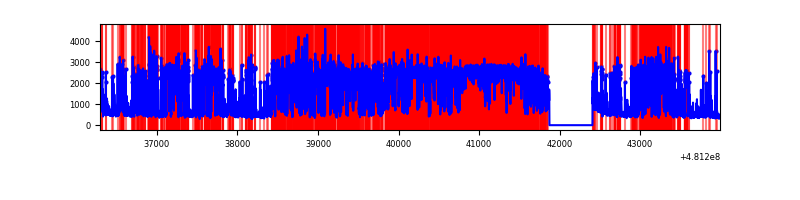 |
| D | 7696 | 7162 | 334 | 334 | 4.34% | 4.66% | 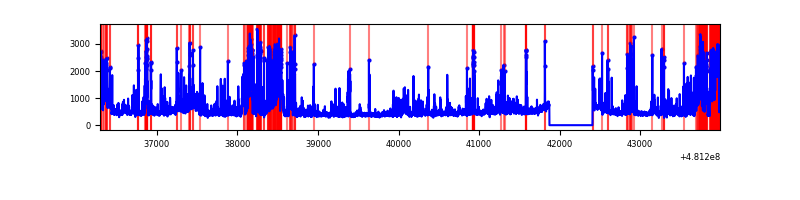 |
Top three noisy pixels from each quadrant. If the there are fewer than three noisy pixels in the level2.evt file, extra rows are filled as -1
| Pixel properties | Quadrant properties | ||||||
|---|---|---|---|---|---|---|---|
| Quadrant | DetID | PixID | Counts | Sigma | Mean | Median | Sigma |
| A | 12 | 3 | 2410148 | 13164.53 | 741 | 721 | 183.0 |
| A | 7 | 64 | 480558 | 2621.71 | 741 | 721 | 183.0 |
| A | 12 | 250 | 475001 | 2591.35 | 741 | 721 | 183.0 |
| B | 15 | 52 | 193231 | 1175.3 | 764 | 736 | 163.8 |
| B | 5 | 185 | 78584 | 475.31 | 764 | 736 | 163.8 |
| B | 4 | 170 | 60980 | 367.83 | 764 | 736 | 163.8 |
| C | 4 | 12 | 4586082 | 29621.24 | 558 | 553 | 154.8 |
| C | 0 | 176 | 2174664 | 14044.15 | 558 | 553 | 154.8 |
| C | 15 | 179 | 1430503 | 9237.08 | 558 | 553 | 154.8 |
| D | 3 | 12 | 533946 | 2609.41 | 729 | 701 | 204.4 |
| D | 6 | 42 | 407555 | 1990.92 | 729 | 701 | 204.4 |
| D | 15 | 234 | 253614 | 1237.62 | 729 | 701 | 204.4 |
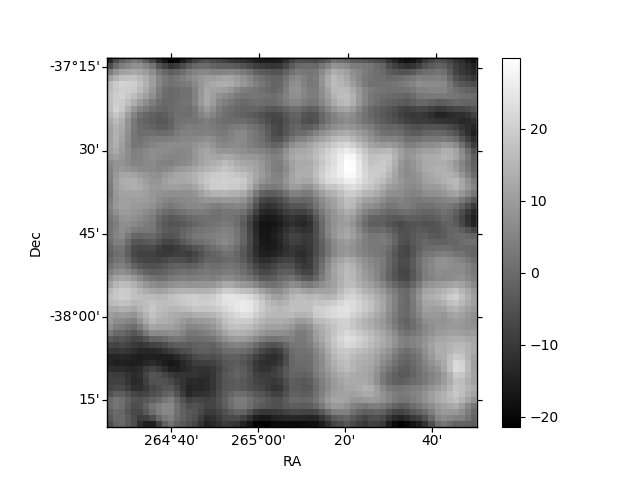
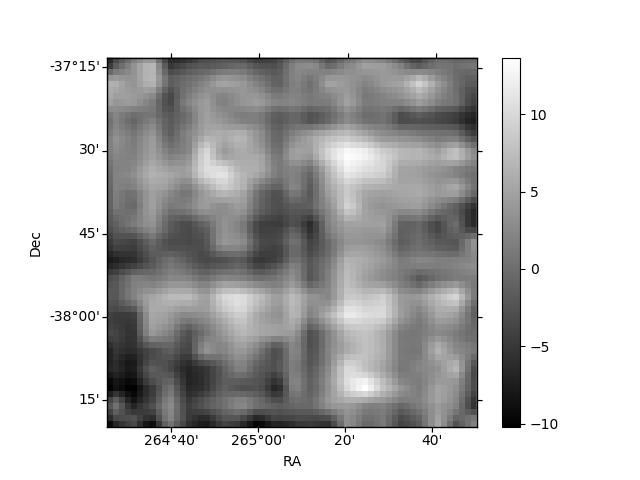
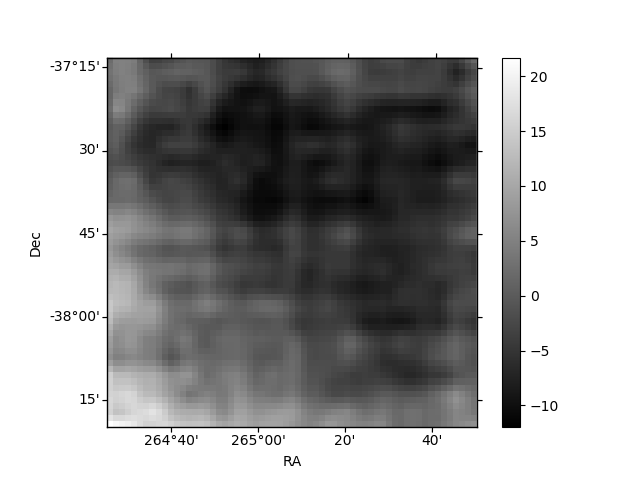
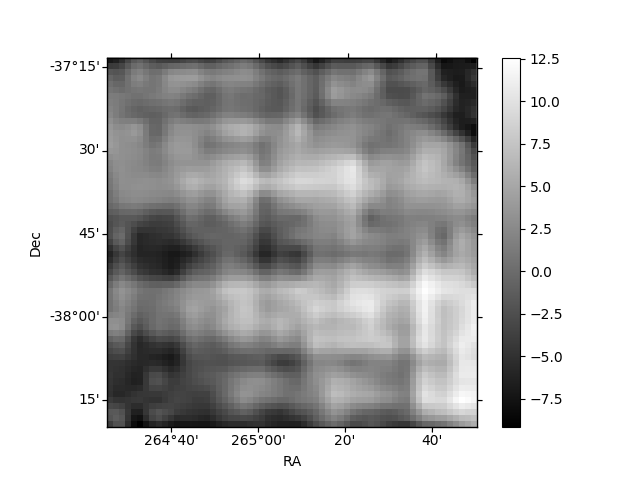
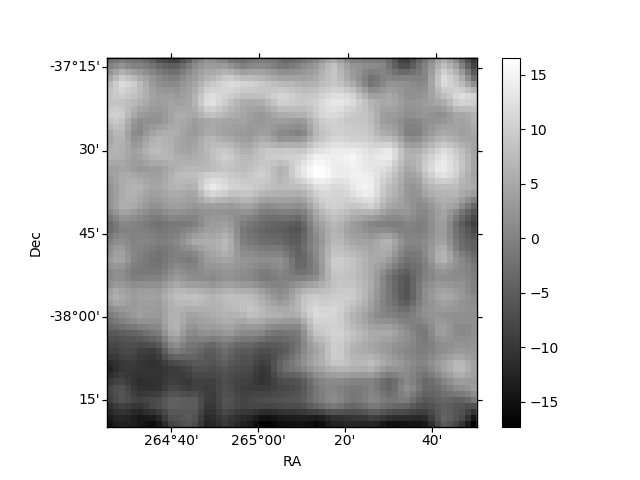
Histogram calculated using DETX and DETY for each event in the final _common_clean file
| Quadrant A | 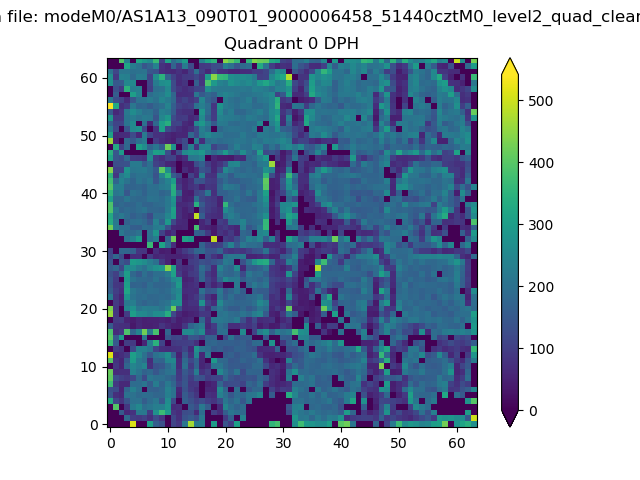 |
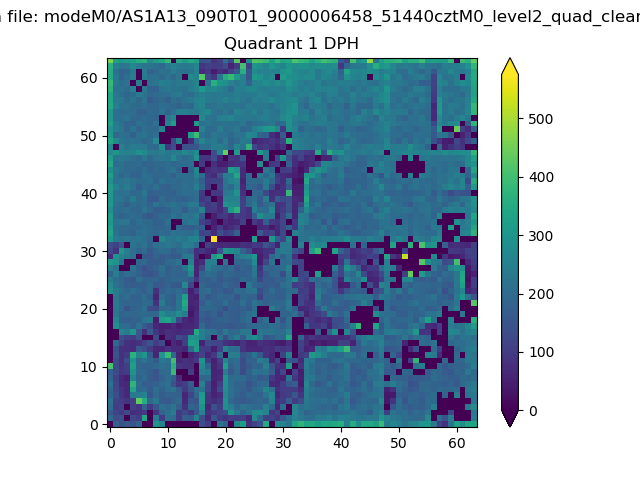 |
Quadrant B |
|---|---|---|---|
| Quadrant D | 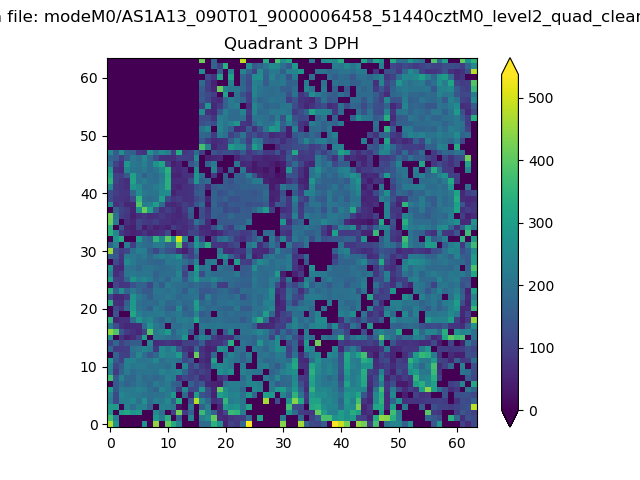 |
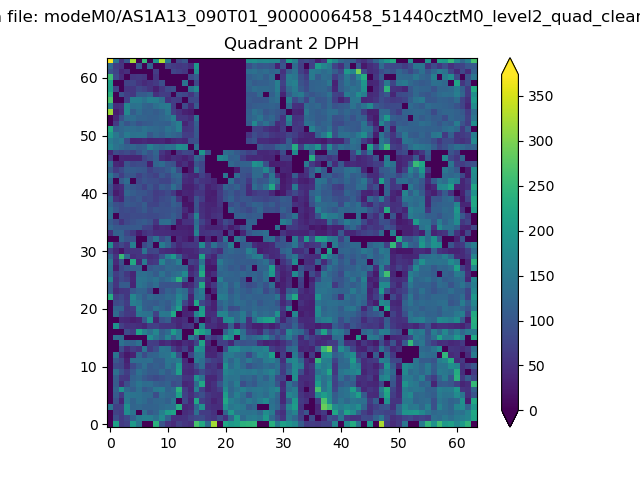 |
Quadrant C |
| Plot type | Count rate plots | Images |
|---|---|---|
| Comparison with Poisson distribution Blue bars denote a histogram of data divided into 1 sec bins. Red curve is a Poisson curve with rate = median count rate of data. |
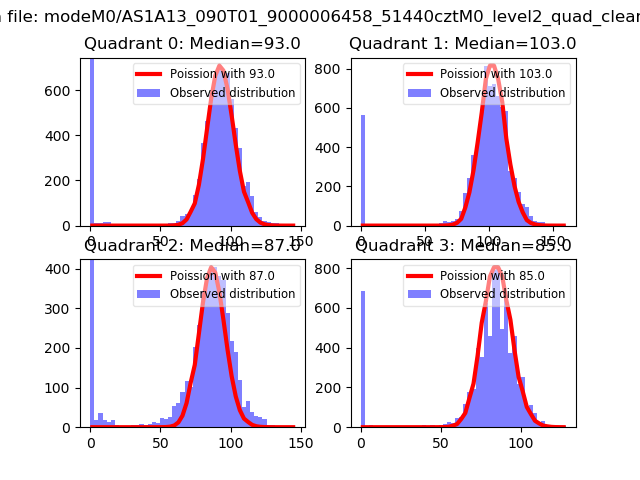 |
 |
| Quadrant-wise count rates Data is divided into 100 sec bins |
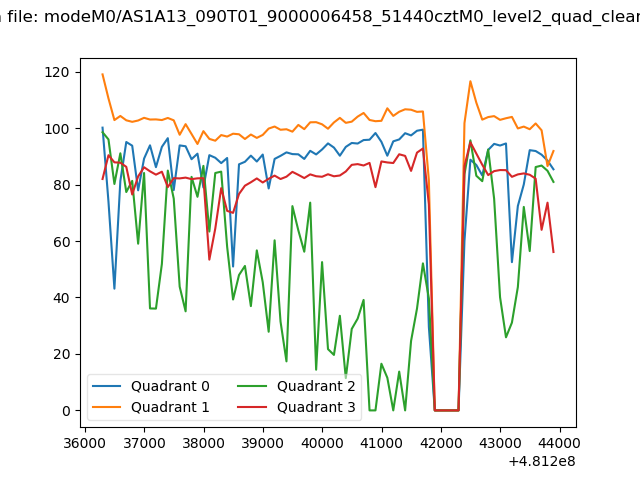 |
|
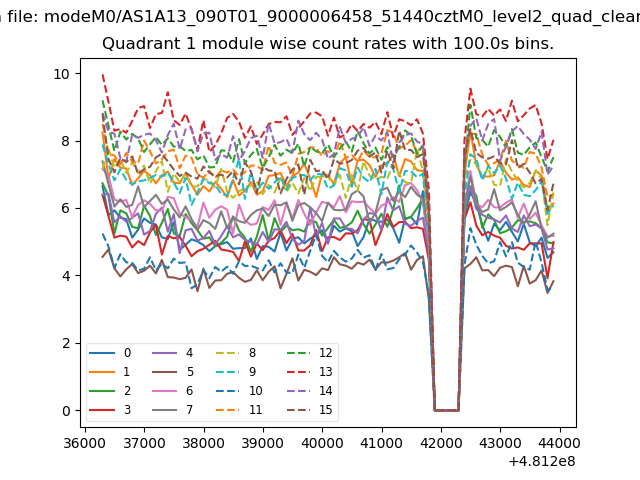
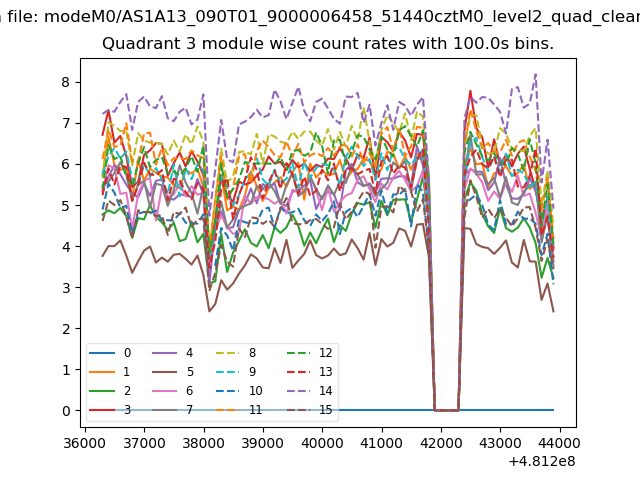
| Module-wise count rates for Quadrant A Data is divided into 100 sec bins |
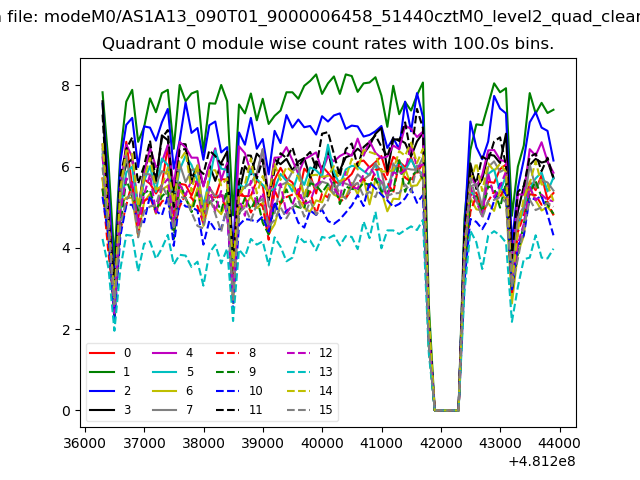 |
 |
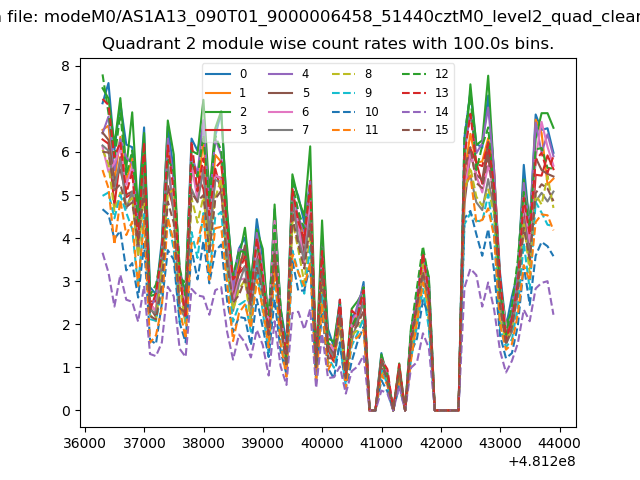
| Module-wise count rates for Quadrant B Data is divided into 100 sec bins |
 |
 |
| Module-wise count rates for Quadrant C Data is divided into 100 sec bins |
 |
 |
| Module-wise count rates for Quadrant D Data is divided into 100 sec bins |
 |
 |
| Parameter | Plot |
|---|---|
| CZT HV Monitor | 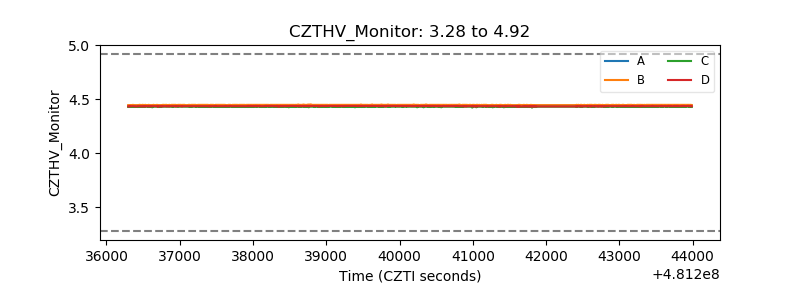 |
| D_VDD | 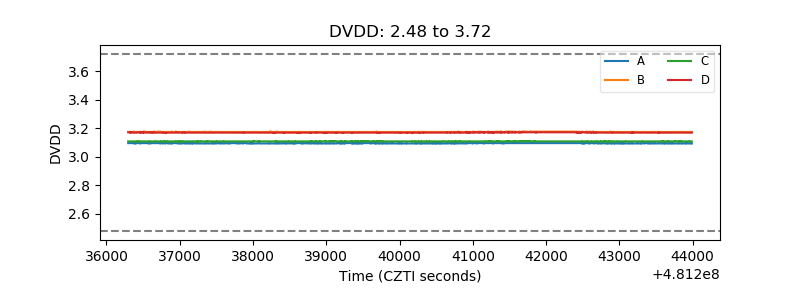 |
| Temperature 1 | 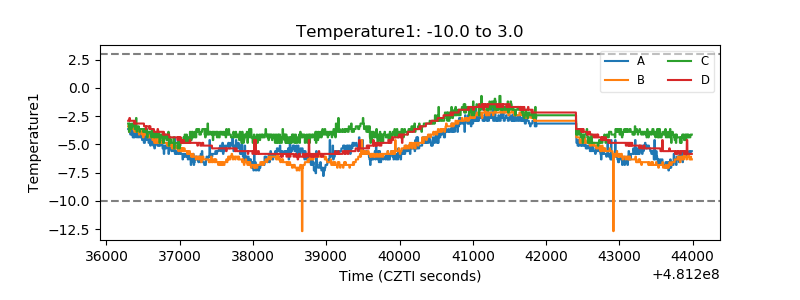 |
| Veto HV Monitor | 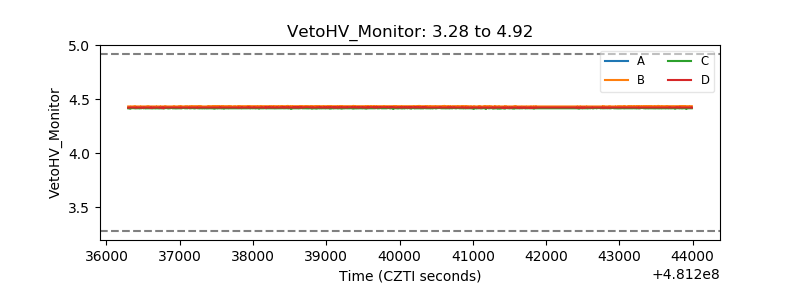 |
| Veto LLD | 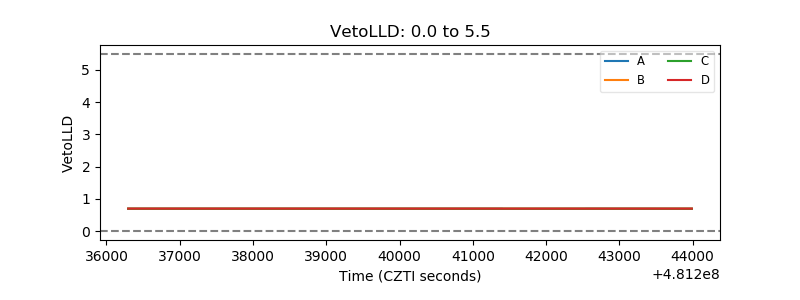 |
| Alpha Counter | 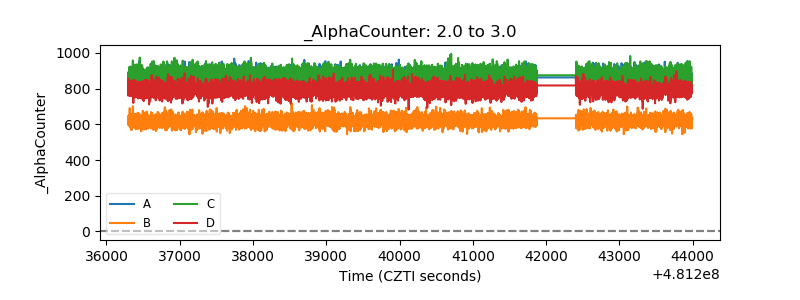 |
| _CPM_Rate | 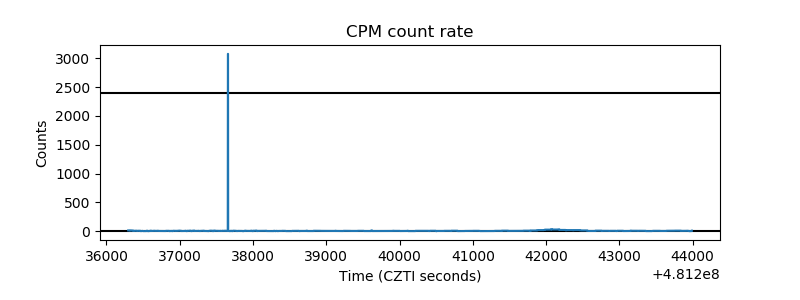 |
| CZT Counter | 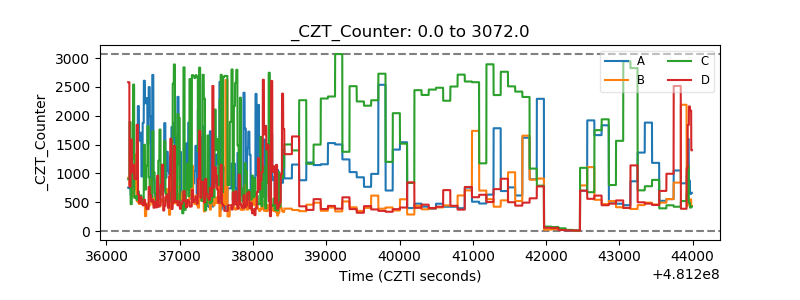 |
| +2.5 Volts monitor | 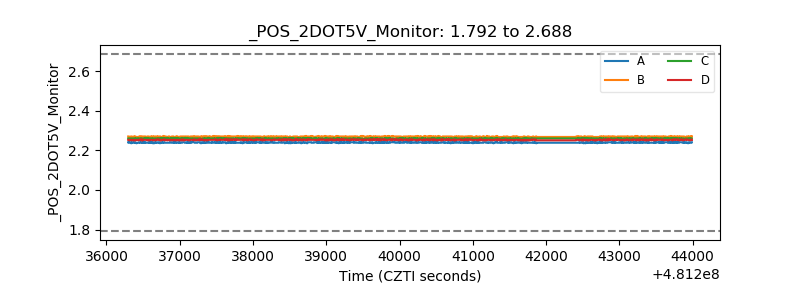 |
| +5 Volts monitor | 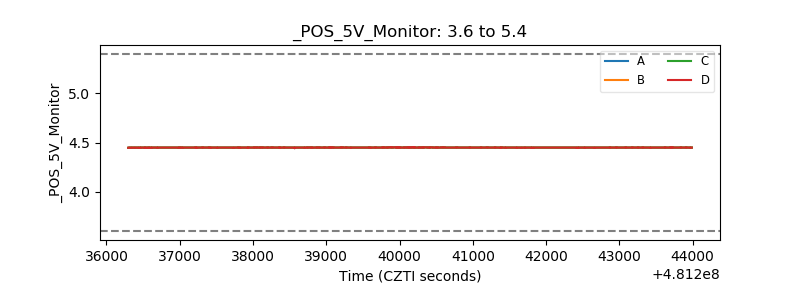 |
| _ROLL_ROT | 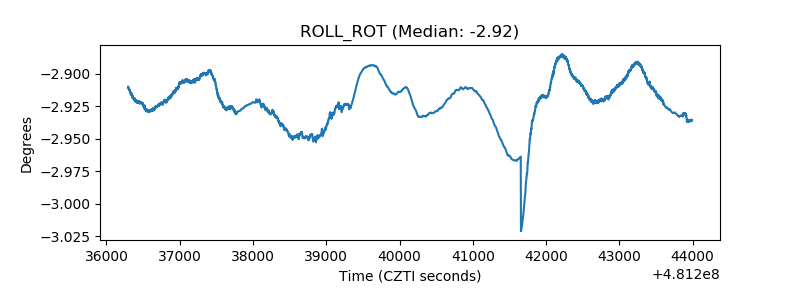 |
| _Roll_DEC | 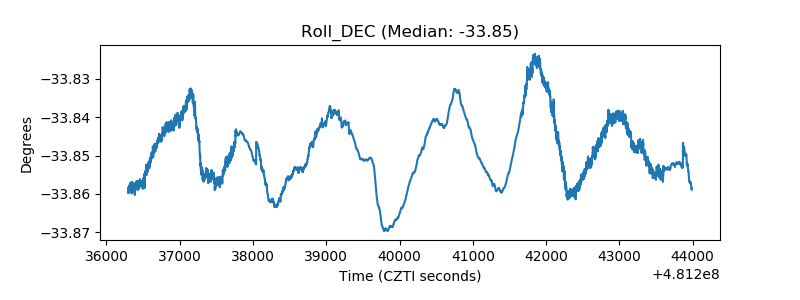 |
| _Roll_RA | 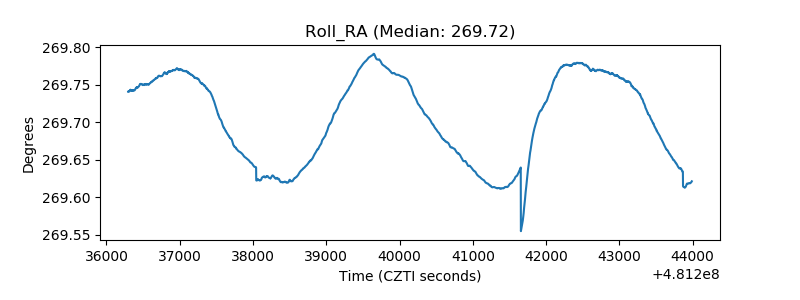 |
| Veto Counter | 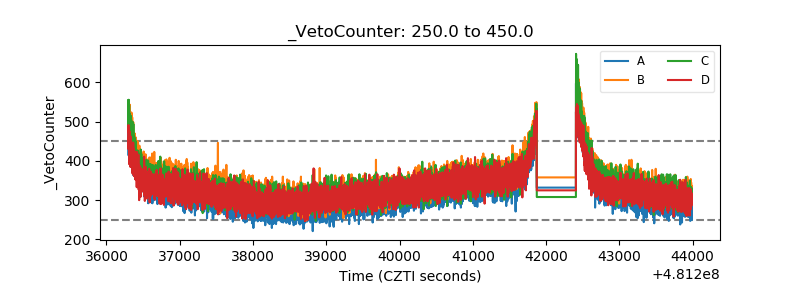 |