| Param | Original file | Final file |
|---|---|---|
| Filename | modeM0/AS1A13_090T01_9000006458_51441cztM0_level2.fits | modeM0/AS1A13_090T01_9000006458_51441cztM0_level2_quad_clean.evt |
| Size (bytes) | 1,004,304,960 | 98,040,960 |
| Size | 957.8 MB | 93.5 MB |
| Events in quadrant A | 9,768,427 | 677,758 |
| Events in quadrant B | 4,911,361 | 821,807 |
| Events in quadrant C | 17,094,228 | 222,779 |
| Events in quadrant D | 4,774,466 | 682,160 |
| Mode M0 | |||
|---|---|---|---|
| Quadrant | BADHDUFLAG | Total packets | Discarded packets |
| A | 0 | 34725 | 1 |
| B | 0 | 20134 | 1 |
| C | 0 | 56376 | 1 |
| D | 0 | 20109 | 1 |
| Mode M9 | |||
|---|---|---|---|
| Quadrant | BADHDUFLAG | Total packets | Discarded packets |
| A | 0 | 5 | 0 |
| B | 0 | 5 | 0 |
| C | 0 | 5 | 0 |
| D | 0 | 5 | 0 |
| Mode SS | |||
|---|---|---|---|
| Quadrant | BADHDUFLAG | Total packets | Discarded packets |
| A | 0 | 164 | 0 |
| B | 0 | 164 | 0 |
| C | 0 | 164 | 0 |
| D | 0 | 164 | 0 |
| Quadrant | Total seconds | Saturated seconds | Saturation percentage |
|---|---|---|---|
| A | 8112 | 1177 | 14.509369% |
| B | 8113 | 170 | 2.095402% |
| C | 8113 | 5927 | 73.055590% |
| D | 8113 | 175 | 2.157032% |
Noise dominated data is calculated using 1-second bins in cleaned event files. If a bin has >2000 counts, and if more than 50% of those come from <1% of pixels, then it is considered to be noise-dominated and hence unusable.
| Quadrant | # 1 sec bins | Bins with >0 counts | Bins with >2000 counts | High rate bins dominated by noise | Noise dominated (total time) | Noise dominated (detector-on time) | Marked lightcurve |
|---|---|---|---|---|---|---|---|
| A | 8647 | 8112 | 768 | 768 | 8.88% | 9.47% |  |
| B | 8648 | 8114 | 78 | 78 | 0.90% | 0.96% |  |
| C | 8647 | 8113 | 5639 | 5639 | 65.21% | 69.51% | 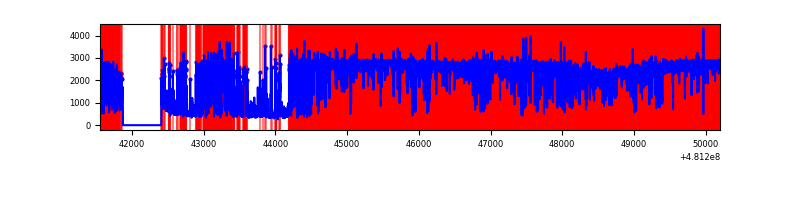 |
| D | 8648 | 8114 | 201 | 201 | 2.32% | 2.48% |  |
Top three noisy pixels from each quadrant. If the there are fewer than three noisy pixels in the level2.evt file, extra rows are filled as -1
| Pixel properties | Quadrant properties | ||||||
|---|---|---|---|---|---|---|---|
| Quadrant | DetID | PixID | Counts | Sigma | Mean | Median | Sigma |
| A | 12 | 3 | 3299432 | 15759.59 | 843 | 821 | 209.3 |
| A | 12 | 250 | 1034218 | 4937.2 | 843 | 821 | 209.3 |
| A | 7 | 64 | 846547 | 4040.58 | 843 | 821 | 209.3 |
| B | 10 | 254 | 517755 | 2750.8 | 882 | 850 | 187.9 |
| B | 15 | 52 | 216238 | 1146.22 | 882 | 850 | 187.9 |
| B | 12 | 32 | 104917 | 553.81 | 882 | 850 | 187.9 |
| C | 4 | 12 | 11224680 | 91125.11 | 452 | 450 | 123.2 |
| C | 15 | 179 | 2654842 | 21549.97 | 452 | 450 | 123.2 |
| C | 0 | 176 | 510954 | 4144.58 | 452 | 450 | 123.2 |
| D | 3 | 12 | 594039 | 2504.5 | 852 | 819 | 236.9 |
| D | 7 | 96 | 135777 | 569.77 | 852 | 819 | 236.9 |
| D | 6 | 42 | 128052 | 537.16 | 852 | 819 | 236.9 |
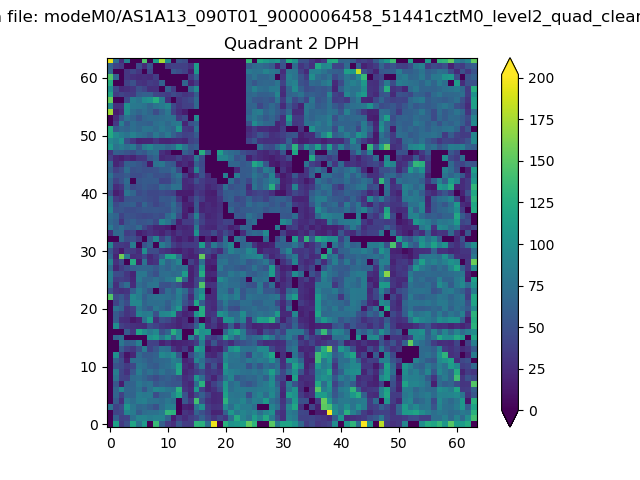
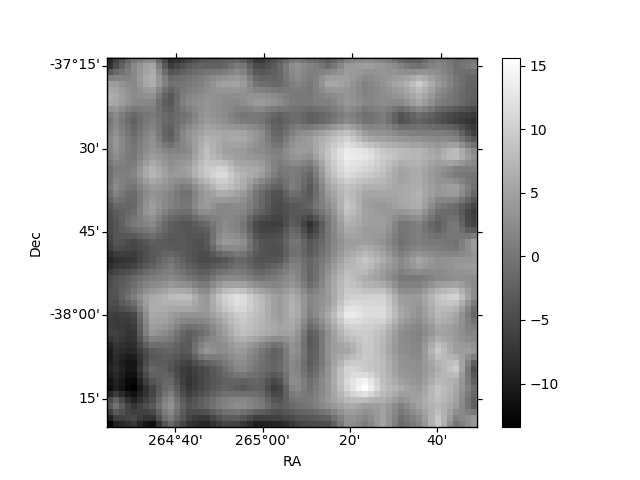
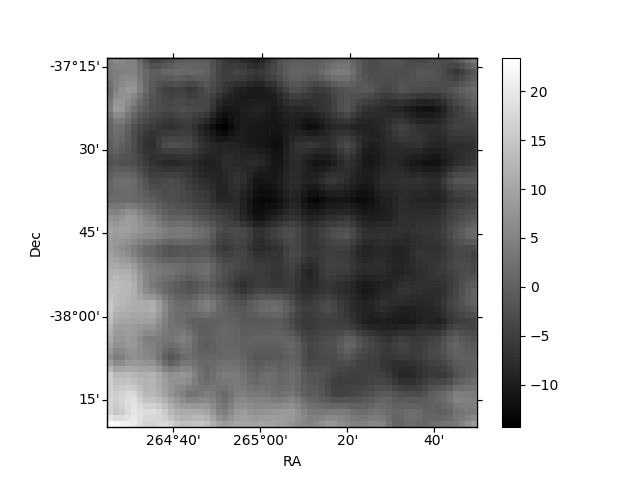
Histogram calculated using DETX and DETY for each event in the final _common_clean file
| Quadrant A | 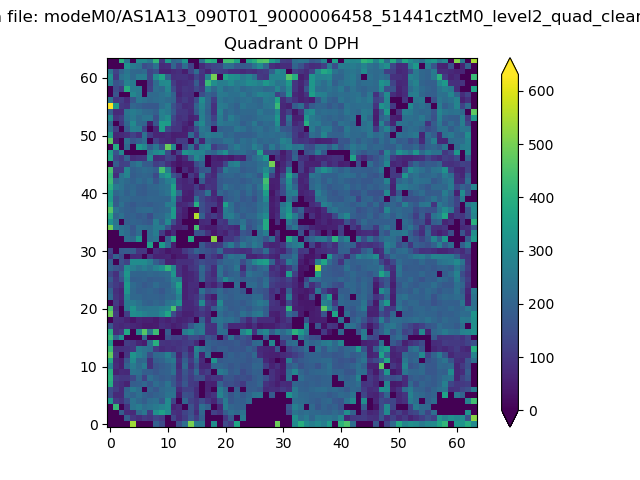 |
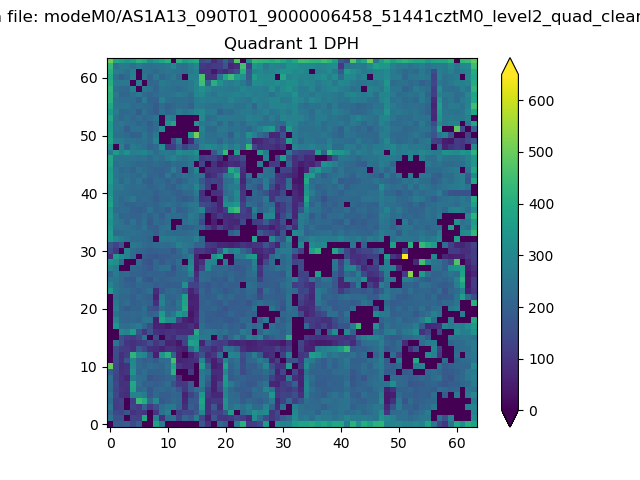 |
Quadrant B |
|---|---|---|---|
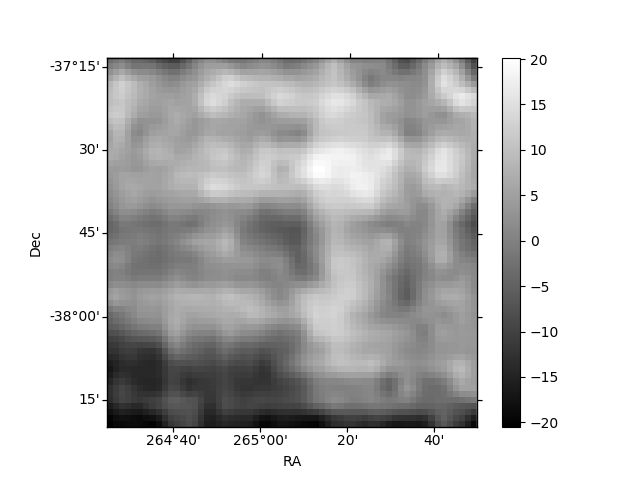
| Quadrant D | 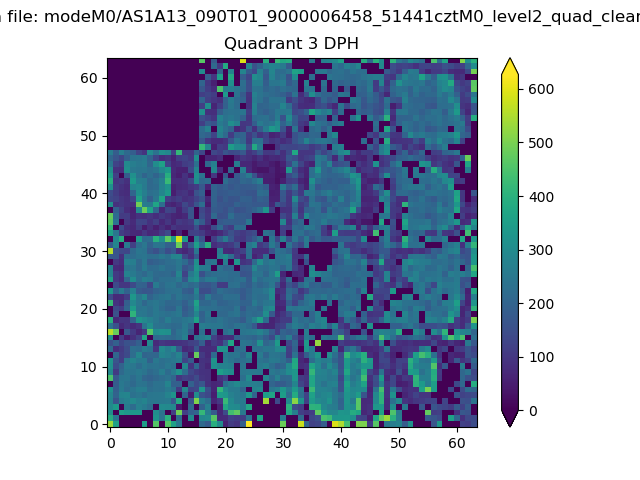 |
 |
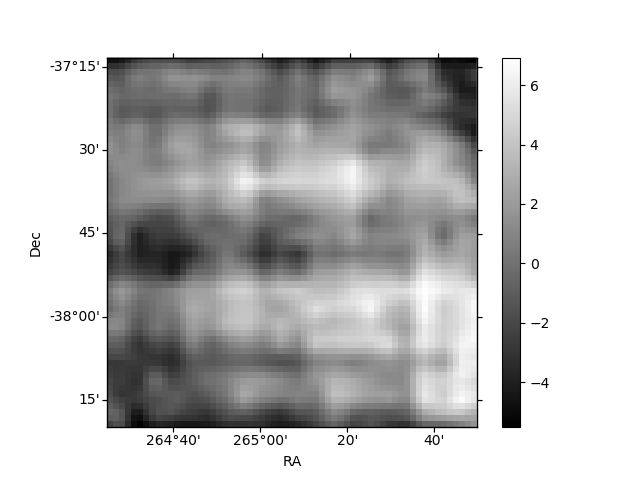
Quadrant C |
| Plot type | Count rate plots | Images |
|---|---|---|
| Comparison with Poisson distribution Blue bars denote a histogram of data divided into 1 sec bins. Red curve is a Poisson curve with rate = median count rate of data. |
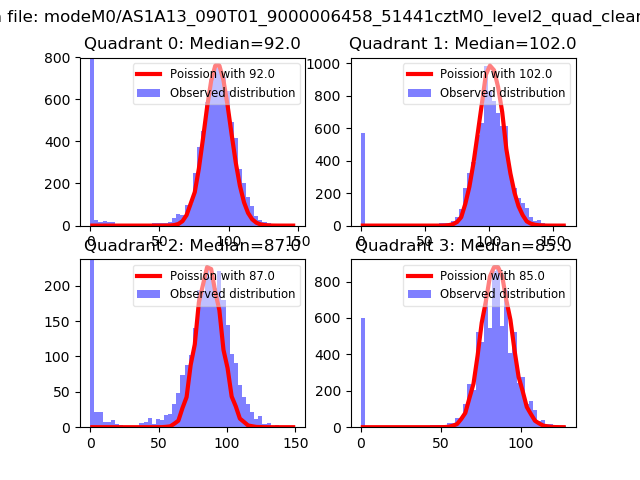 |
 |
| Quadrant-wise count rates Data is divided into 100 sec bins |
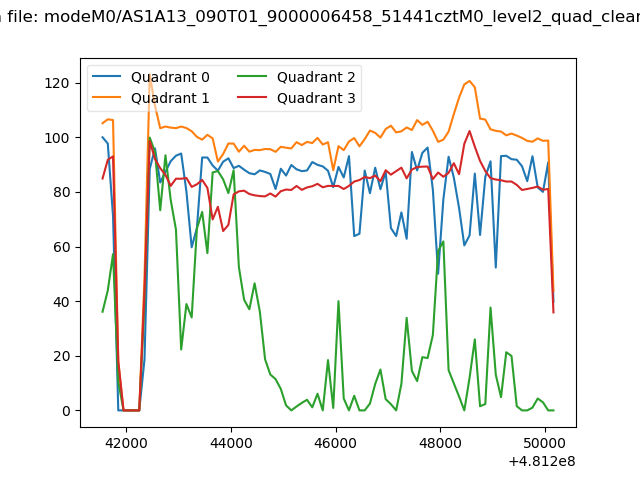 |
|
| Module-wise count rates for Quadrant A Data is divided into 100 sec bins |
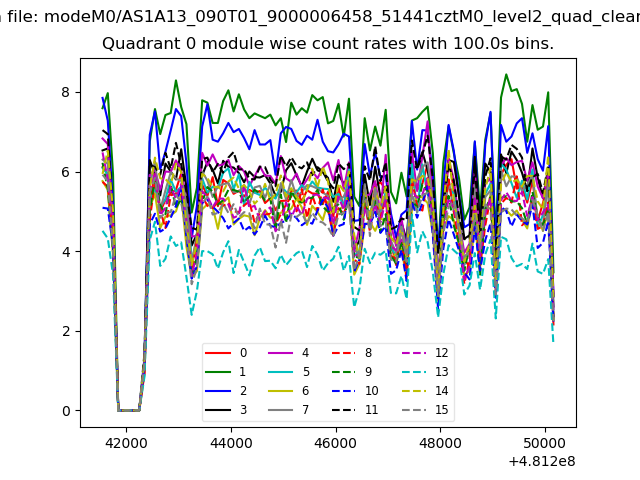 |
 |
| Module-wise count rates for Quadrant B Data is divided into 100 sec bins |
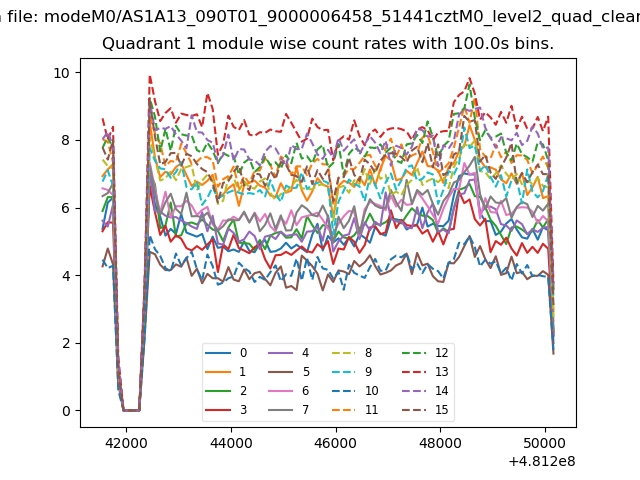 |
 |
| Module-wise count rates for Quadrant C Data is divided into 100 sec bins |
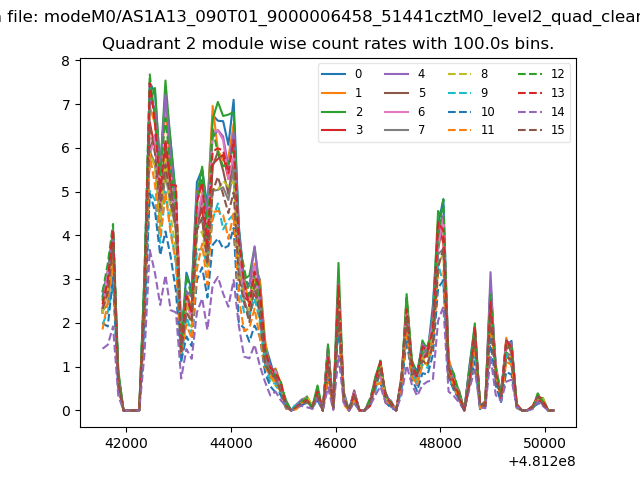 |
 |
| Module-wise count rates for Quadrant D Data is divided into 100 sec bins |
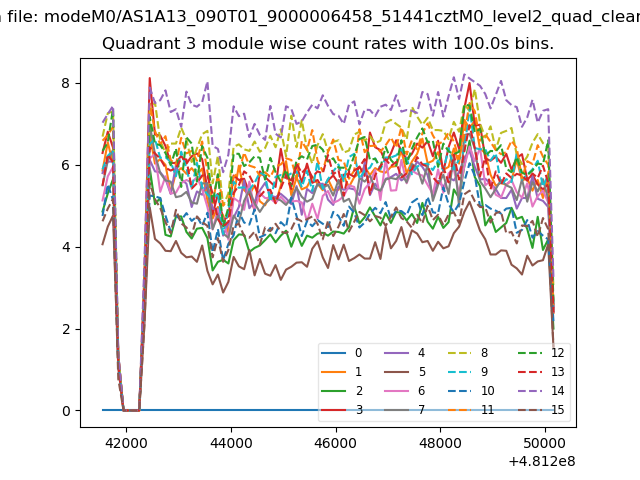 |
 |
| Parameter | Plot |
|---|---|
| CZT HV Monitor | 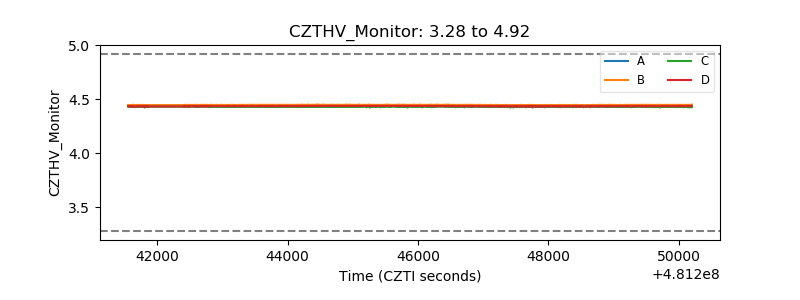 |
| D_VDD | 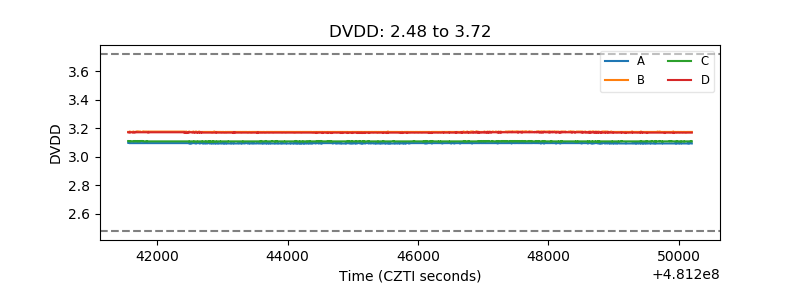 |
| Temperature 1 | 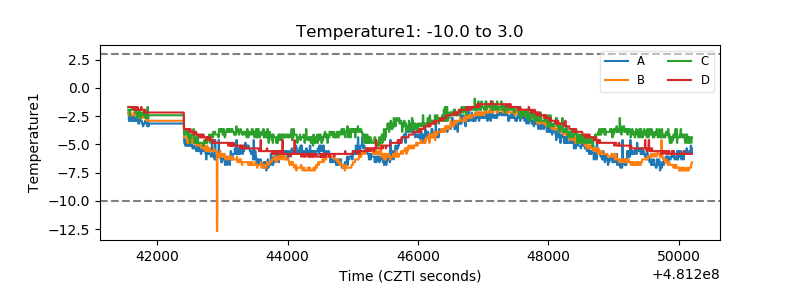 |
| Veto HV Monitor | 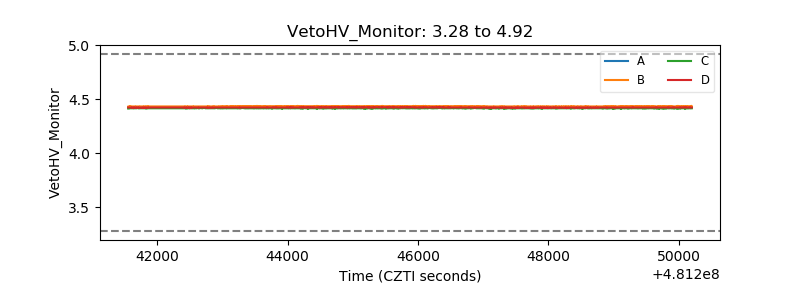 |
| Veto LLD | 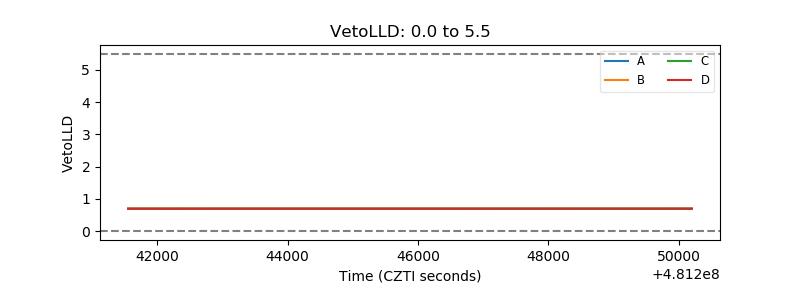 |
| Alpha Counter | 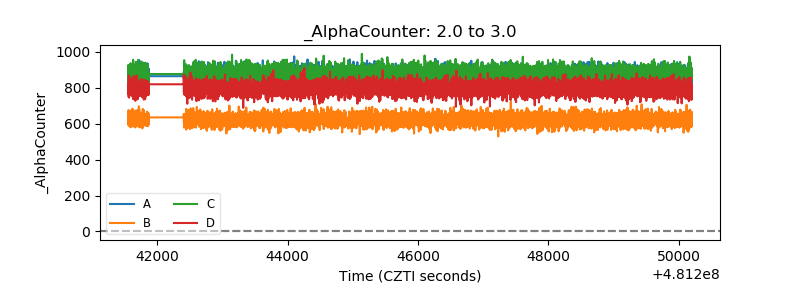 |
| _CPM_Rate | 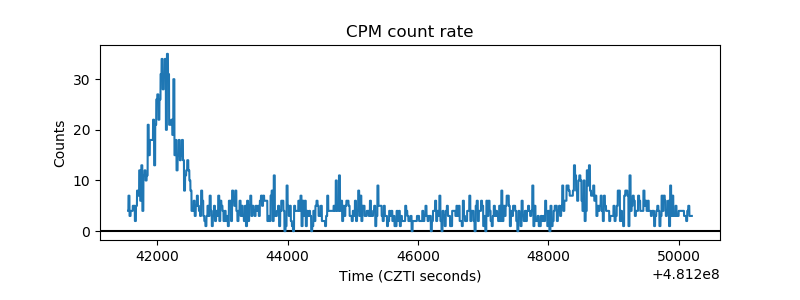 |
| CZT Counter | 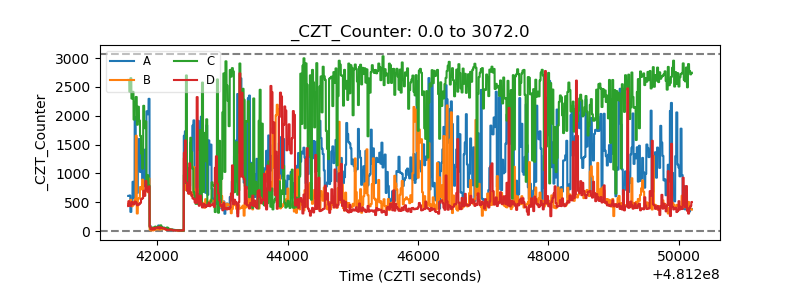 |
| +2.5 Volts monitor | 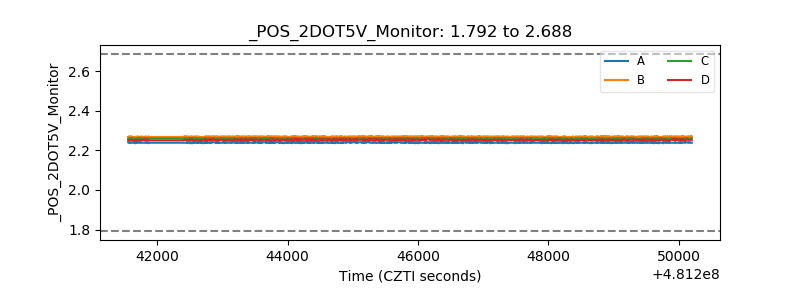 |
| +5 Volts monitor | 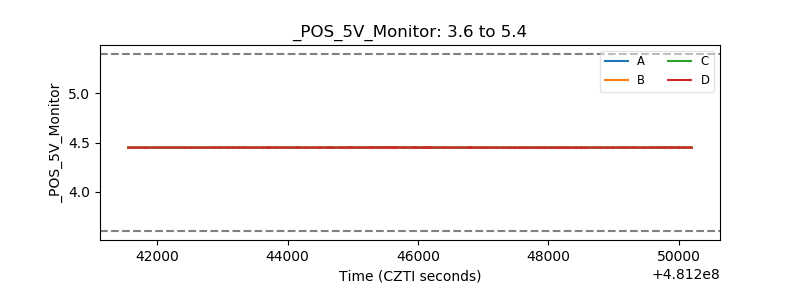 |
| _ROLL_ROT | 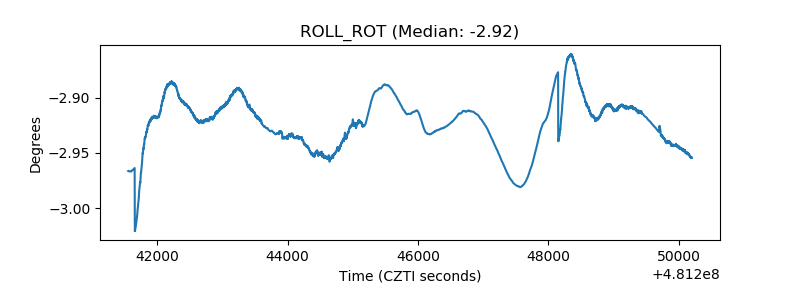 |
| _Roll_DEC | 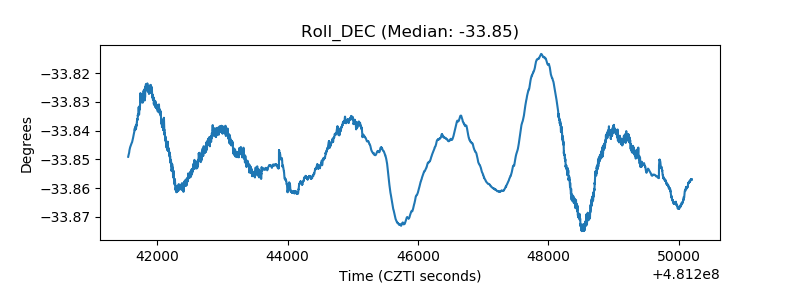 |
| _Roll_RA | 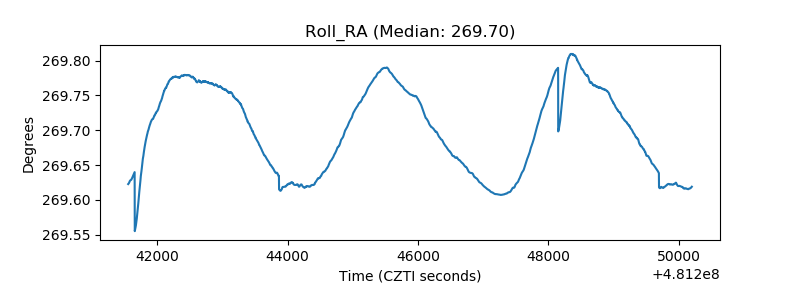 |
| Veto Counter | 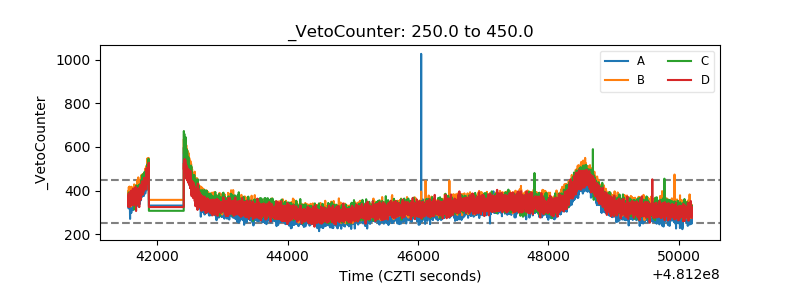 |