| Param | Original file | Final file |
|---|---|---|
| Filename | modeM0/AS1A13_090T01_9000006458_51442cztM0_level2.fits | modeM0/AS1A13_090T01_9000006458_51442cztM0_level2_quad_clean.evt |
| Size (bytes) | 957,576,960 | 90,414,720 |
| Size | 913.2 MB | 86.2 MB |
| Events in quadrant A | 8,454,071 | 656,406 |
| Events in quadrant B | 4,628,299 | 750,765 |
| Events in quadrant C | 17,465,617 | 149,780 |
| Events in quadrant D | 4,296,941 | 640,619 |
| Mode M0 | |||
|---|---|---|---|
| Quadrant | BADHDUFLAG | Total packets | Discarded packets |
| A | 0 | 30652 | 3 |
| B | 0 | 19274 | 0 |
| C | 0 | 57190 | 0 |
| D | 0 | 18568 | 0 |
| Mode SS | |||
|---|---|---|---|
| Quadrant | BADHDUFLAG | Total packets | Discarded packets |
| A | 0 | 154 | 0 |
| B | 0 | 154 | 0 |
| C | 0 | 154 | 0 |
| D | 0 | 154 | 0 |
| Quadrant | Total seconds | Saturated seconds | Saturation percentage |
|---|---|---|---|
| A | 7763 | 919 | 11.838207% |
| B | 7763 | 313 | 4.031946% |
| C | 7763 | 6435 | 82.893211% |
| D | 7764 | 163 | 2.099433% |
Noise dominated data is calculated using 1-second bins in cleaned event files. If a bin has >2000 counts, and if more than 50% of those come from <1% of pixels, then it is considered to be noise-dominated and hence unusable.
| Quadrant | # 1 sec bins | Bins with >0 counts | Bins with >2000 counts | High rate bins dominated by noise | Noise dominated (total time) | Noise dominated (detector-on time) | Marked lightcurve |
|---|---|---|---|---|---|---|---|
| A | 7763 | 7763 | 839 | 839 | 10.81% | 10.81% | 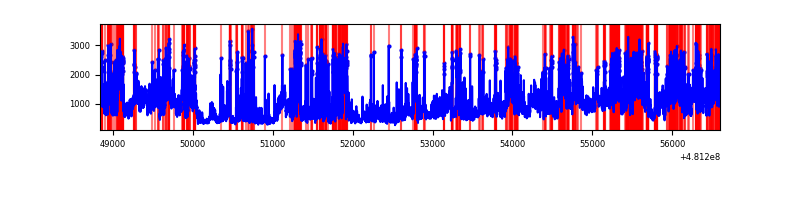 |
| B | 7763 | 7763 | 275 | 275 | 3.54% | 3.54% | 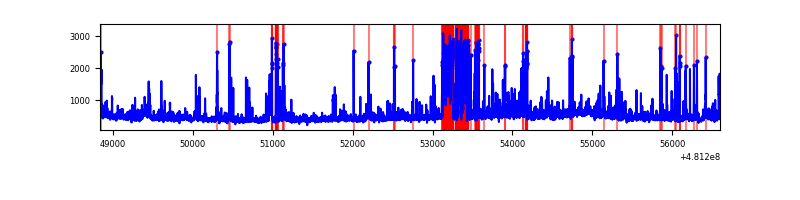 |
| C | 7762 | 7762 | 6067 | 6067 | 78.16% | 78.16% | 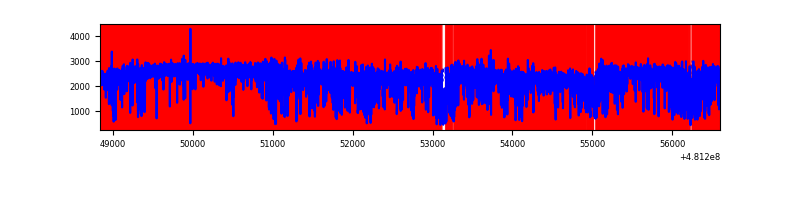 |
| D | 7764 | 7764 | 158 | 158 | 2.04% | 2.04% | 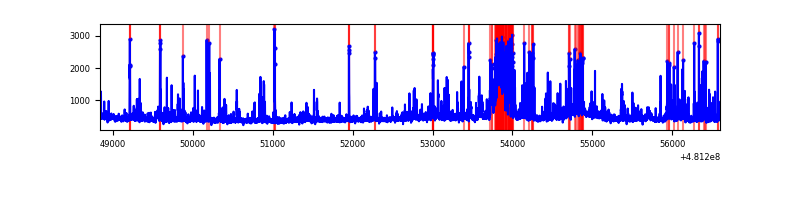 |
Top three noisy pixels from each quadrant. If the there are fewer than three noisy pixels in the level2.evt file, extra rows are filled as -1
| Pixel properties | Quadrant properties | ||||||
|---|---|---|---|---|---|---|---|
| Quadrant | DetID | PixID | Counts | Sigma | Mean | Median | Sigma |
| A | 12 | 3 | 2066925 | 10629.32 | 780 | 761 | 194.4 |
| A | 7 | 64 | 1218131 | 6262.73 | 780 | 761 | 194.4 |
| A | 12 | 250 | 826503 | 4248.01 | 780 | 761 | 194.4 |
| B | 0 | 172 | 553786 | 3225.85 | 799 | 771 | 171.4 |
| B | 12 | 32 | 205211 | 1192.54 | 799 | 771 | 171.4 |
| B | 4 | 81 | 93007 | 538.03 | 799 | 771 | 171.4 |
| C | 15 | 179 | 9015551 | 77963.57 | 422 | 419 | 115.6 |
| C | 4 | 12 | 6020150 | 52059.11 | 422 | 419 | 115.6 |
| C | 10 | 171 | 319934 | 2763.19 | 422 | 419 | 115.6 |
| D | 3 | 12 | 524575 | 2381.98 | 783 | 754 | 219.9 |
| D | 7 | 96 | 140997 | 637.73 | 783 | 754 | 219.9 |
| D | 10 | 172 | 72423 | 325.9 | 783 | 754 | 219.9 |
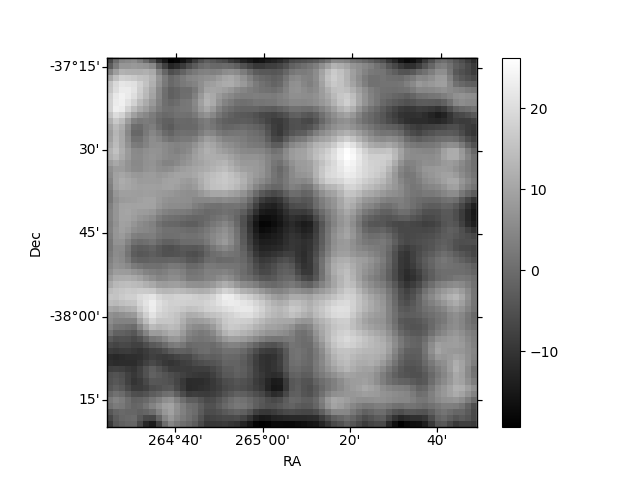
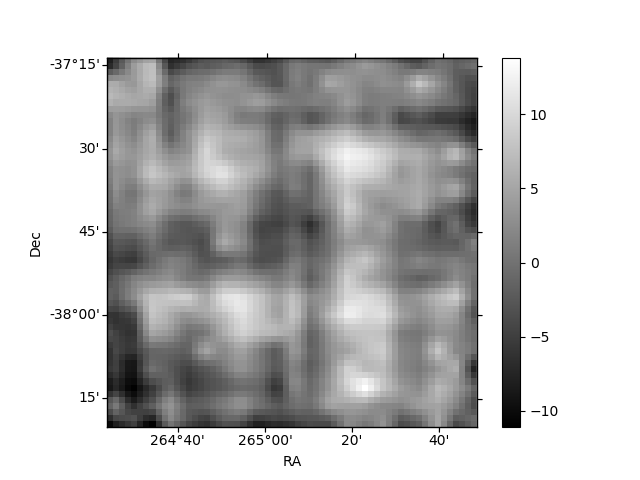
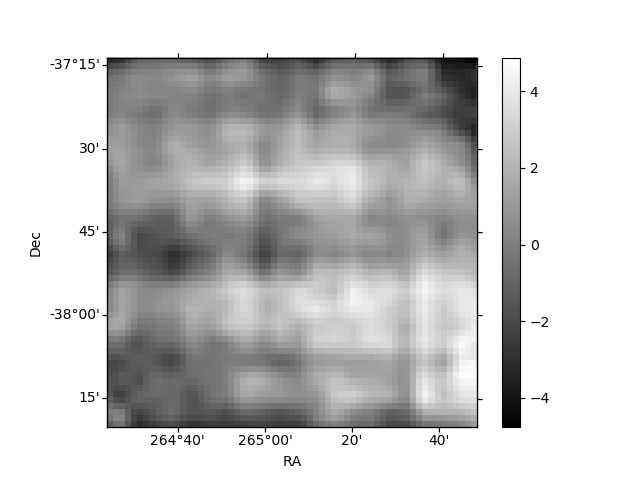
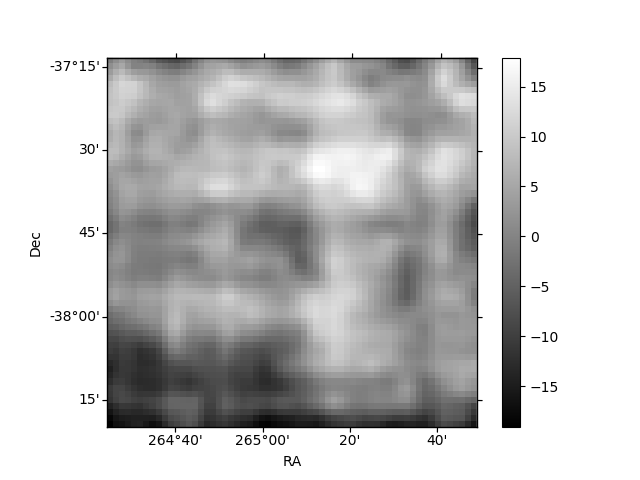
Histogram calculated using DETX and DETY for each event in the final _common_clean file
| Quadrant A | 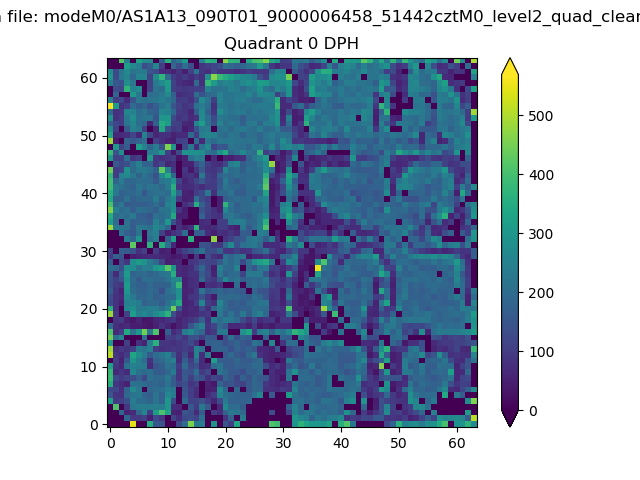 |
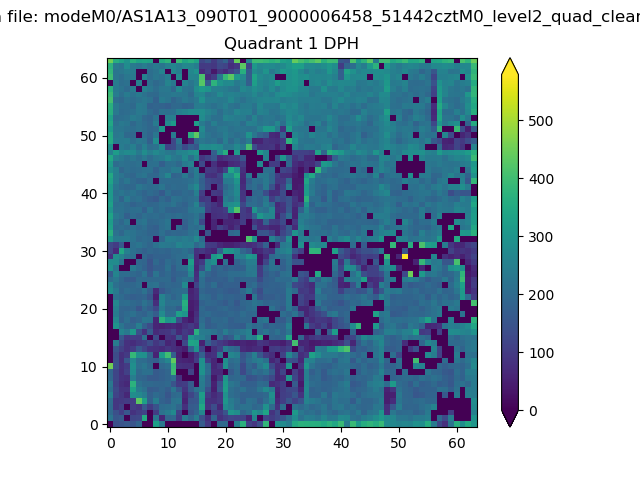 |
Quadrant B |
|---|---|---|---|
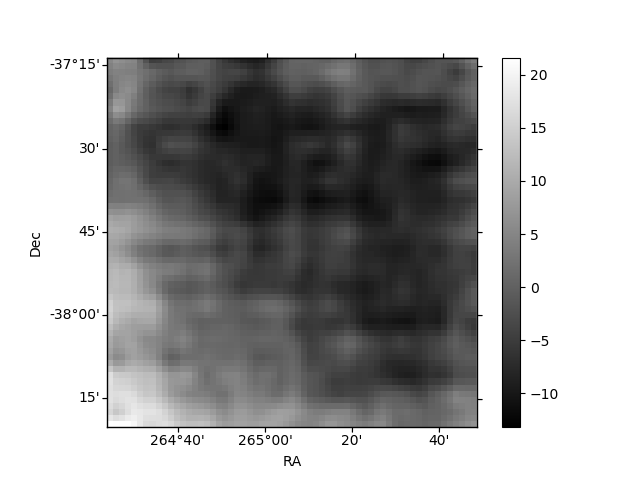
| Quadrant D | 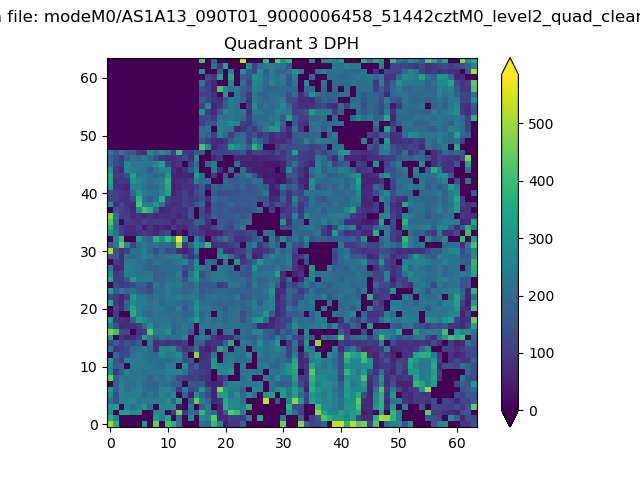 |
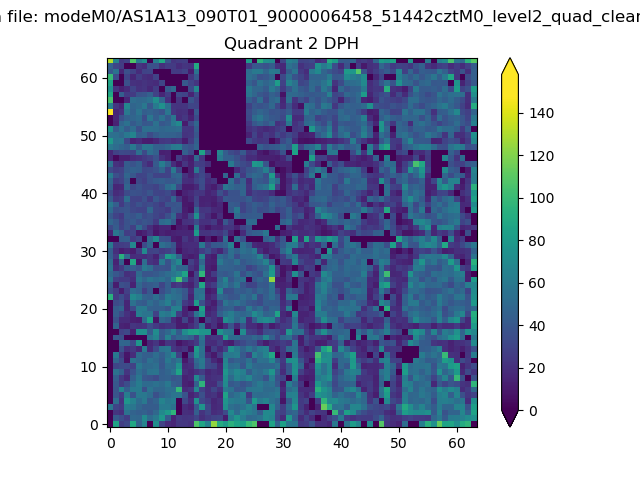 |
Quadrant C |
| Plot type | Count rate plots | Images |
|---|---|---|
| Comparison with Poisson distribution Blue bars denote a histogram of data divided into 1 sec bins. Red curve is a Poisson curve with rate = median count rate of data. |
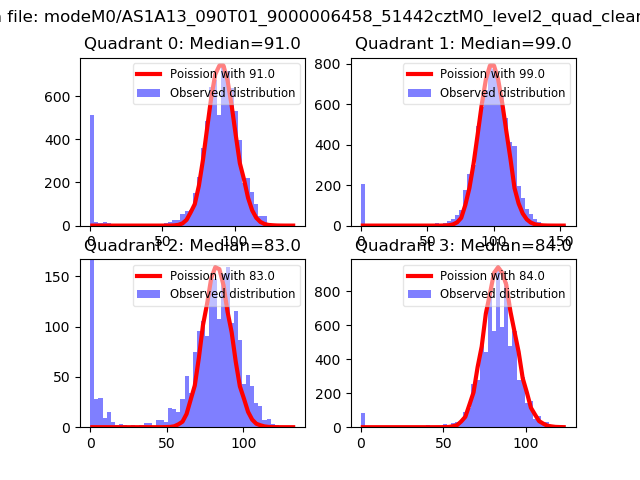 |
 |
| Quadrant-wise count rates Data is divided into 100 sec bins |
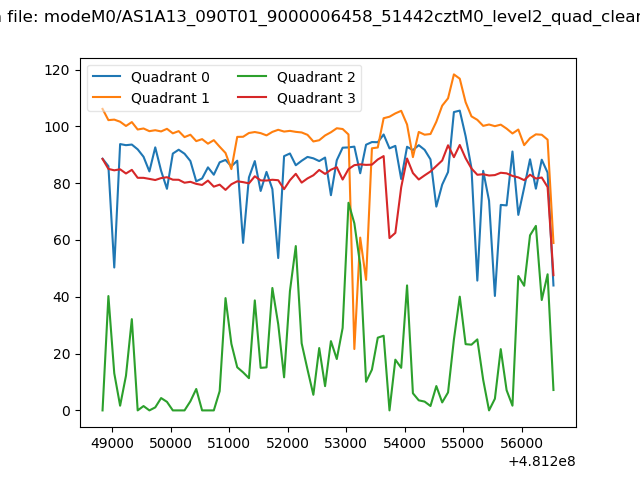 |
|
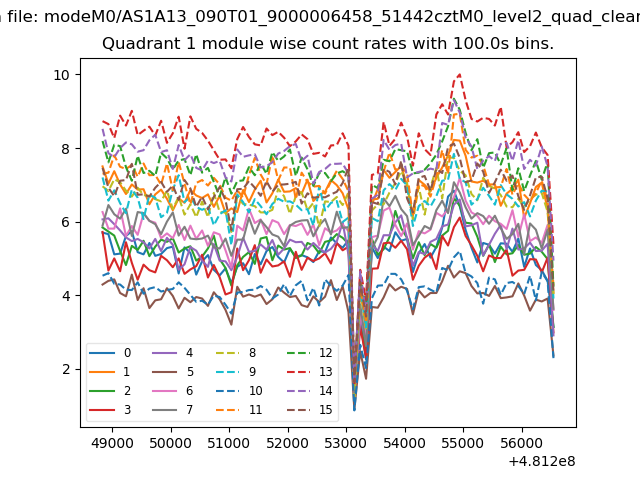
| Module-wise count rates for Quadrant A Data is divided into 100 sec bins |
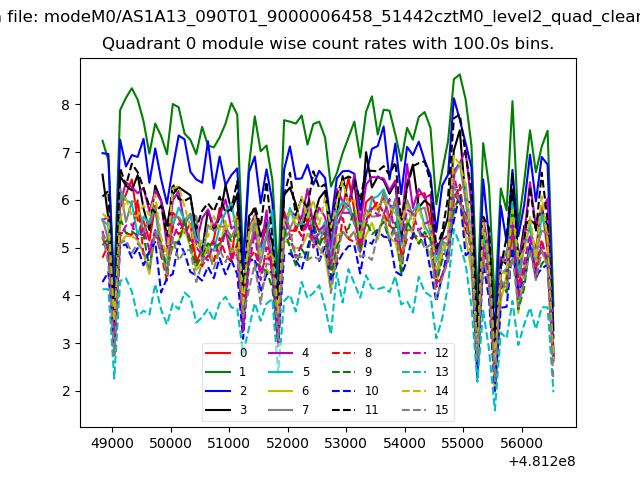 |
 |
| Module-wise count rates for Quadrant B Data is divided into 100 sec bins |
 |
 |
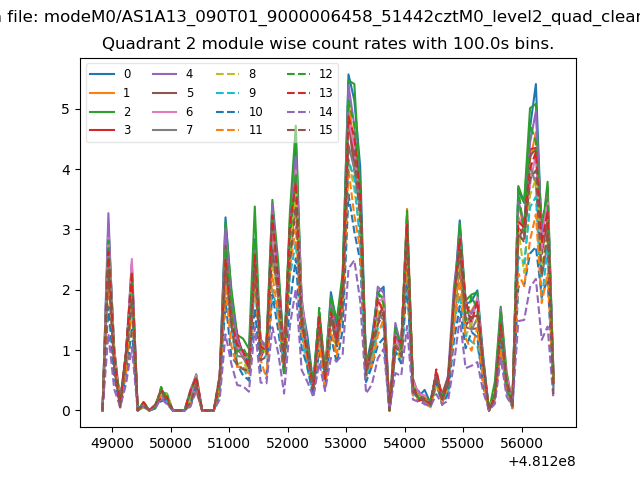
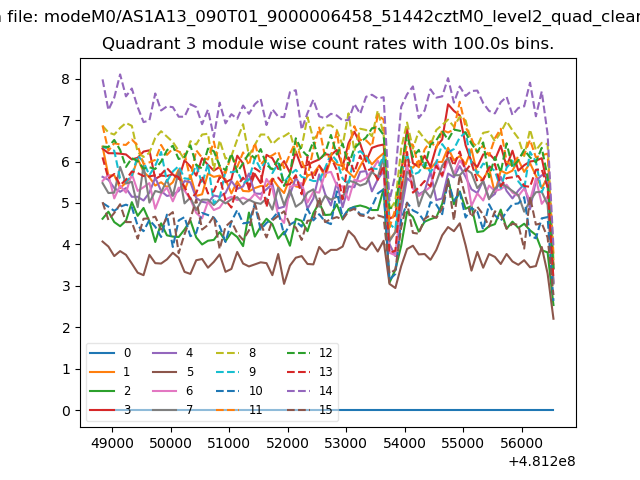
| Module-wise count rates for Quadrant C Data is divided into 100 sec bins |
 |
 |
| Module-wise count rates for Quadrant D Data is divided into 100 sec bins |
 |
 |
| Parameter | Plot |
|---|---|
| CZT HV Monitor | 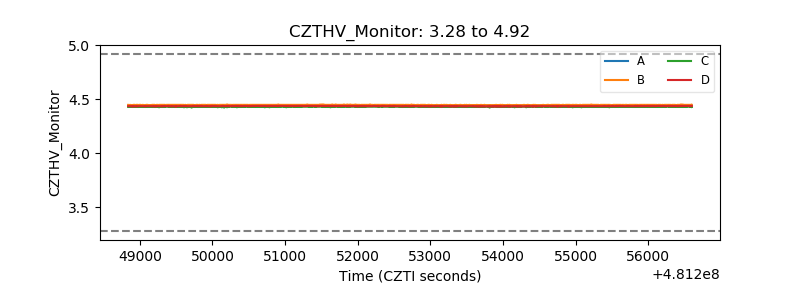 |
| D_VDD | 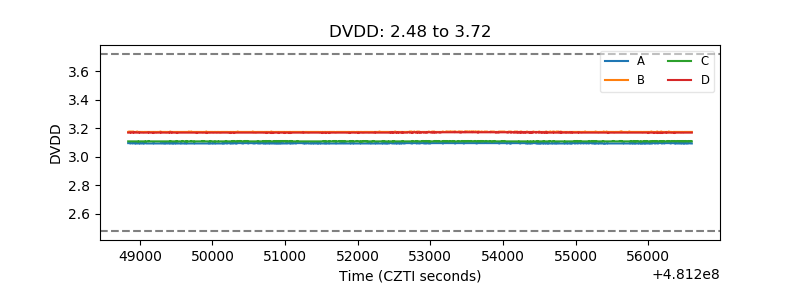 |
| Temperature 1 | 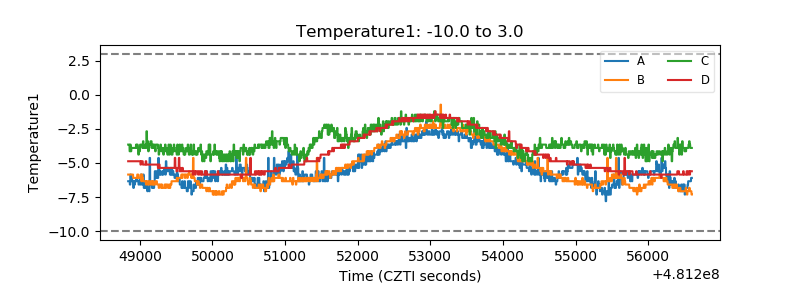 |
| Veto HV Monitor |  |
| Veto LLD |  |
| Alpha Counter | 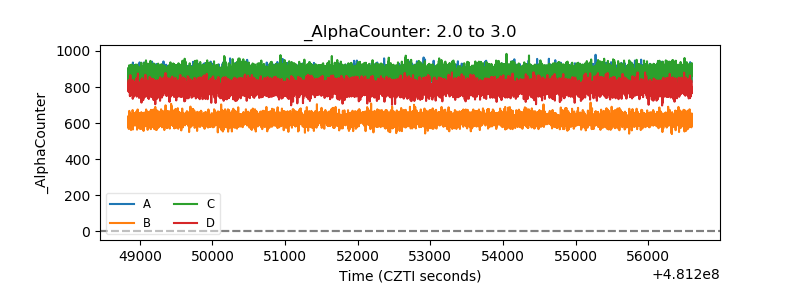 |
| _CPM_Rate | 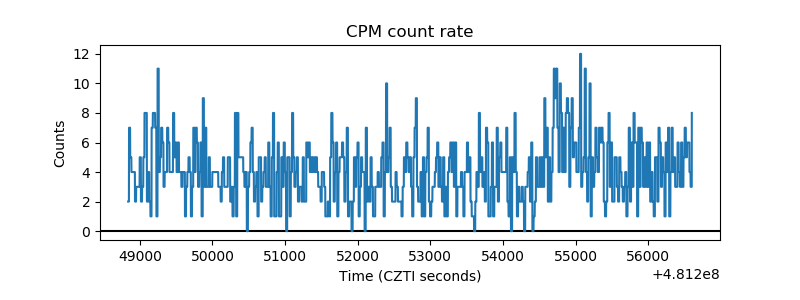 |
| CZT Counter | 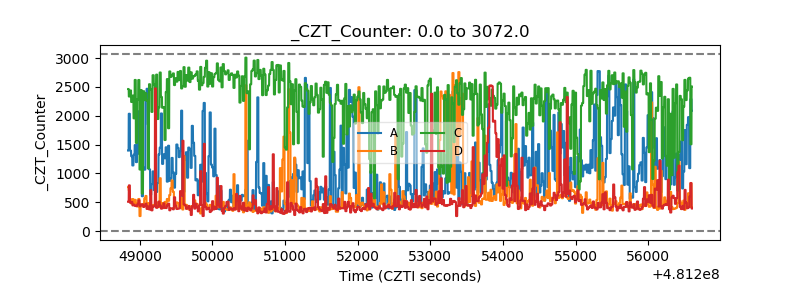 |
| +2.5 Volts monitor | 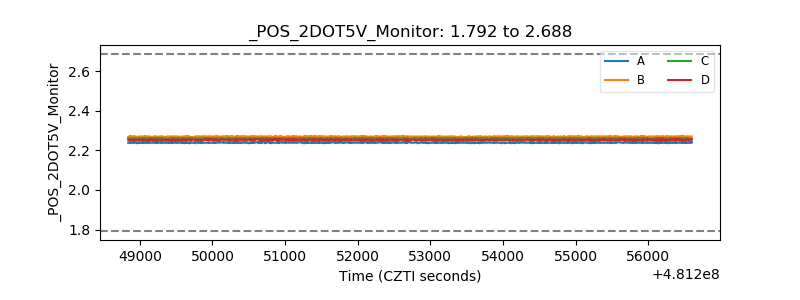 |
| +5 Volts monitor | 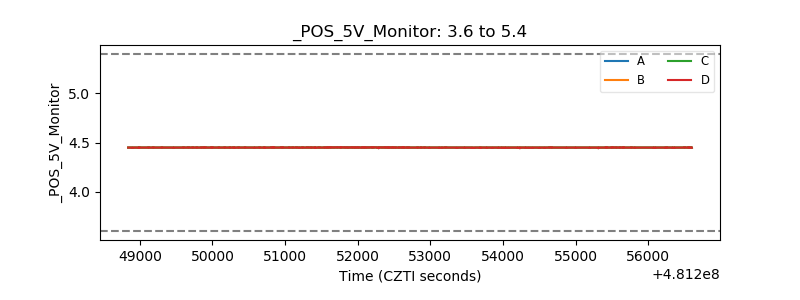 |
| _ROLL_ROT | 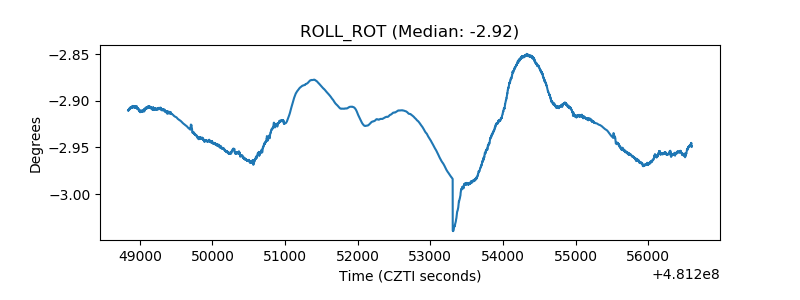 |
| _Roll_DEC | 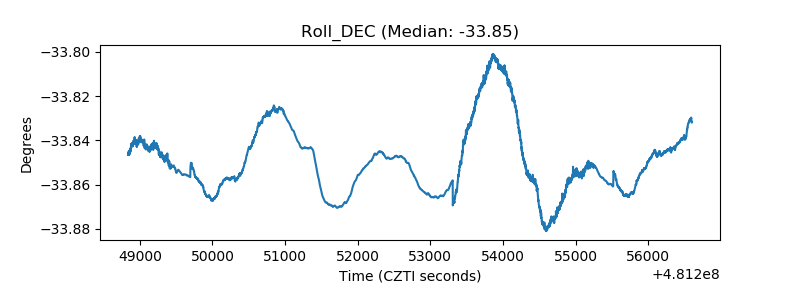 |
| _Roll_RA | 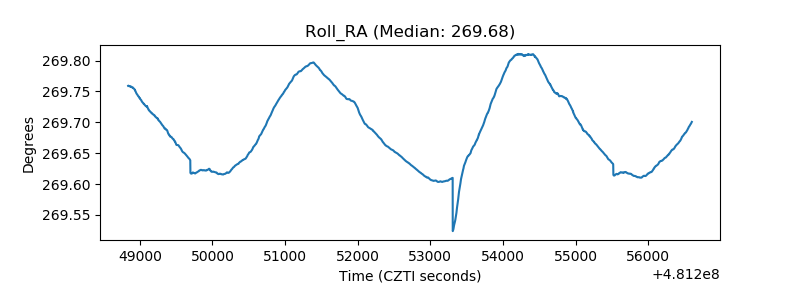 |
| Veto Counter | 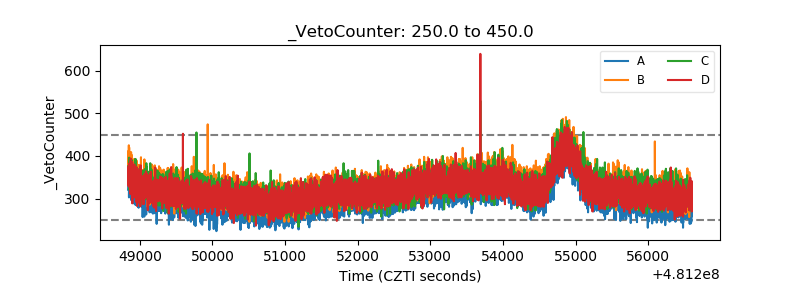 |