| Param | Original file | Final file |
|---|---|---|
| Filename | modeM0/AS1A13_090T01_9000006458_51446cztM0_level2.fits | modeM0/AS1A13_090T01_9000006458_51446cztM0_level2_quad_clean.evt |
| Size (bytes) | 1,320,232,320 | 132,586,560 |
| Size | 1.2 GB | 126.4 MB |
| Events in quadrant A | 11,883,429 | 929,281 |
| Events in quadrant B | 5,878,158 | 1,101,237 |
| Events in quadrant C | 22,923,958 | 325,135 |
| Events in quadrant D | 7,330,575 | 892,681 |
| Mode M0 | |||
|---|---|---|---|
| Quadrant | BADHDUFLAG | Total packets | Discarded packets |
| A | 0 | 43096 | 0 |
| B | 0 | 25285 | 0 |
| C | 0 | 75700 | 4 |
| D | 0 | 29779 | 0 |
| Mode SS | |||
|---|---|---|---|
| Quadrant | BADHDUFLAG | Total packets | Discarded packets |
| A | 0 | 222 | 0 |
| B | 0 | 222 | 0 |
| C | 0 | 222 | 0 |
| D | 0 | 222 | 0 |
| Quadrant | Total seconds | Saturated seconds | Saturation percentage |
|---|---|---|---|
| A | 11056 | 1180 | 10.672938% |
| B | 11056 | 167 | 1.510492% |
| C | 11056 | 8015 | 72.494573% |
| D | 11056 | 421 | 3.807887% |
Noise dominated data is calculated using 1-second bins in cleaned event files. If a bin has >2000 counts, and if more than 50% of those come from <1% of pixels, then it is considered to be noise-dominated and hence unusable.
| Quadrant | # 1 sec bins | Bins with >0 counts | Bins with >2000 counts | High rate bins dominated by noise | Noise dominated (total time) | Noise dominated (detector-on time) | Marked lightcurve |
|---|---|---|---|---|---|---|---|
| A | 11056 | 11056 | 1016 | 1016 | 9.19% | 9.19% | 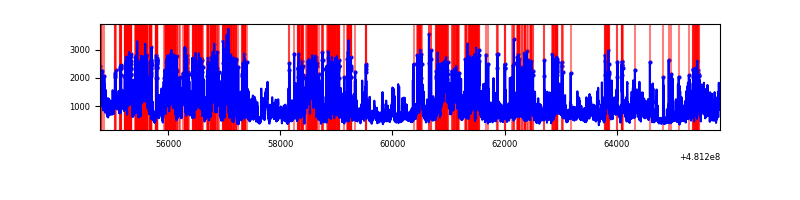 |
| B | 11056 | 11056 | 104 | 104 | 0.94% | 0.94% | 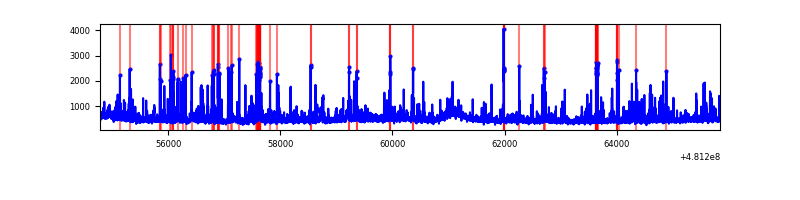 |
| C | 11055 | 11055 | 7250 | 7250 | 65.58% | 65.58% | 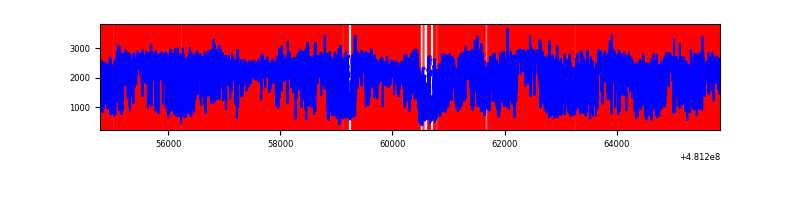 |
| D | 11056 | 11056 | 444 | 444 | 4.02% | 4.02% | 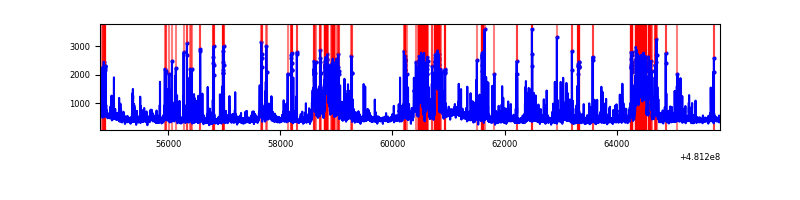 |
Top three noisy pixels from each quadrant. If the there are fewer than three noisy pixels in the level2.evt file, extra rows are filled as -1
| Pixel properties | Quadrant properties | ||||||
|---|---|---|---|---|---|---|---|
| Quadrant | DetID | PixID | Counts | Sigma | Mean | Median | Sigma |
| A | 12 | 3 | 3585353 | 12808.95 | 1127 | 1099 | 279.8 |
| A | 15 | 174 | 1082195 | 3863.48 | 1127 | 1099 | 279.8 |
| A | 7 | 64 | 968896 | 3458.59 | 1127 | 1099 | 279.8 |
| B | 4 | 206 | 333813 | 1343.94 | 1158 | 1117 | 247.6 |
| B | 7 | 252 | 139974 | 560.92 | 1158 | 1117 | 247.6 |
| B | 0 | 171 | 106091 | 424.05 | 1158 | 1117 | 247.6 |
| C | 15 | 179 | 11795214 | 61241.64 | 697 | 693 | 192.6 |
| C | 4 | 12 | 6427605 | 33370.97 | 697 | 693 | 192.6 |
| C | 10 | 171 | 850579 | 4412.93 | 697 | 693 | 192.6 |
| D | 7 | 60 | 1400321 | 4463.06 | 1124 | 1083 | 313.5 |
| D | 7 | 96 | 271385 | 862.17 | 1124 | 1083 | 313.5 |
| D | 2 | 153 | 194850 | 618.05 | 1124 | 1083 | 313.5 |
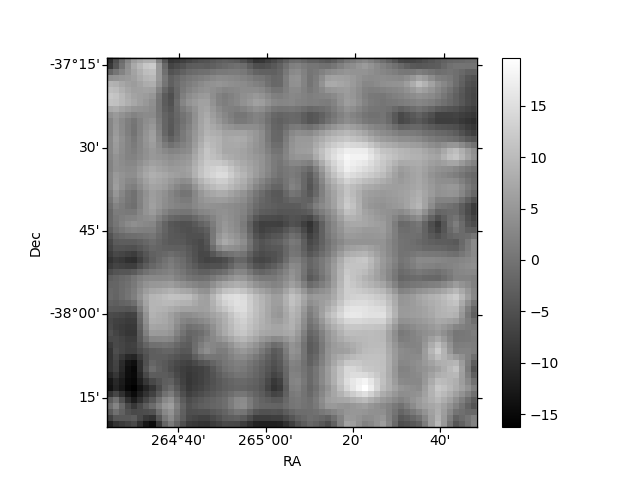
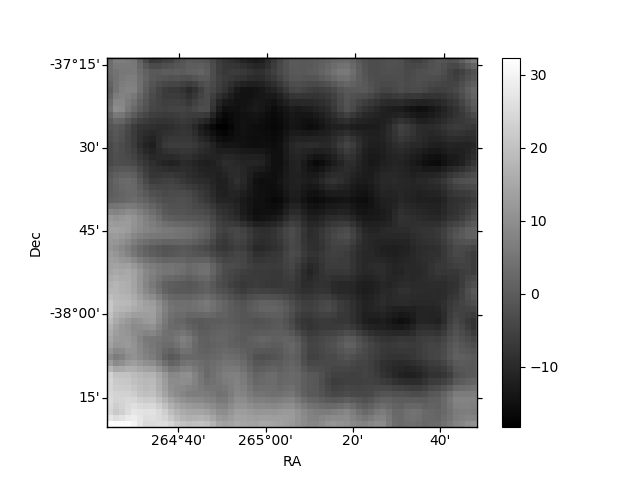
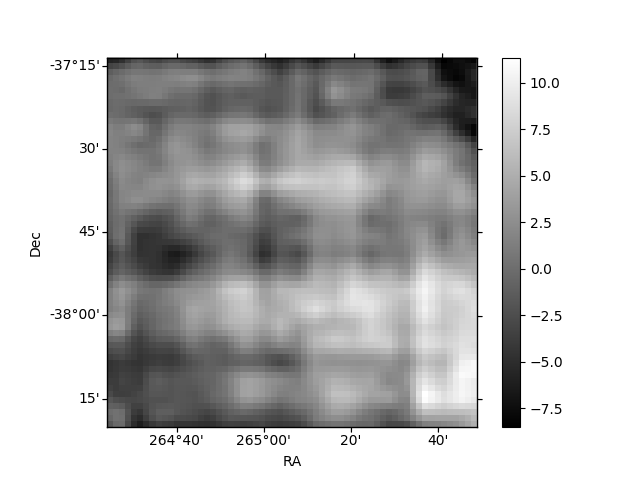
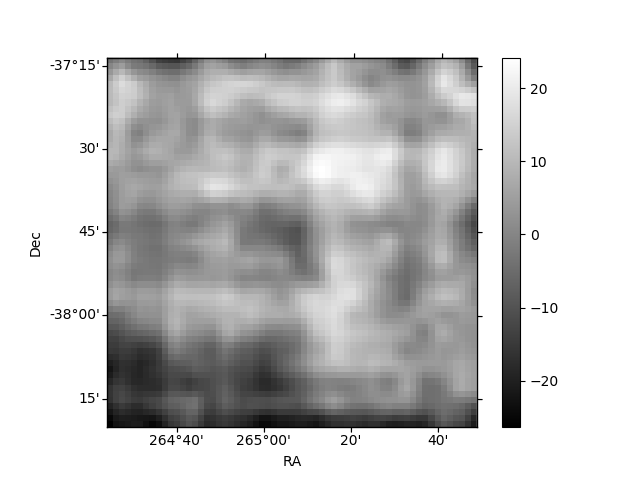
Histogram calculated using DETX and DETY for each event in the final _common_clean file
| Quadrant A | 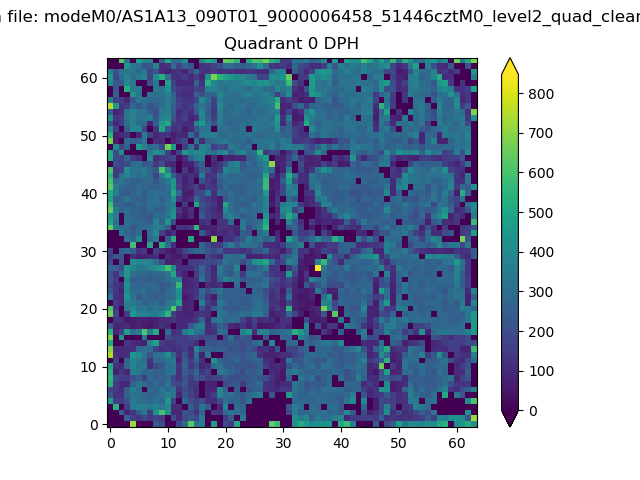 |
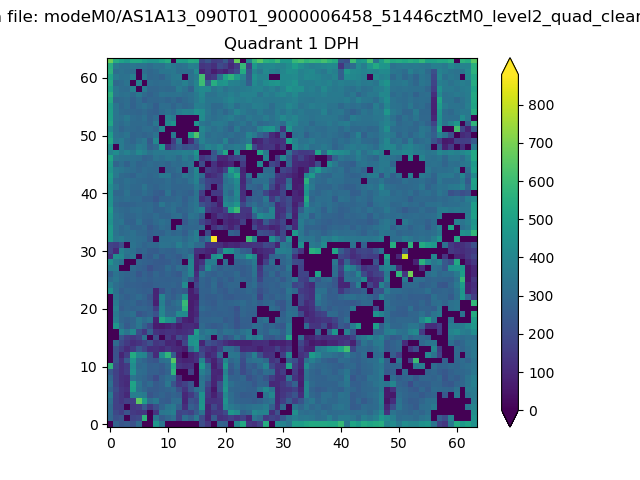 |
Quadrant B |
|---|---|---|---|
| Quadrant D | 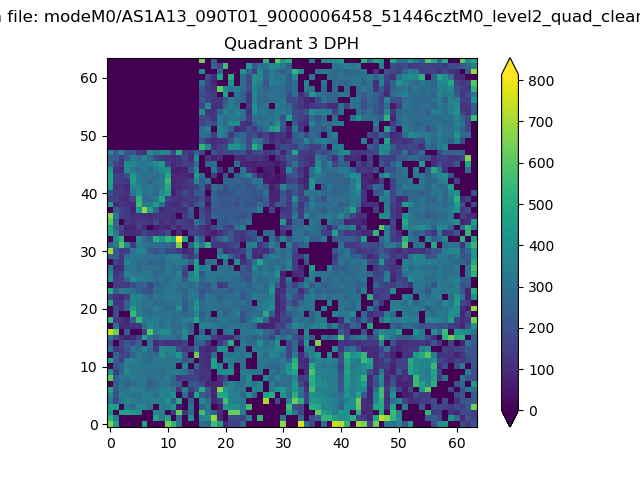 |
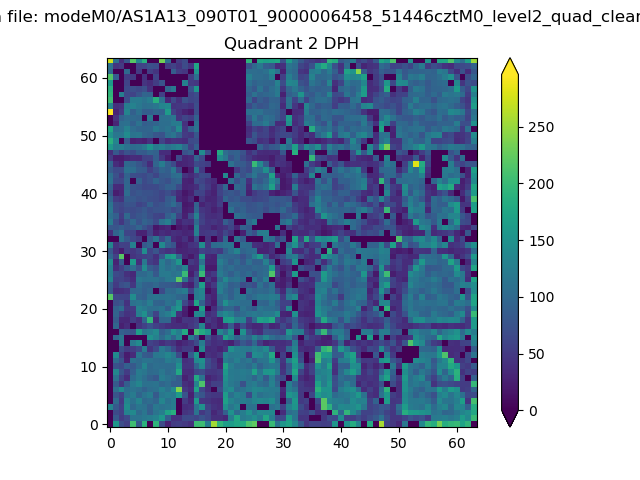 |
Quadrant C |
| Plot type | Count rate plots | Images |
|---|---|---|
| Comparison with Poisson distribution Blue bars denote a histogram of data divided into 1 sec bins. Red curve is a Poisson curve with rate = median count rate of data. |
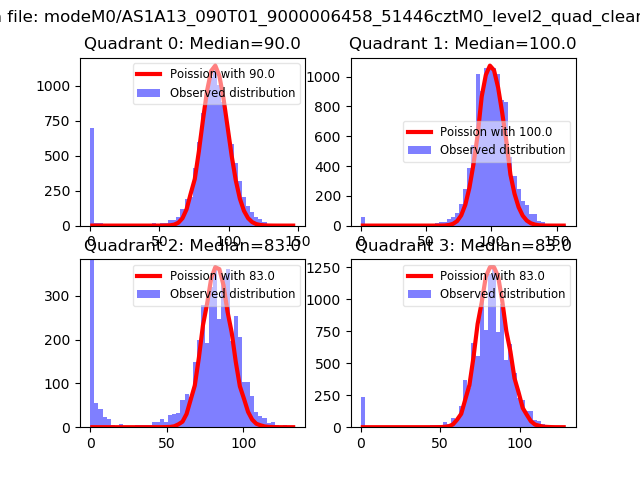 |
 |
| Quadrant-wise count rates Data is divided into 100 sec bins |
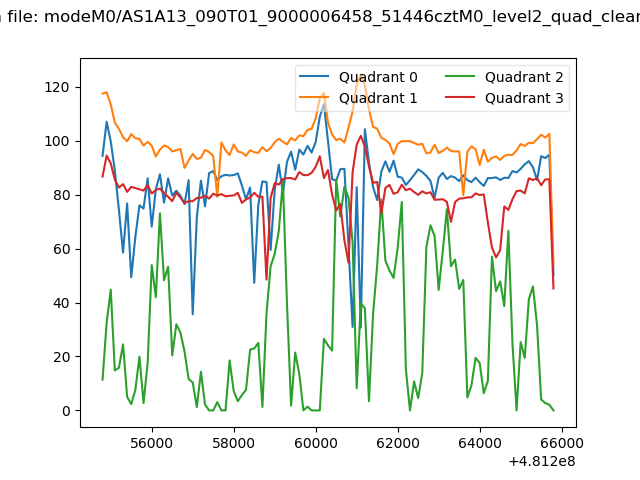 |
|
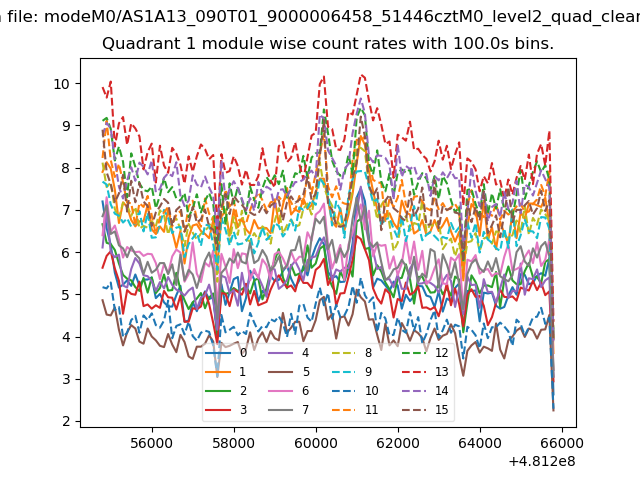
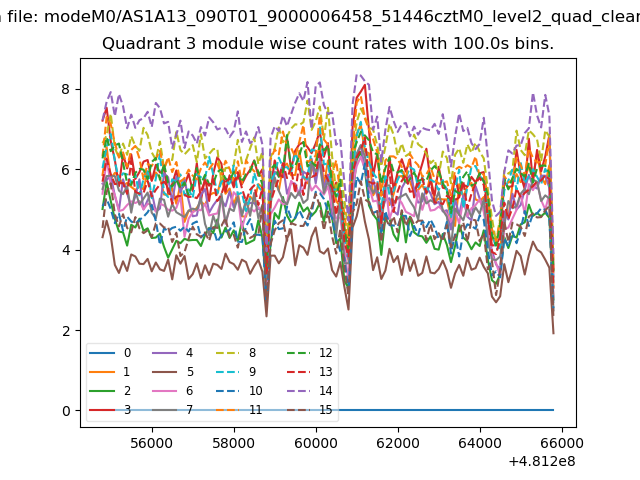
| Module-wise count rates for Quadrant A Data is divided into 100 sec bins |
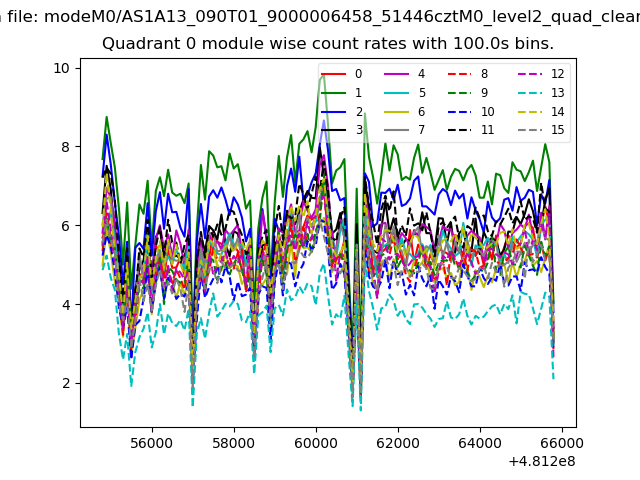 |
 |
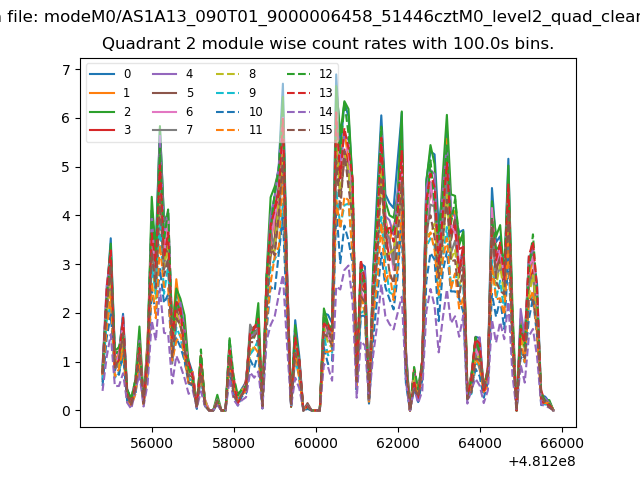
| Module-wise count rates for Quadrant B Data is divided into 100 sec bins |
 |
 |
| Module-wise count rates for Quadrant C Data is divided into 100 sec bins |
 |
 |
| Module-wise count rates for Quadrant D Data is divided into 100 sec bins |
 |
 |
| Parameter | Plot |
|---|---|
| CZT HV Monitor |  |
| D_VDD | 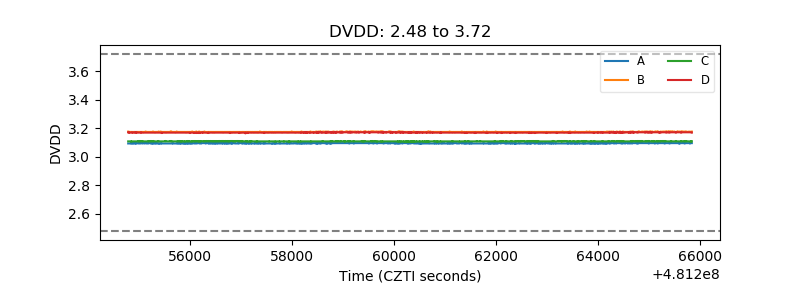 |
| Temperature 1 | 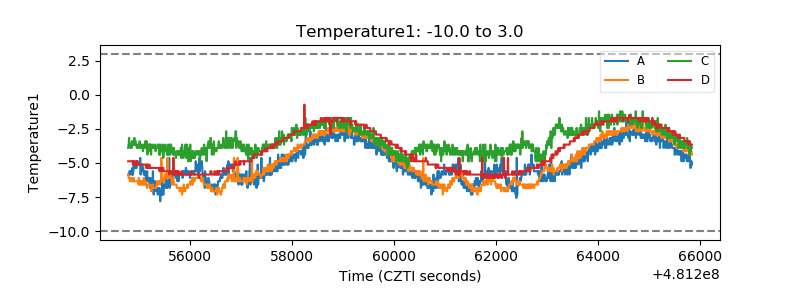 |
| Veto HV Monitor | 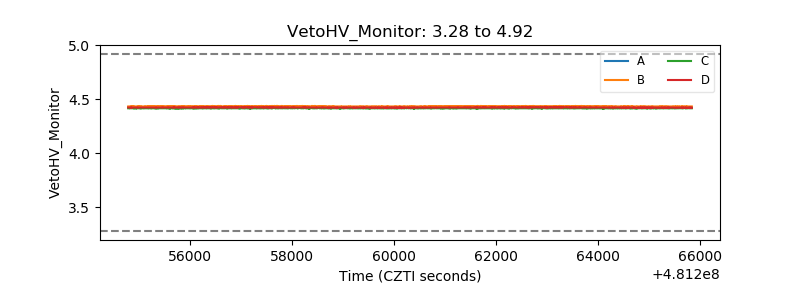 |
| Veto LLD | 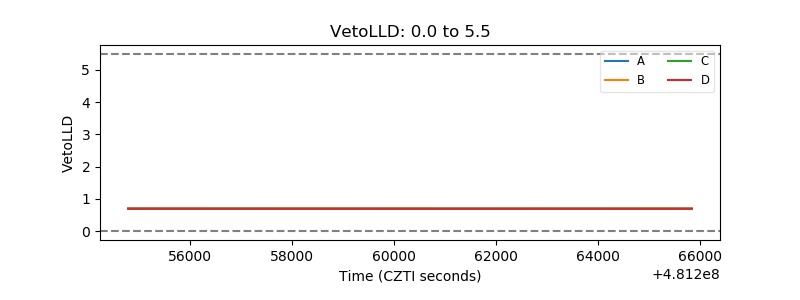 |
| Alpha Counter | 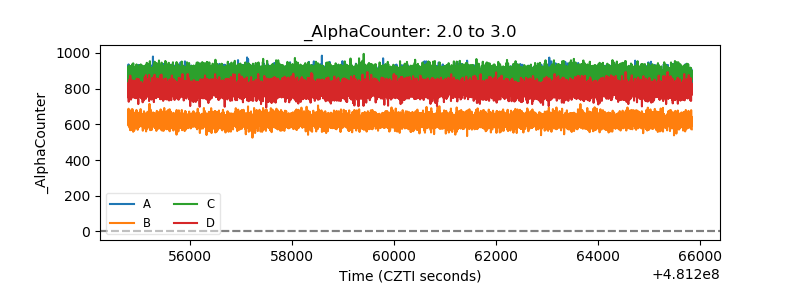 |
| _CPM_Rate | 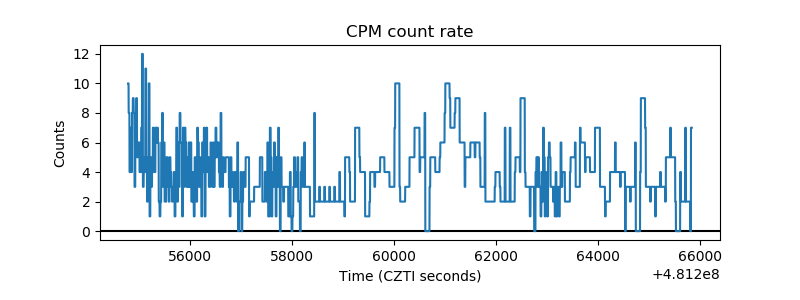 |
| CZT Counter | 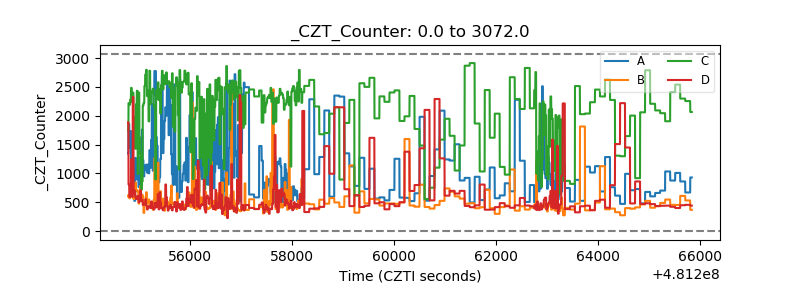 |
| +2.5 Volts monitor | 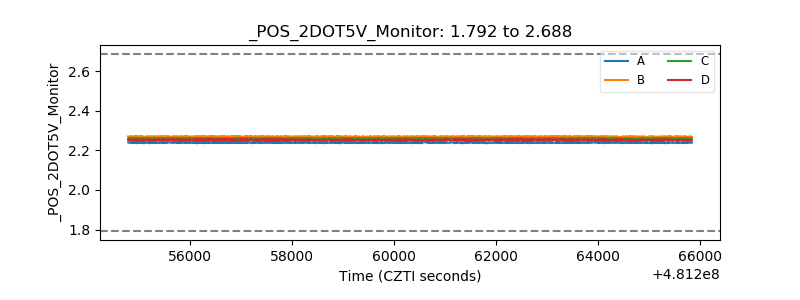 |
| +5 Volts monitor | 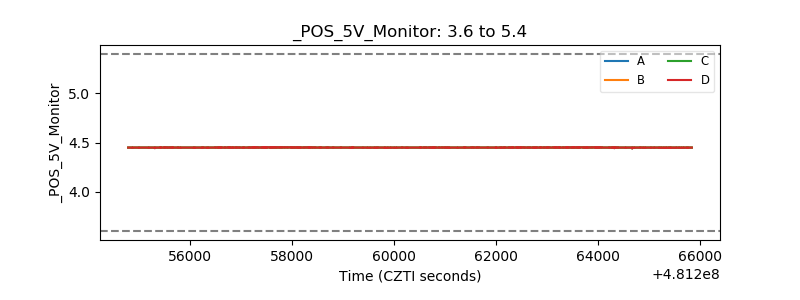 |
| _ROLL_ROT | 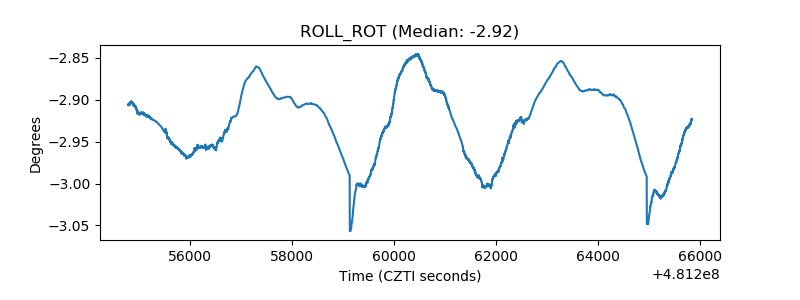 |
| _Roll_DEC | 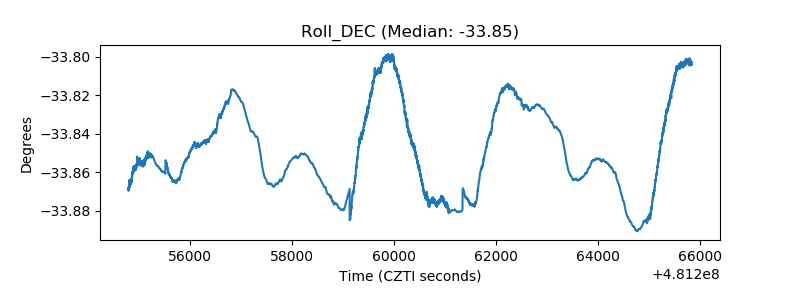 |
| _Roll_RA |  |
| Veto Counter | 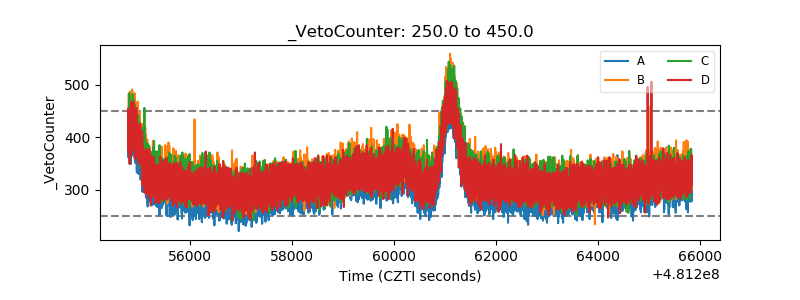 |