| Param | Original file | Final file |
|---|---|---|
| Filename | modeM0/AS1A13_090T01_9000006458_51447cztM0_level2.fits | modeM0/AS1A13_090T01_9000006458_51447cztM0_level2_quad_clean.evt |
| Size (bytes) | 2,498,258,880 | 233,553,600 |
| Size | 2.3 GB | 222.7 MB |
| Events in quadrant A | 21,339,574 | 1,610,032 |
| Events in quadrant B | 13,168,067 | 1,870,321 |
| Events in quadrant C | 43,111,630 | 586,231 |
| Events in quadrant D | 13,281,010 | 1,596,424 |
| Mode M0 | |||
|---|---|---|---|
| Quadrant | BADHDUFLAG | Total packets | Discarded packets |
| A | 0 | 77685 | 5 |
| B | 0 | 53477 | 5 |
| C | 0 | 142089 | 5 |
| D | 0 | 54297 | 5 |
| Mode M9 | |||
|---|---|---|---|
| Quadrant | BADHDUFLAG | Total packets | Discarded packets |
| A | 0 | 21 | 0 |
| B | 0 | 21 | 0 |
| C | 0 | 21 | 0 |
| D | 0 | 21 | 0 |
| Mode SS | |||
|---|---|---|---|
| Quadrant | BADHDUFLAG | Total packets | Discarded packets |
| A | 0 | 412 | 0 |
| B | 0 | 412 | 0 |
| C | 0 | 412 | 0 |
| D | 0 | 412 | 0 |
| Quadrant | Total seconds | Saturated seconds | Saturation percentage |
|---|---|---|---|
| A | 20443 | 3137 | 15.345106% |
| B | 20443 | 1619 | 7.919581% |
| C | 20443 | 14584 | 71.339823% |
| D | 20442 | 1207 | 5.904510% |
Noise dominated data is calculated using 1-second bins in cleaned event files. If a bin has >2000 counts, and if more than 50% of those come from <1% of pixels, then it is considered to be noise-dominated and hence unusable.
| Quadrant | # 1 sec bins | Bins with >0 counts | Bins with >2000 counts | High rate bins dominated by noise | Noise dominated (total time) | Noise dominated (detector-on time) | Marked lightcurve |
|---|---|---|---|---|---|---|---|
| A | 22413 | 20443 | 2439 | 2439 | 10.88% | 11.93% | 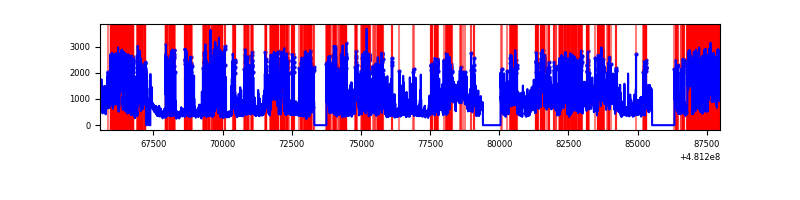 |
| B | 22413 | 20444 | 899 | 899 | 4.01% | 4.40% | 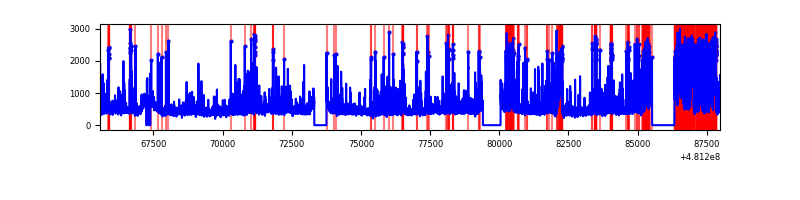 |
| C | 22413 | 20443 | 14030 | 14030 | 62.60% | 68.63% | 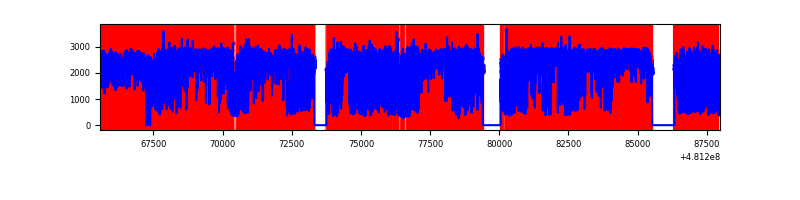 |
| D | 22412 | 20443 | 874 | 874 | 3.90% | 4.28% | 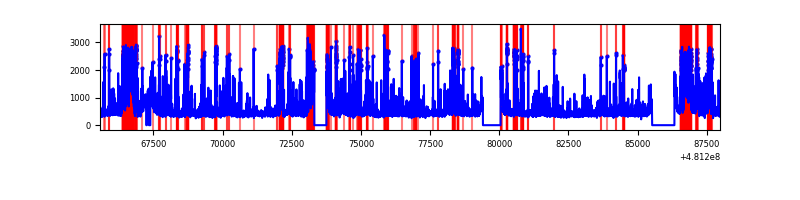 |
Top three noisy pixels from each quadrant. If the there are fewer than three noisy pixels in the level2.evt file, extra rows are filled as -1
| Pixel properties | Quadrant properties | ||||||
|---|---|---|---|---|---|---|---|
| Quadrant | DetID | PixID | Counts | Sigma | Mean | Median | Sigma |
| A | 7 | 64 | 4125751 | 8048.82 | 2098 | 2052 | 512.3 |
| A | 12 | 3 | 3598662 | 7020.03 | 2098 | 2052 | 512.3 |
| A | 15 | 174 | 1312810 | 2558.4 | 2098 | 2052 | 512.3 |
| B | 5 | 185 | 2647798 | 5838.21 | 2135 | 2056 | 453.2 |
| B | 0 | 171 | 353443 | 775.39 | 2135 | 2056 | 453.2 |
| B | 4 | 206 | 324716 | 711.99 | 2135 | 2056 | 453.2 |
| C | 4 | 12 | 30514272 | 97144.42 | 1152 | 1145 | 314.1 |
| C | 15 | 179 | 5156729 | 16413.79 | 1152 | 1145 | 314.1 |
| C | 3 | 233 | 854988 | 2718.37 | 1152 | 1145 | 314.1 |
| D | 6 | 42 | 2350192 | 3951.85 | 2131 | 2050 | 594.2 |
| D | 7 | 60 | 620650 | 1041.09 | 2131 | 2050 | 594.2 |
| D | 3 | 12 | 438971 | 735.33 | 2131 | 2050 | 594.2 |
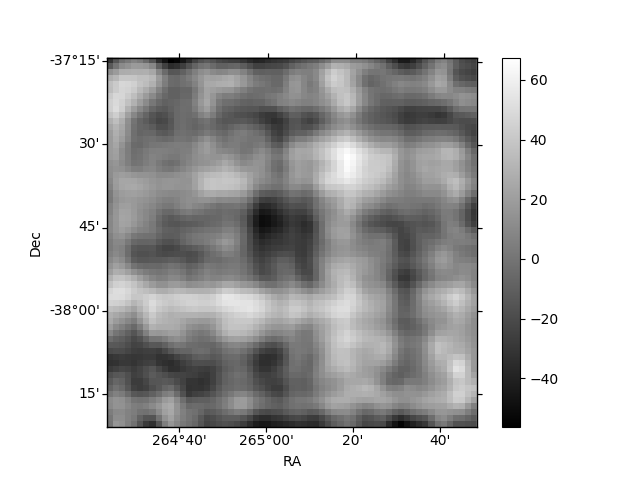
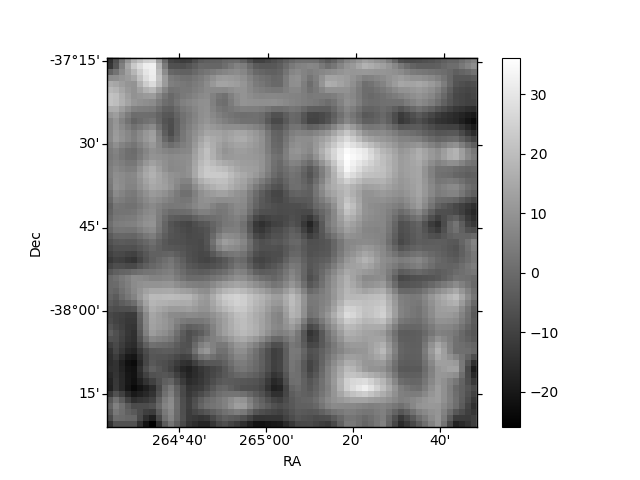
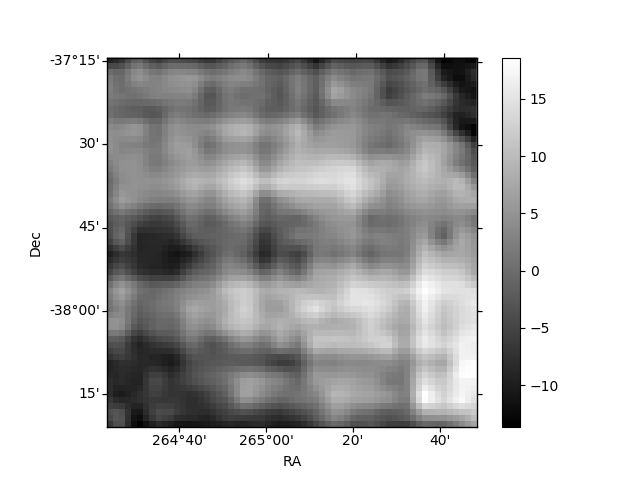
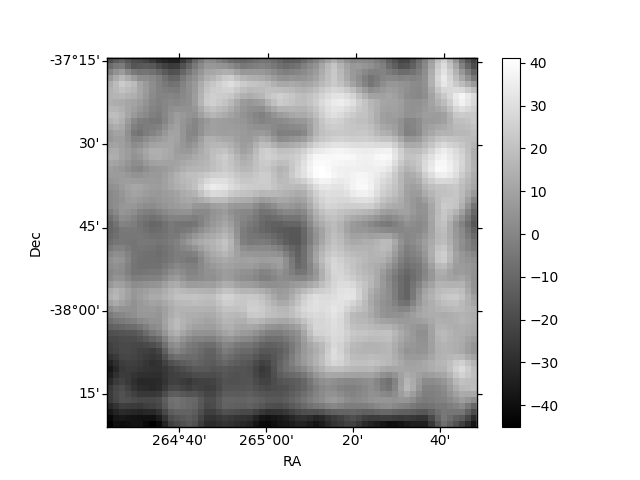
Histogram calculated using DETX and DETY for each event in the final _common_clean file
| Quadrant A | 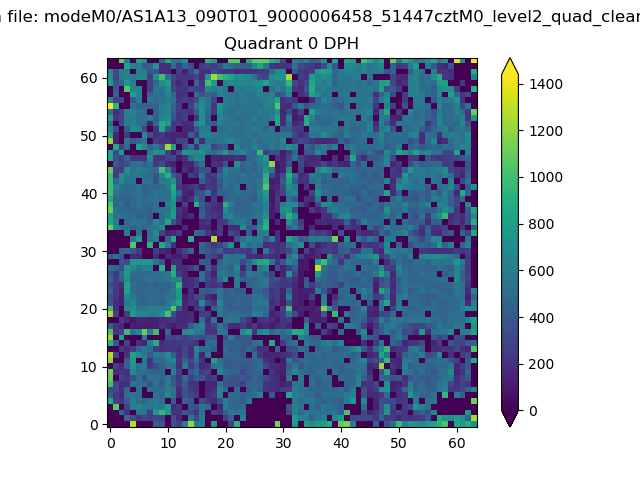 |
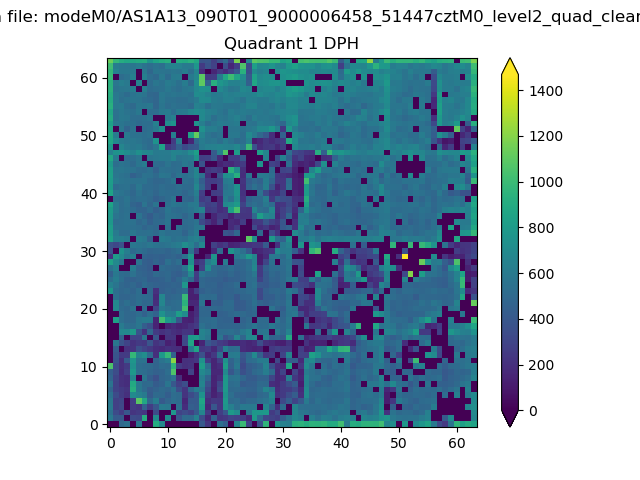 |
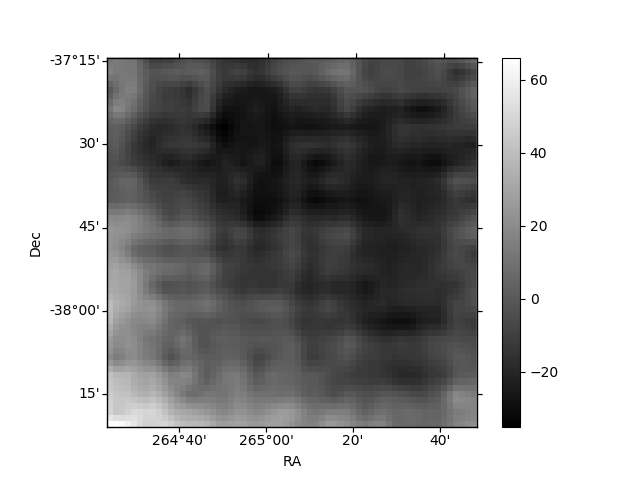
Quadrant B |
|---|---|---|---|
| Quadrant D | 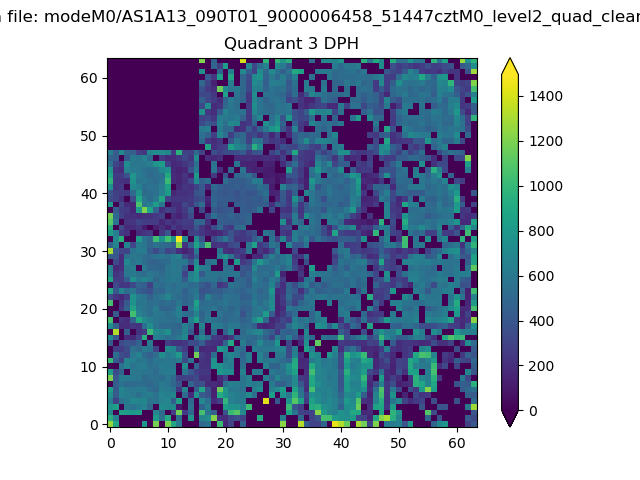 |
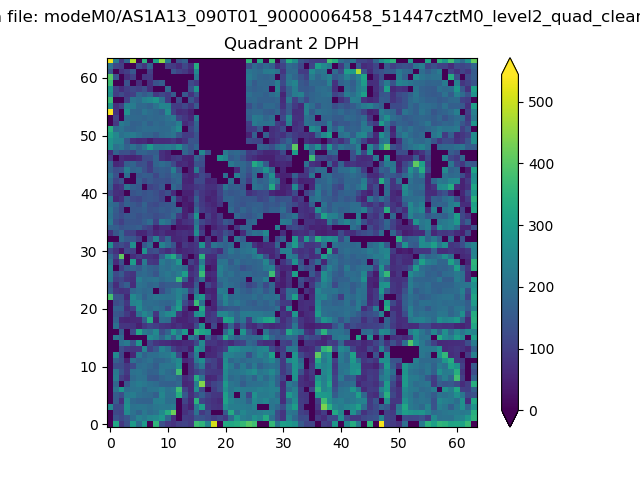 |
Quadrant C |
| Plot type | Count rate plots | Images |
|---|---|---|
| Comparison with Poisson distribution Blue bars denote a histogram of data divided into 1 sec bins. Red curve is a Poisson curve with rate = median count rate of data. |
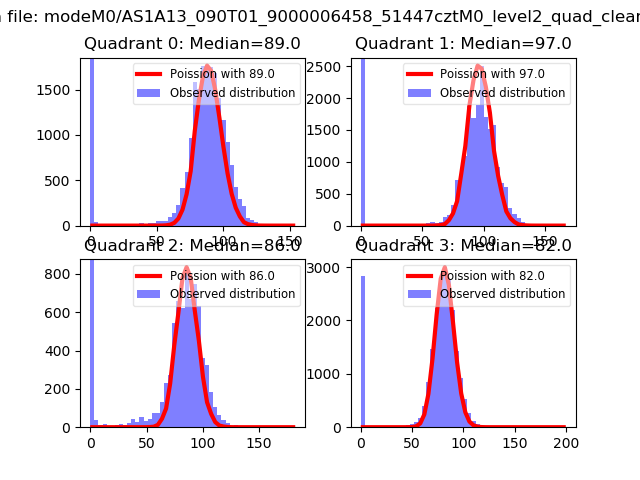 |
 |
| Quadrant-wise count rates Data is divided into 100 sec bins |
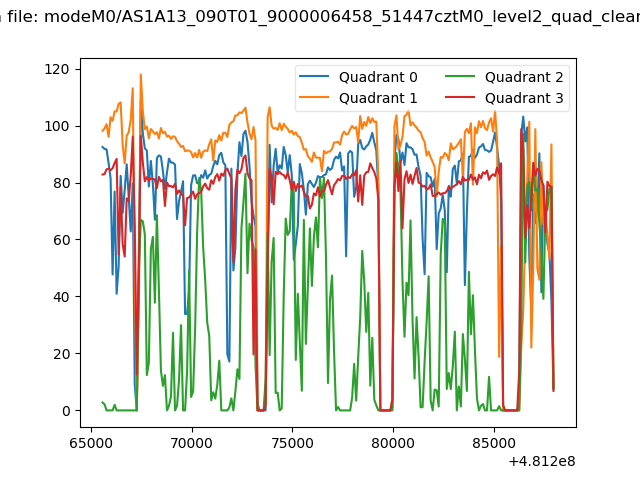 |
|
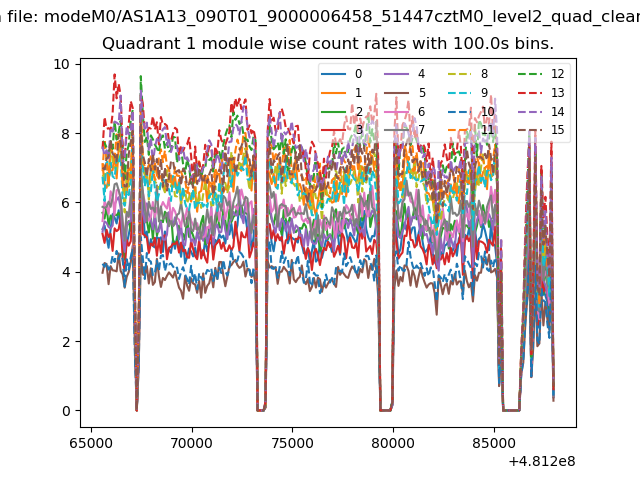
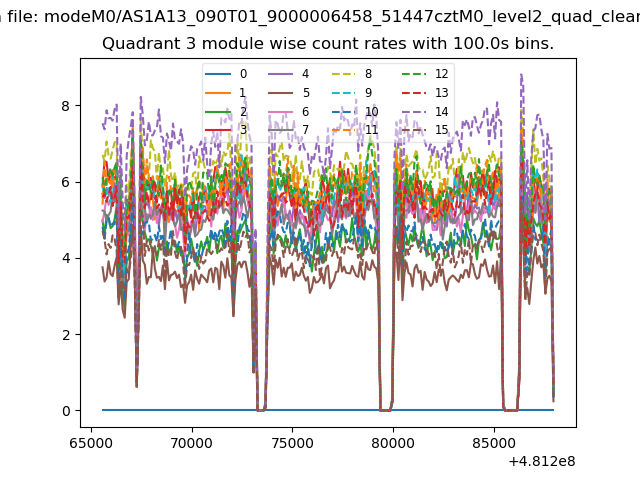
| Module-wise count rates for Quadrant A Data is divided into 100 sec bins |
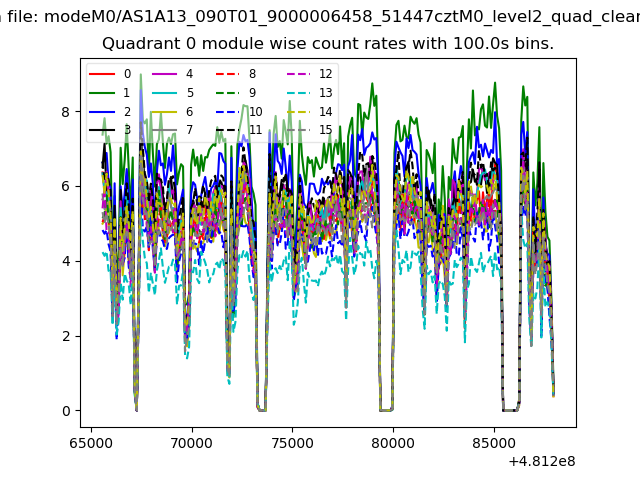 |
 |
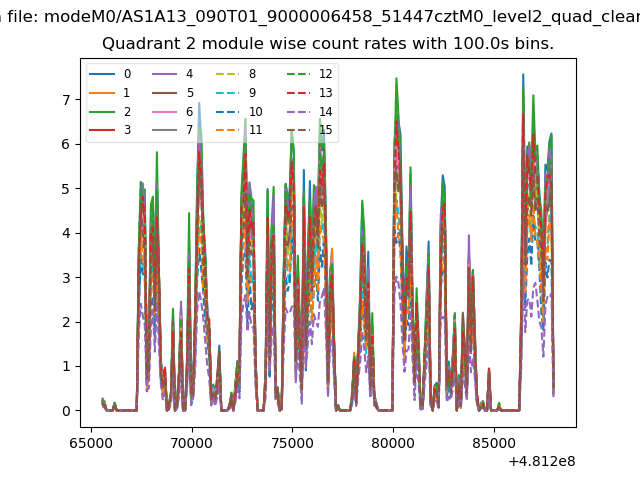
| Module-wise count rates for Quadrant B Data is divided into 100 sec bins |
 |
 |
| Module-wise count rates for Quadrant C Data is divided into 100 sec bins |
 |
 |
| Module-wise count rates for Quadrant D Data is divided into 100 sec bins |
 |
 |
| Parameter | Plot |
|---|---|
| CZT HV Monitor | 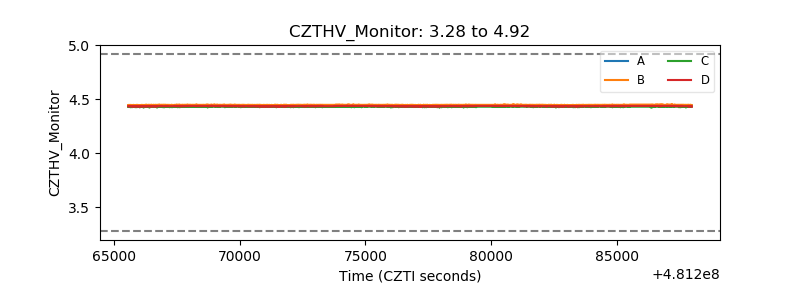 |
| D_VDD | 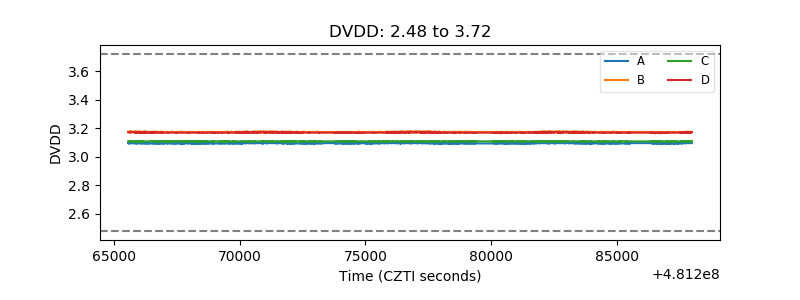 |
| Temperature 1 | 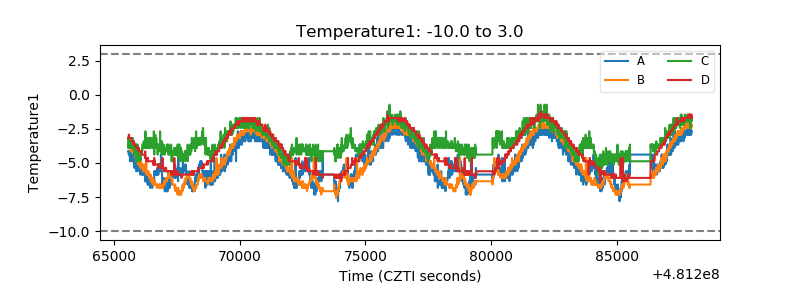 |
| Veto HV Monitor | 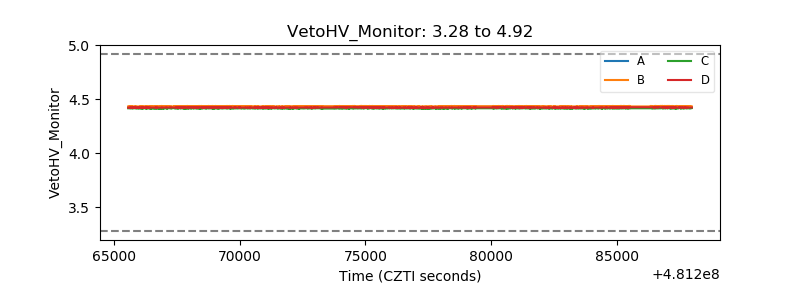 |
| Veto LLD | 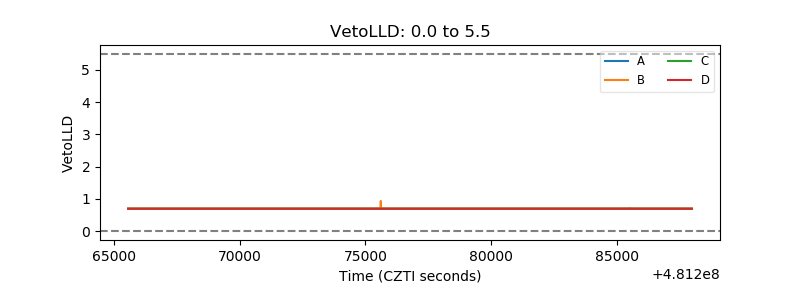 |
| Alpha Counter | 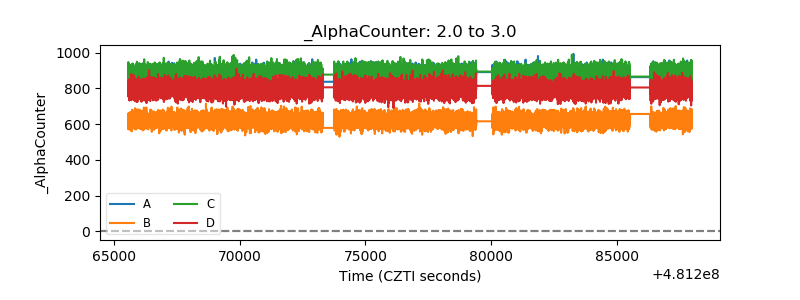 |
| _CPM_Rate | 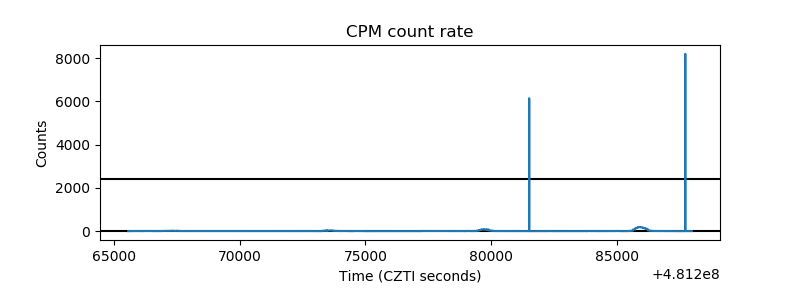 |
| CZT Counter | 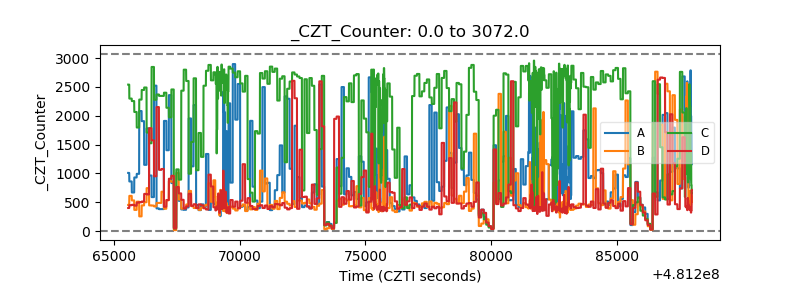 |
| +2.5 Volts monitor | 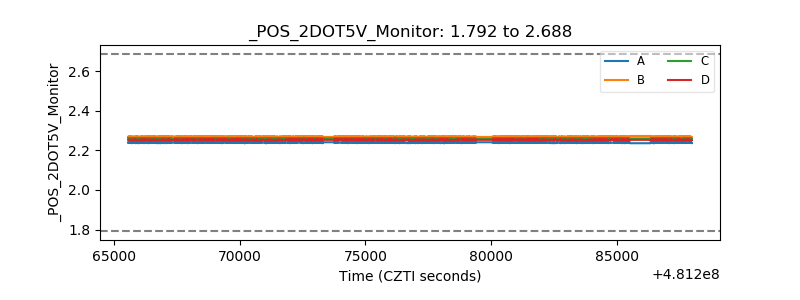 |
| +5 Volts monitor | 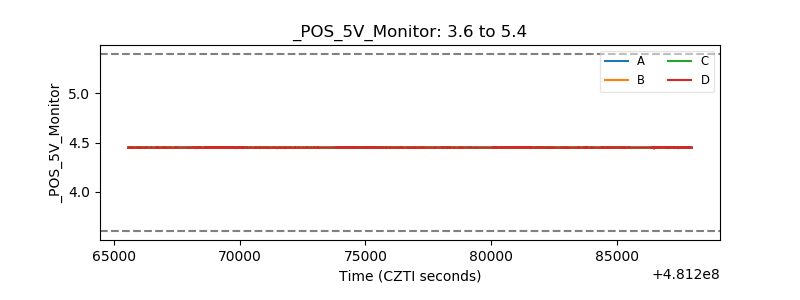 |
| _ROLL_ROT | 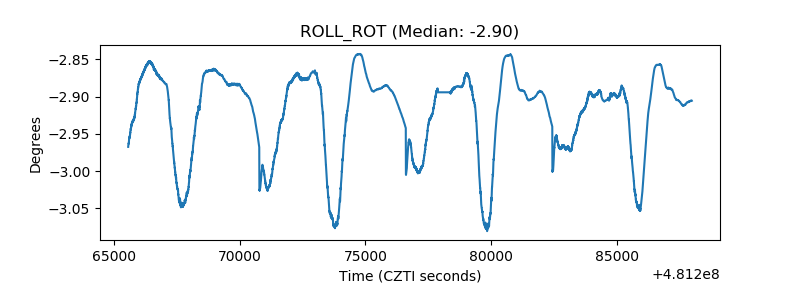 |
| _Roll_DEC | 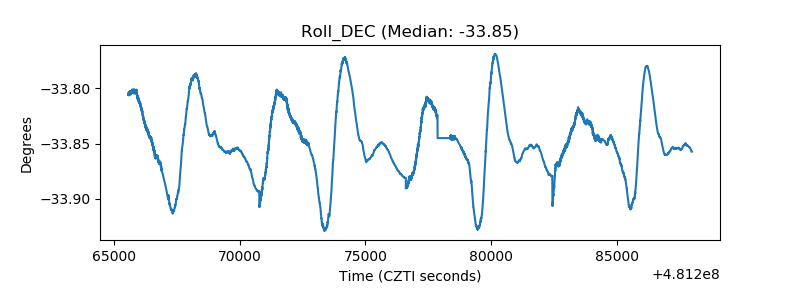 |
| _Roll_RA | 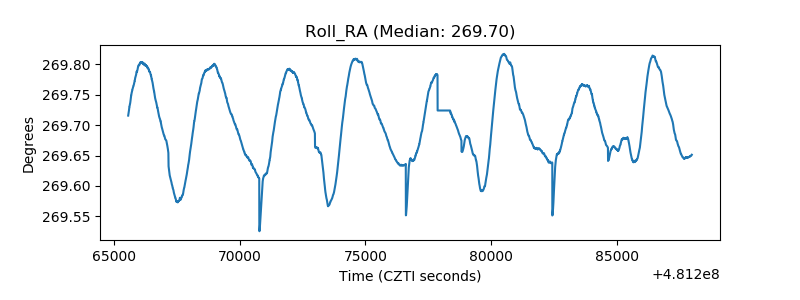 |
| Veto Counter | 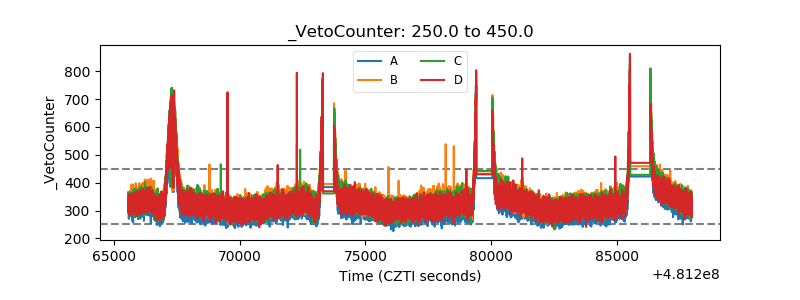 |