| Param | Original file | Final file |
|---|---|---|
| Filename | modeM0/AS1A13_090T01_9000006458_51449cztM0_level2.fits | modeM0/AS1A13_090T01_9000006458_51449cztM0_level2_quad_clean.evt |
| Size (bytes) | 825,649,920 | 81,679,680 |
| Size | 787.4 MB | 77.9 MB |
| Events in quadrant A | 9,963,992 | 441,977 |
| Events in quadrant B | 5,847,472 | 593,445 |
| Events in quadrant C | 10,159,884 | 417,153 |
| Events in quadrant D | 4,077,864 | 556,818 |
| Mode M0 | |||
|---|---|---|---|
| Quadrant | BADHDUFLAG | Total packets | Discarded packets |
| A | 0 | 34183 | 1 |
| B | 0 | 22050 | 1 |
| C | 0 | 34743 | 1 |
| D | 0 | 16866 | 1 |
| Mode M9 | |||
|---|---|---|---|
| Quadrant | BADHDUFLAG | Total packets | Discarded packets |
| A | 0 | 9 | 0 |
| B | 0 | 9 | 0 |
| C | 0 | 9 | 0 |
| D | 0 | 9 | 0 |
| Mode SS | |||
|---|---|---|---|
| Quadrant | BADHDUFLAG | Total packets | Discarded packets |
| A | 0 | 136 | 0 |
| B | 0 | 136 | 0 |
| C | 0 | 136 | 0 |
| D | 0 | 136 | 0 |
| Quadrant | Total seconds | Saturated seconds | Saturation percentage |
|---|---|---|---|
| A | 6642 | 2270 | 34.176453% |
| B | 6643 | 1032 | 15.535150% |
| C | 6642 | 2470 | 37.187594% |
| D | 6642 | 227 | 3.417645% |
Noise dominated data is calculated using 1-second bins in cleaned event files. If a bin has >2000 counts, and if more than 50% of those come from <1% of pixels, then it is considered to be noise-dominated and hence unusable.
| Quadrant | # 1 sec bins | Bins with >0 counts | Bins with >2000 counts | High rate bins dominated by noise | Noise dominated (total time) | Noise dominated (detector-on time) | Marked lightcurve |
|---|---|---|---|---|---|---|---|
| A | 7612 | 6642 | 2154 | 2154 | 28.30% | 32.43% | 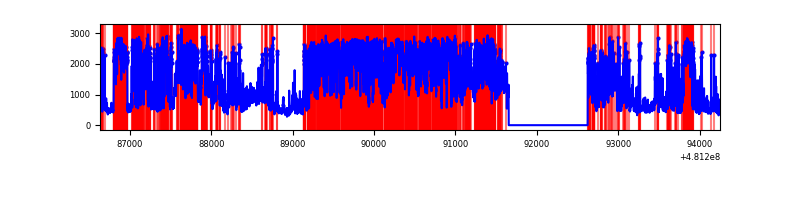 |
| B | 7613 | 6643 | 758 | 758 | 9.96% | 11.41% | 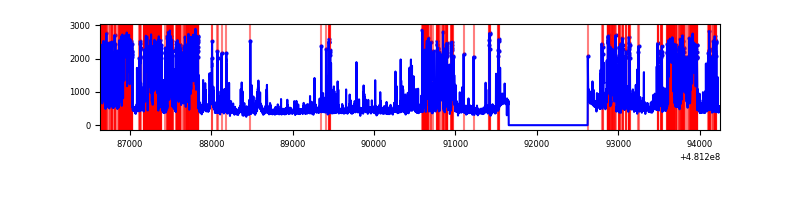 |
| C | 7612 | 6642 | 2404 | 2404 | 31.58% | 36.19% | 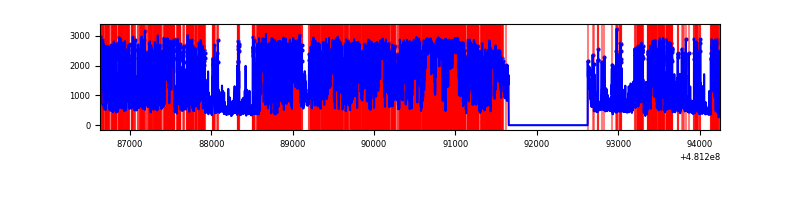 |
| D | 7612 | 6642 | 191 | 191 | 2.51% | 2.88% | 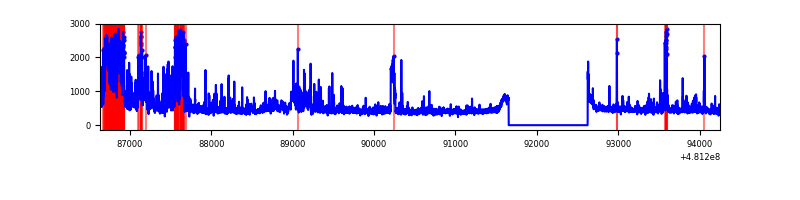 |
Top three noisy pixels from each quadrant. If the there are fewer than three noisy pixels in the level2.evt file, extra rows are filled as -1
| Pixel properties | Quadrant properties | ||||||
|---|---|---|---|---|---|---|---|
| Quadrant | DetID | PixID | Counts | Sigma | Mean | Median | Sigma |
| A | 7 | 64 | 3432106 | 22492.91 | 619 | 605 | 152.6 |
| A | 12 | 3 | 1785765 | 11701.42 | 619 | 605 | 152.6 |
| A | 4 | 249 | 979672 | 6417.62 | 619 | 605 | 152.6 |
| B | 5 | 185 | 2111780 | 14576.16 | 671 | 647 | 144.8 |
| B | 6 | 51 | 223159 | 1536.31 | 671 | 647 | 144.8 |
| B | 4 | 206 | 168626 | 1159.8 | 671 | 647 | 144.8 |
| C | 4 | 12 | 4961851 | 31474.34 | 577 | 571 | 157.6 |
| C | 3 | 233 | 983871 | 6238.05 | 577 | 571 | 157.6 |
| C | 15 | 179 | 945797 | 5996.51 | 577 | 571 | 157.6 |
| D | 6 | 42 | 813734 | 4245.95 | 693 | 668 | 191.5 |
| D | 8 | 176 | 209050 | 1088.2 | 693 | 668 | 191.5 |
| D | 13 | 170 | 61598 | 318.19 | 693 | 668 | 191.5 |
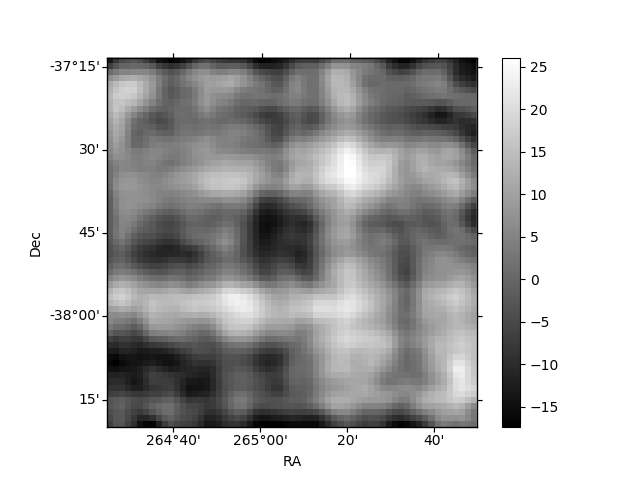
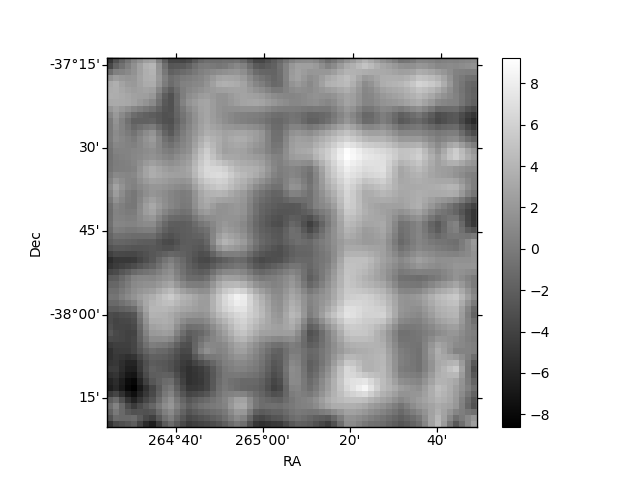
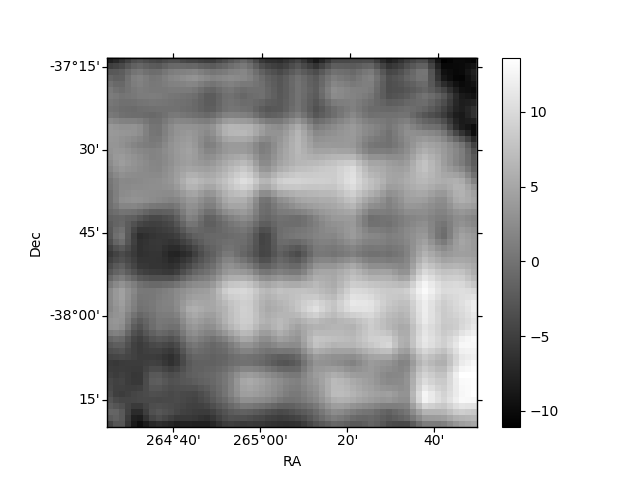
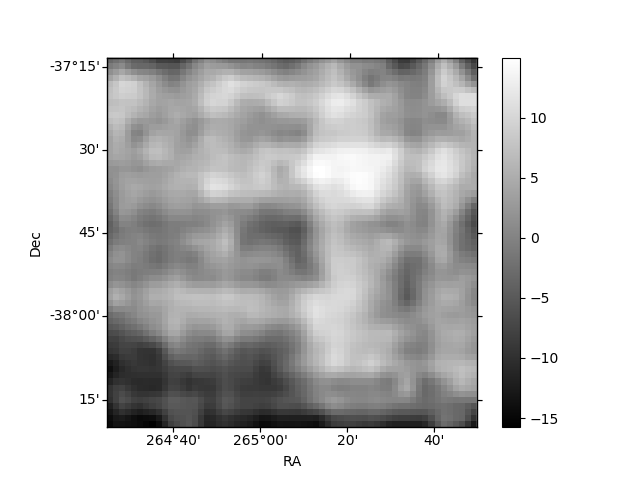
Histogram calculated using DETX and DETY for each event in the final _common_clean file
| Quadrant A | 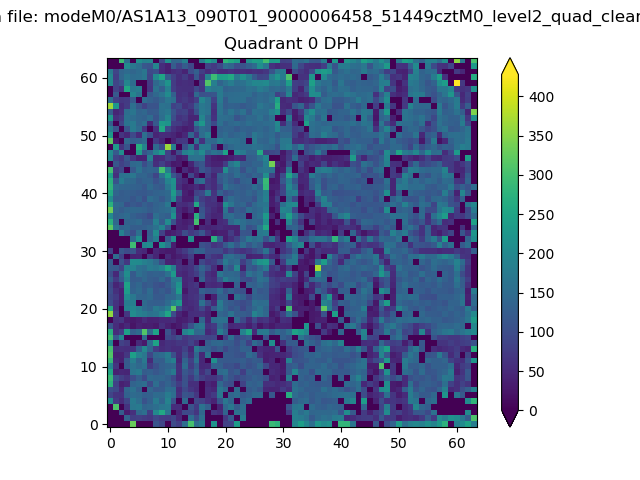 |
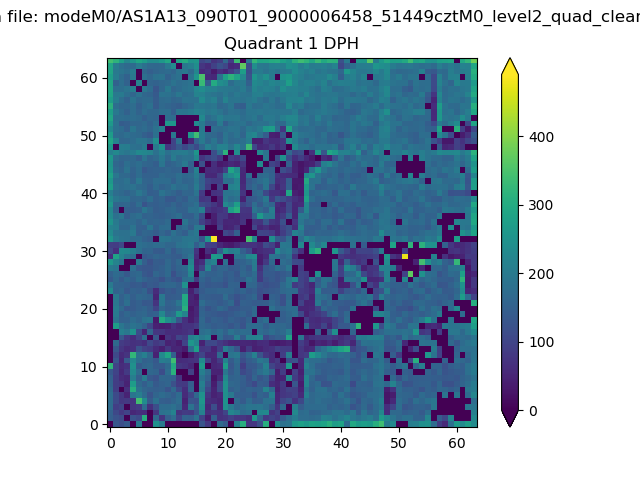 |
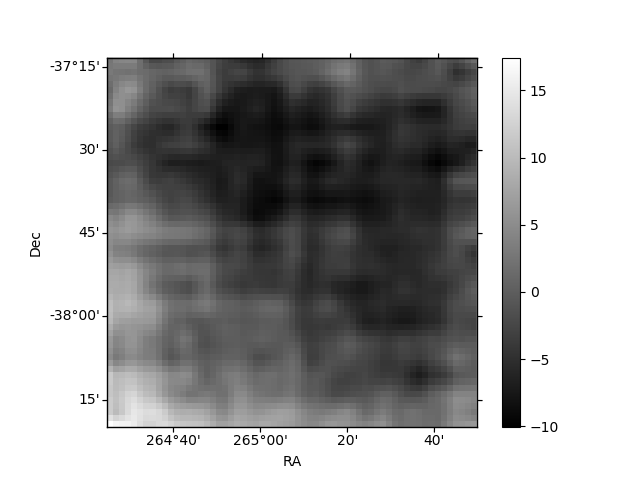
Quadrant B |
|---|---|---|---|
| Quadrant D | 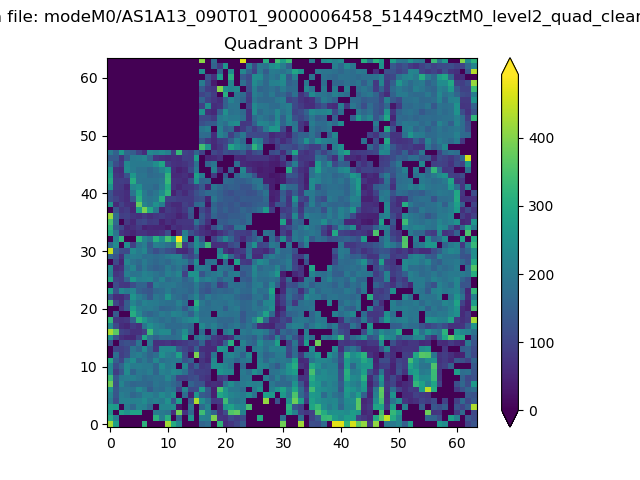 |
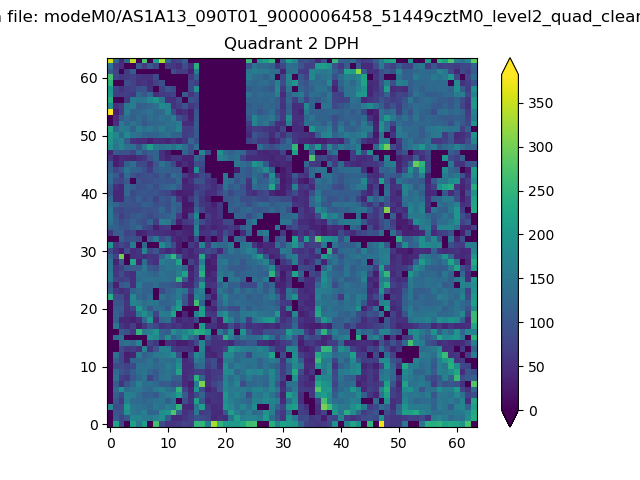 |
Quadrant C |
| Plot type | Count rate plots | Images |
|---|---|---|
| Comparison with Poisson distribution Blue bars denote a histogram of data divided into 1 sec bins. Red curve is a Poisson curve with rate = median count rate of data. |
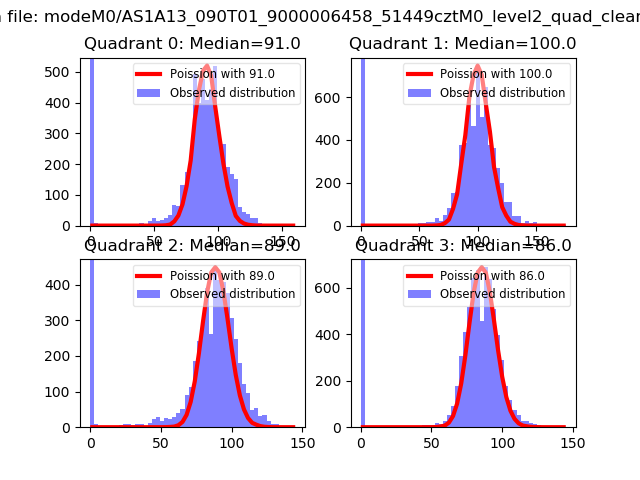 |
 |
| Quadrant-wise count rates Data is divided into 100 sec bins |
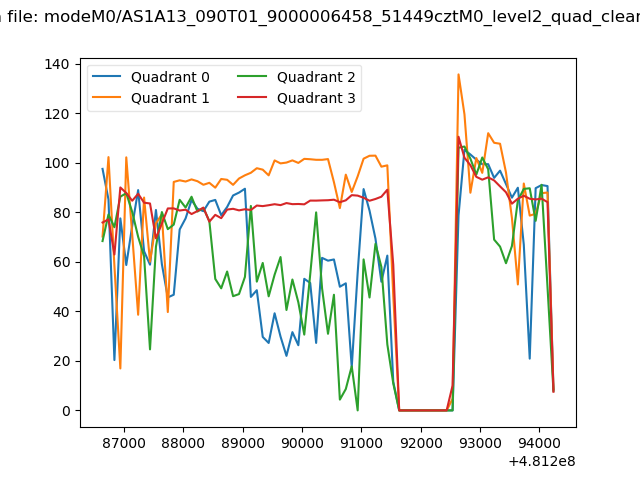 |
|
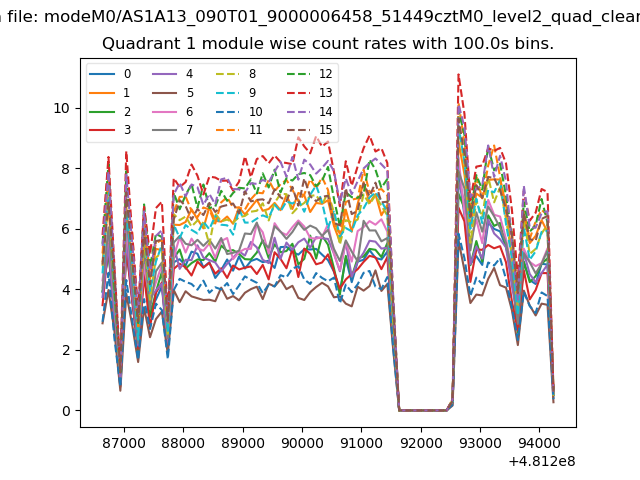
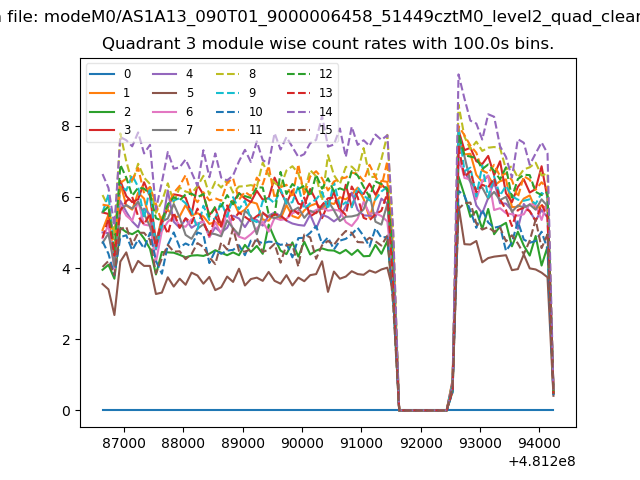
| Module-wise count rates for Quadrant A Data is divided into 100 sec bins |
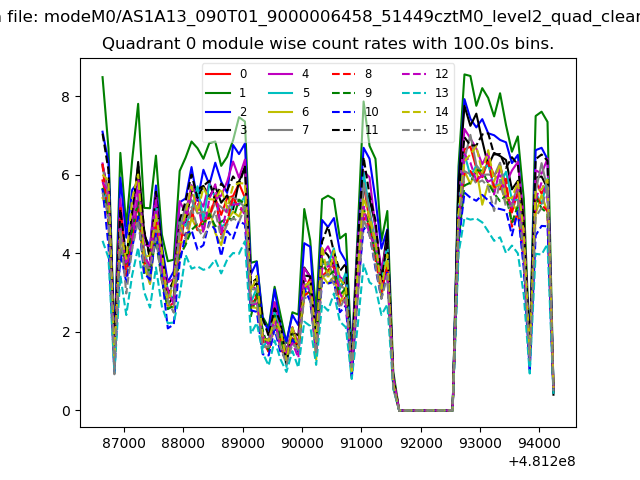 |
 |
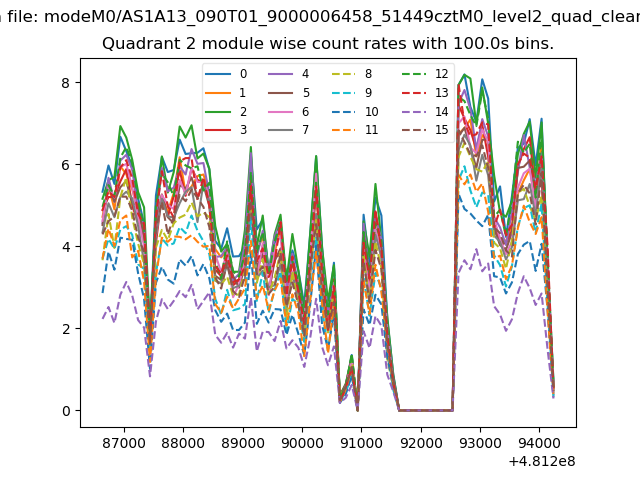
| Module-wise count rates for Quadrant B Data is divided into 100 sec bins |
 |
 |
| Module-wise count rates for Quadrant C Data is divided into 100 sec bins |
 |
 |
| Module-wise count rates for Quadrant D Data is divided into 100 sec bins |
 |
 |
| Parameter | Plot |
|---|---|
| CZT HV Monitor | 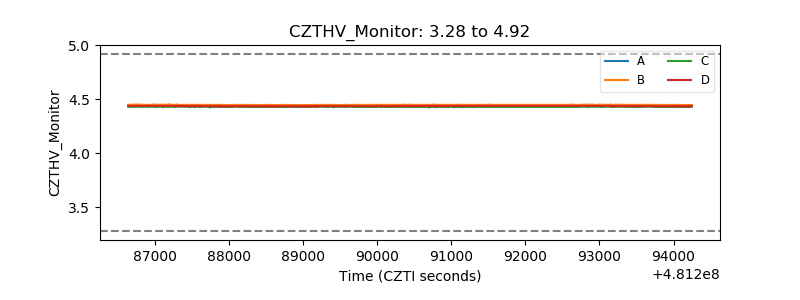 |
| D_VDD | 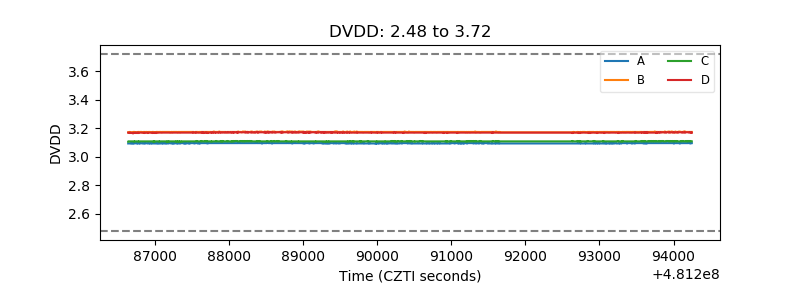 |
| Temperature 1 | 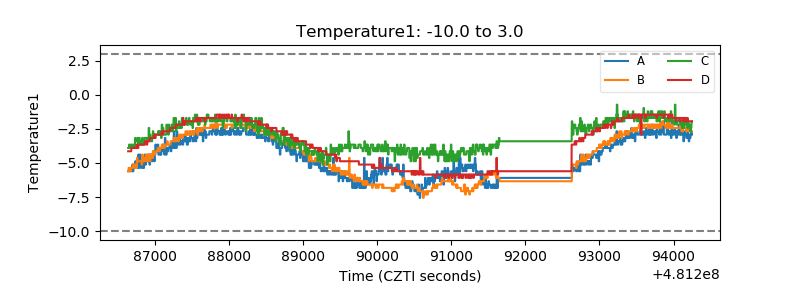 |
| Veto HV Monitor | 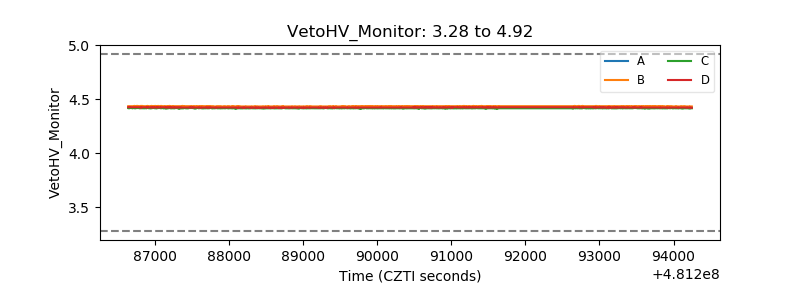 |
| Veto LLD | 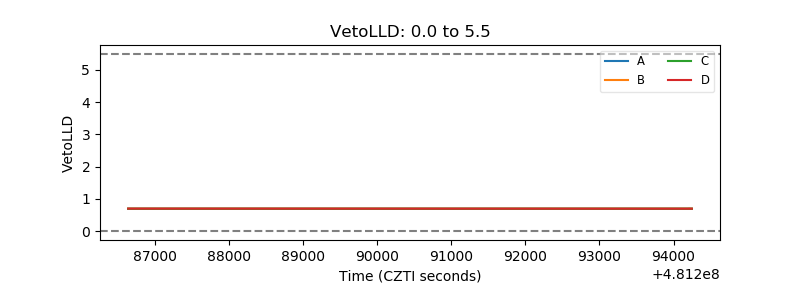 |
| Alpha Counter | 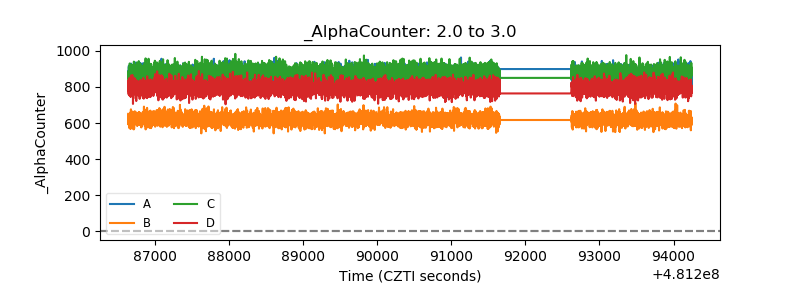 |
| _CPM_Rate | 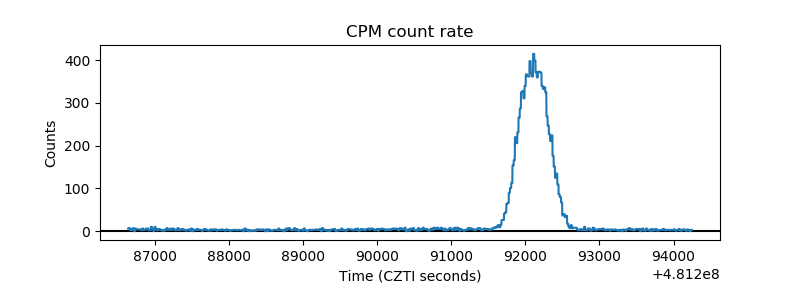 |
| CZT Counter | 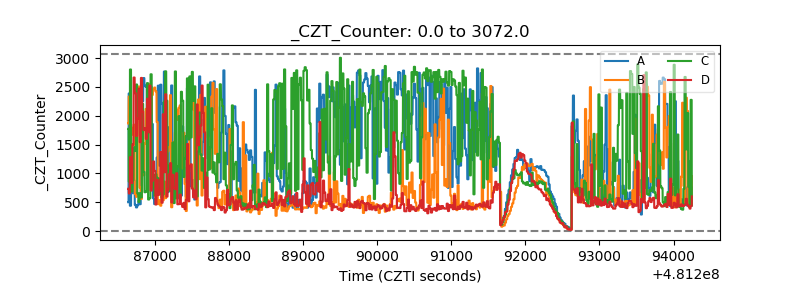 |
| +2.5 Volts monitor | 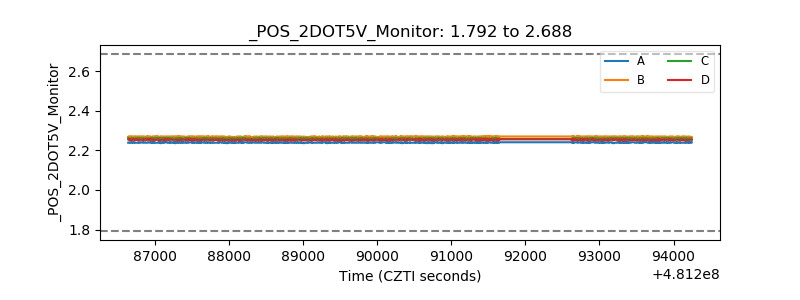 |
| +5 Volts monitor | 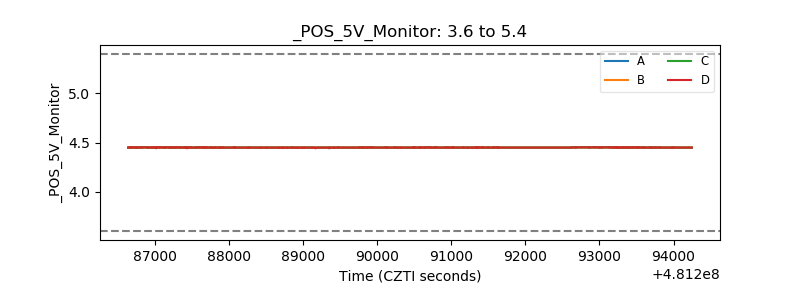 |
| _ROLL_ROT | 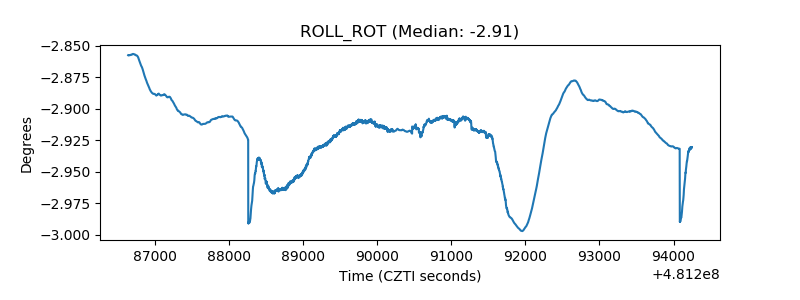 |
| _Roll_DEC | 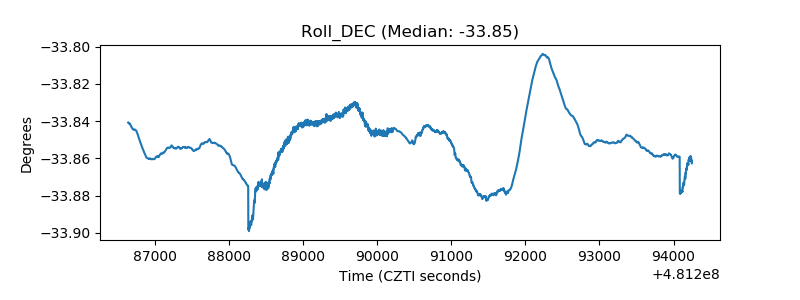 |
| _Roll_RA | 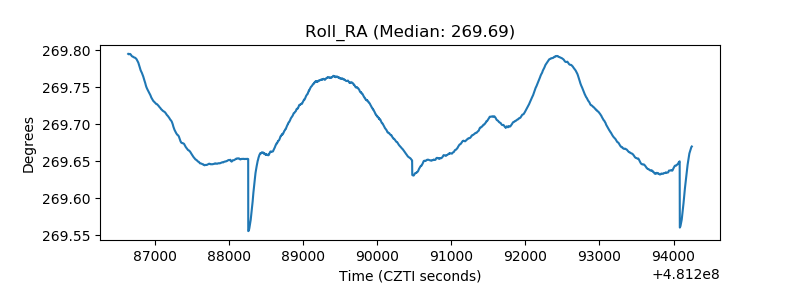 |
| Veto Counter | 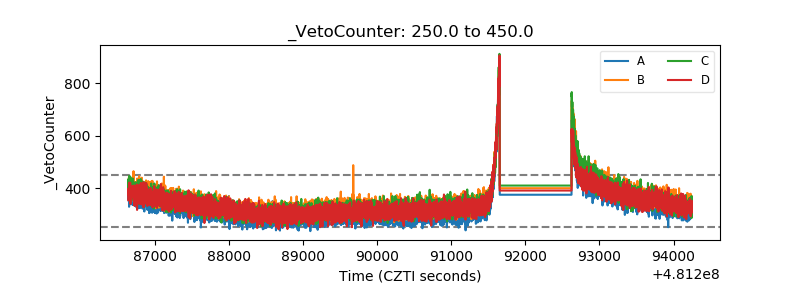 |