| Param | Original file | Final file |
|---|---|---|
| Filename | modeM0/AS1A13_090T01_9000006458_51450cztM0_level2.fits | modeM0/AS1A13_090T01_9000006458_51450cztM0_level2_quad_clean.evt |
| Size (bytes) | 592,634,880 | 91,048,320 |
| Size | 565.2 MB | 86.8 MB |
| Events in quadrant A | 6,014,717 | 568,727 |
| Events in quadrant B | 5,284,425 | 618,923 |
| Events in quadrant C | 6,146,702 | 556,662 |
| Events in quadrant D | 3,987,926 | 559,296 |
| Mode M0 | |||
|---|---|---|---|
| Quadrant | BADHDUFLAG | Total packets | Discarded packets |
| A | 0 | 22322 | 1 |
| B | 0 | 20146 | 1 |
| C | 0 | 22683 | 1 |
| D | 0 | 16472 | 1 |
| Mode M9 | |||
|---|---|---|---|
| Quadrant | BADHDUFLAG | Total packets | Discarded packets |
| A | 0 | 11 | 0 |
| B | 0 | 11 | 0 |
| C | 0 | 11 | 0 |
| D | 0 | 11 | 0 |
| Mode SS | |||
|---|---|---|---|
| Quadrant | BADHDUFLAG | Total packets | Discarded packets |
| A | 0 | 132 | 0 |
| B | 0 | 132 | 0 |
| C | 0 | 132 | 0 |
| D | 0 | 132 | 0 |
| Quadrant | Total seconds | Saturated seconds | Saturation percentage |
|---|---|---|---|
| A | 6496 | 826 | 12.715517% |
| B | 6497 | 796 | 12.251809% |
| C | 6497 | 798 | 12.282592% |
| D | 6497 | 238 | 3.663229% |
Noise dominated data is calculated using 1-second bins in cleaned event files. If a bin has >2000 counts, and if more than 50% of those come from <1% of pixels, then it is considered to be noise-dominated and hence unusable.
| Quadrant | # 1 sec bins | Bins with >0 counts | Bins with >2000 counts | High rate bins dominated by noise | Noise dominated (total time) | Noise dominated (detector-on time) | Marked lightcurve |
|---|---|---|---|---|---|---|---|
| A | 7575 | 6495 | 711 | 711 | 9.39% | 10.95% | 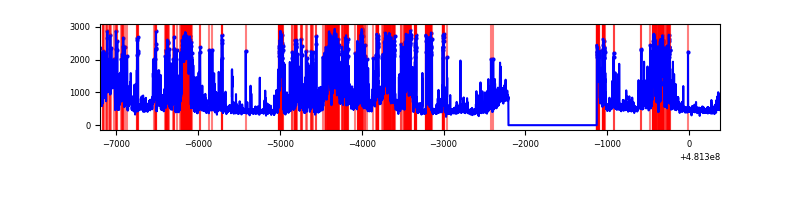 |
| B | 7576 | 6496 | 528 | 528 | 6.97% | 8.13% | 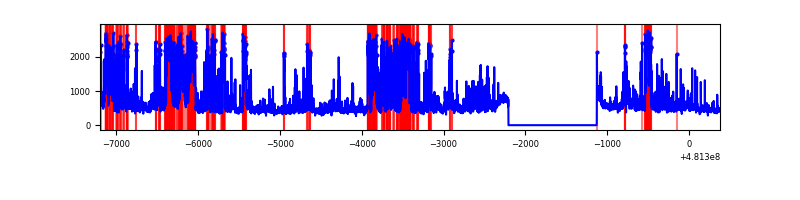 |
| C | 7576 | 6496 | 710 | 710 | 9.37% | 10.93% | 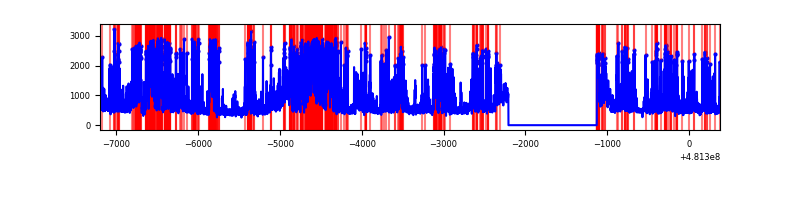 |
| D | 7576 | 6496 | 196 | 196 | 2.59% | 3.02% | 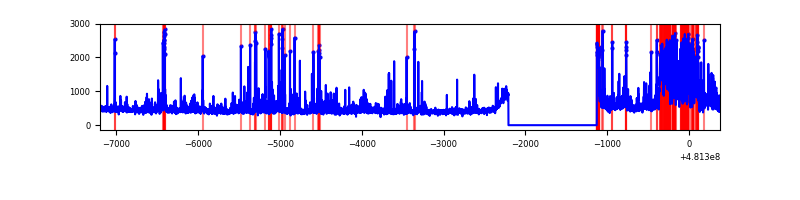 |
Top three noisy pixels from each quadrant. If the there are fewer than three noisy pixels in the level2.evt file, extra rows are filled as -1
| Pixel properties | Quadrant properties | ||||||
|---|---|---|---|---|---|---|---|
| Quadrant | DetID | PixID | Counts | Sigma | Mean | Median | Sigma |
| A | 7 | 64 | 1775434 | 10572.65 | 683 | 666 | 167.9 |
| A | 15 | 174 | 515194 | 3065.15 | 683 | 666 | 167.9 |
| A | 12 | 3 | 455149 | 2707.45 | 683 | 666 | 167.9 |
| B | 5 | 185 | 1572473 | 10929.59 | 679 | 656 | 143.8 |
| B | 4 | 206 | 397748 | 2761.17 | 679 | 656 | 143.8 |
| B | 15 | 52 | 135962 | 940.85 | 679 | 656 | 143.8 |
| C | 4 | 12 | 1491503 | 8169.39 | 663 | 654 | 182.5 |
| C | 15 | 179 | 625636 | 3424.71 | 663 | 654 | 182.5 |
| C | 13 | 3 | 570875 | 3124.63 | 663 | 654 | 182.5 |
| D | 8 | 176 | 712449 | 3731.6 | 688 | 662 | 190.7 |
| D | 8 | 192 | 159519 | 832.82 | 688 | 662 | 190.7 |
| D | 10 | 181 | 112474 | 586.18 | 688 | 662 | 190.7 |
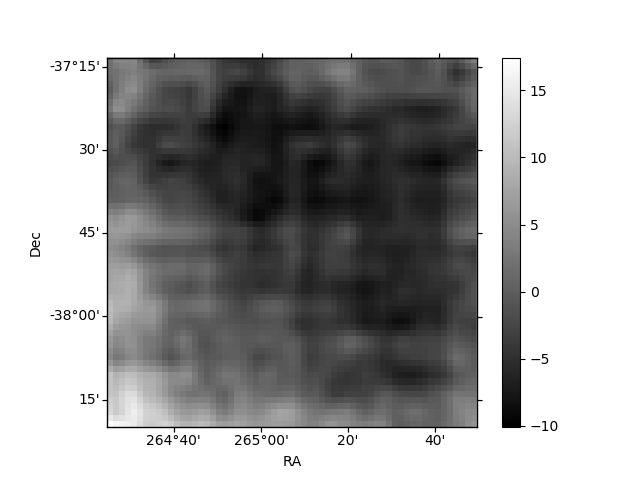
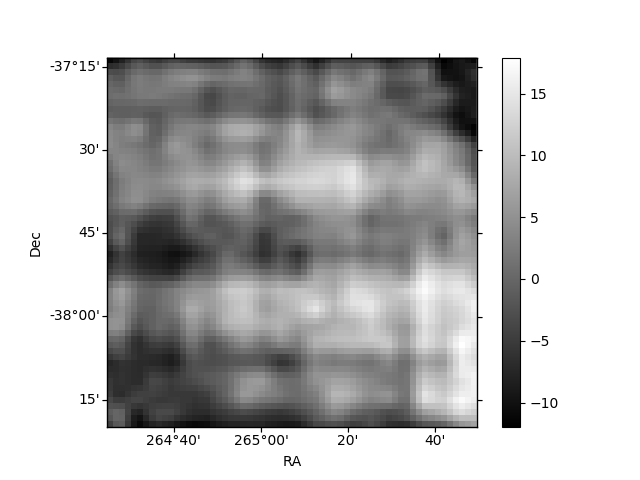
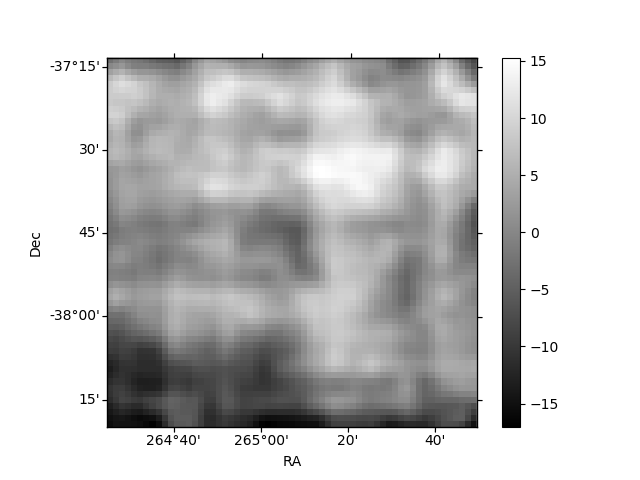
Histogram calculated using DETX and DETY for each event in the final _common_clean file
| Quadrant A | 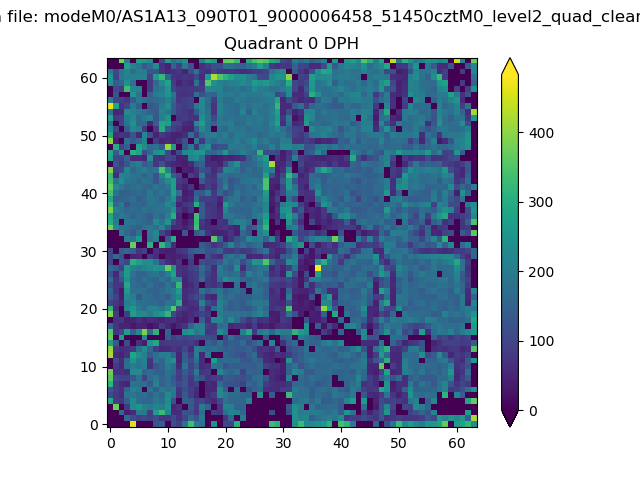 |
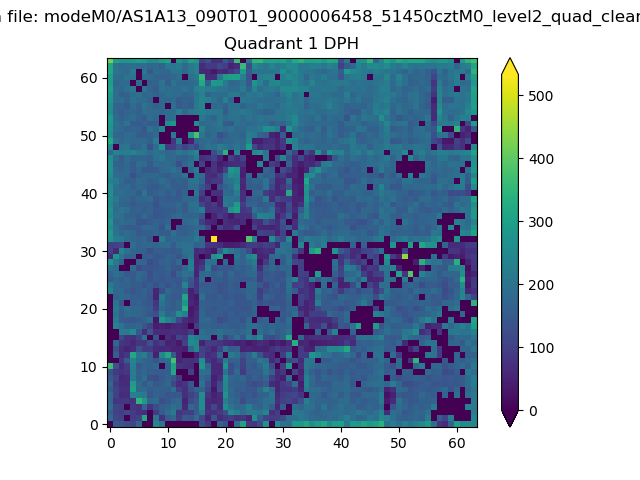 |
Quadrant B |
|---|---|---|---|
| Quadrant D | 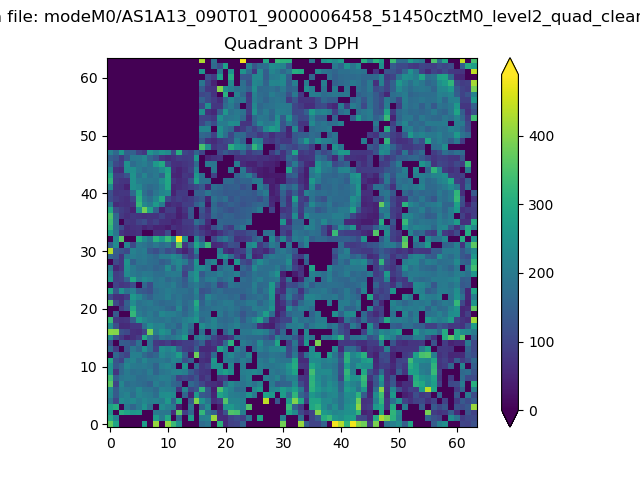 |
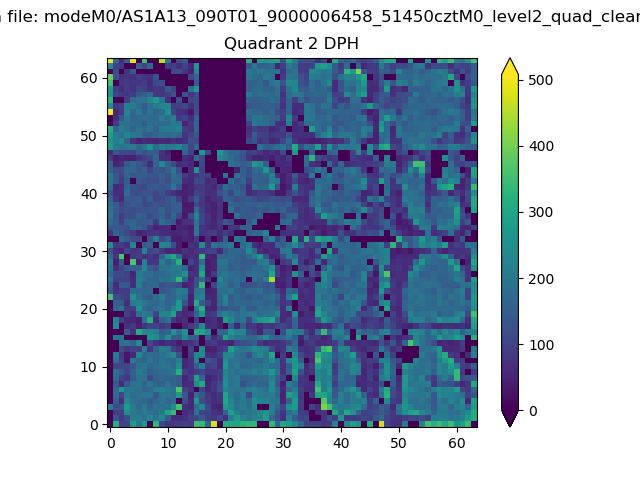 |
Quadrant C |
| Plot type | Count rate plots | Images |
|---|---|---|
| Comparison with Poisson distribution Blue bars denote a histogram of data divided into 1 sec bins. Red curve is a Poisson curve with rate = median count rate of data. |
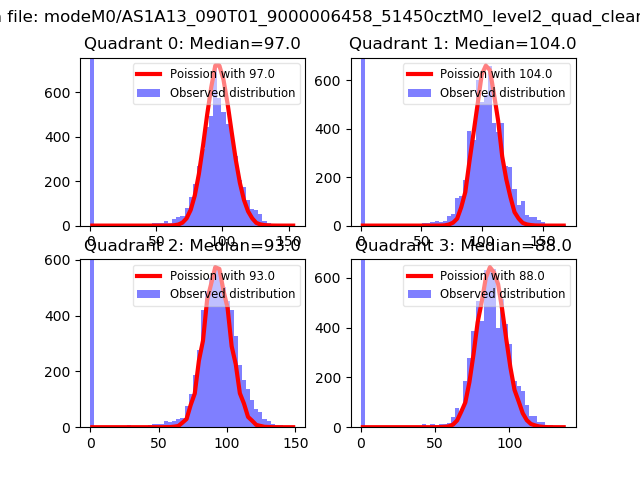 |
 |
| Quadrant-wise count rates Data is divided into 100 sec bins |
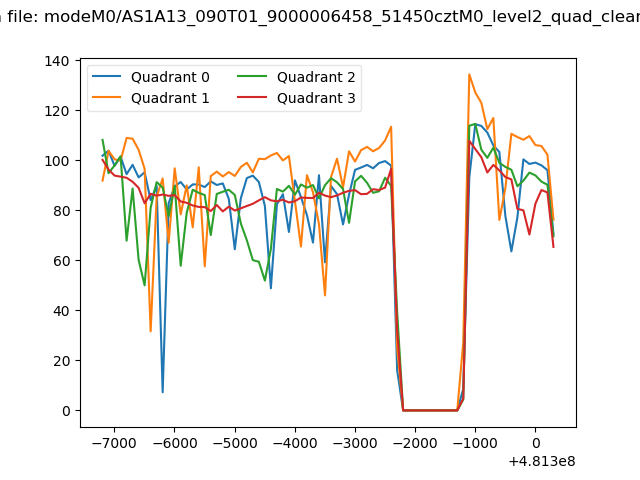 |
|
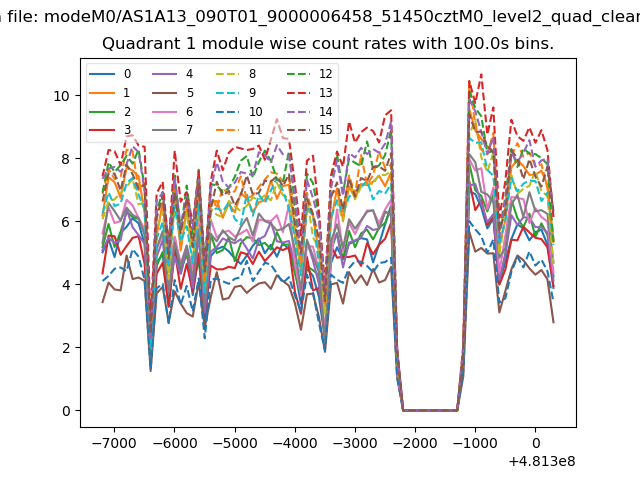
| Module-wise count rates for Quadrant A Data is divided into 100 sec bins |
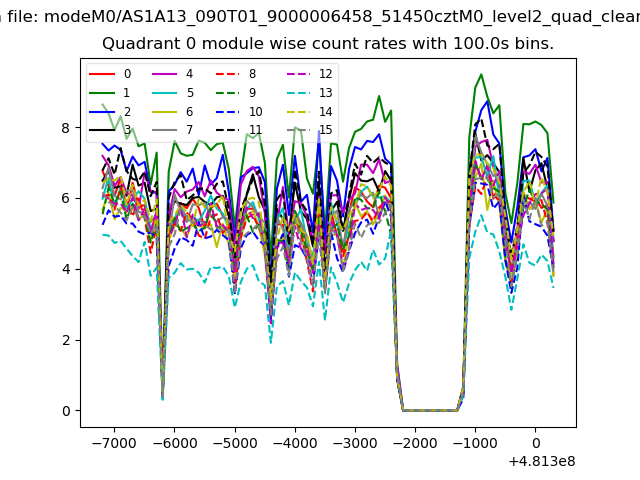 |
 |
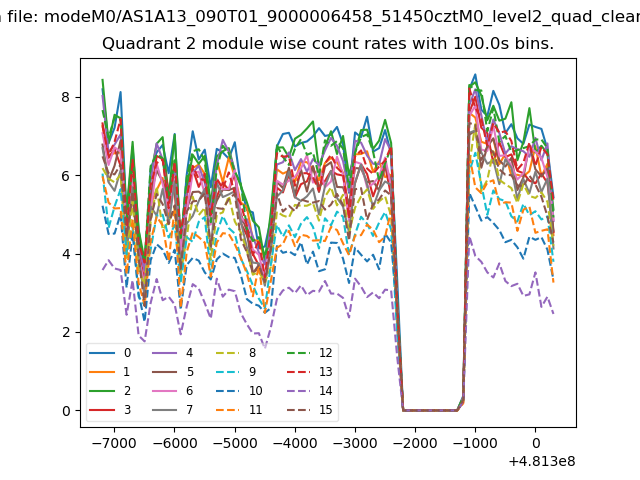
| Module-wise count rates for Quadrant B Data is divided into 100 sec bins |
 |
 |
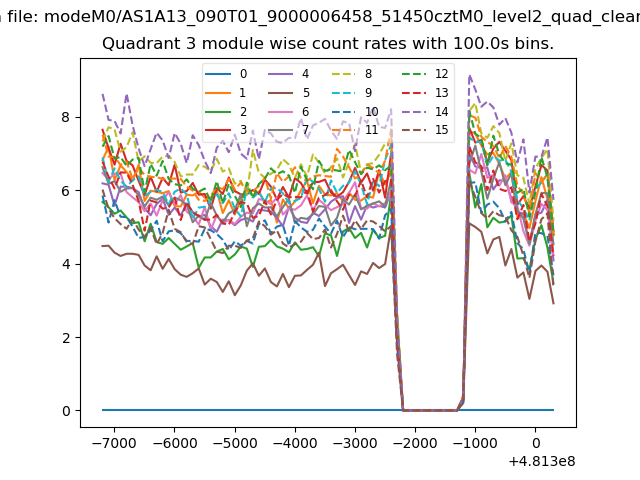
| Module-wise count rates for Quadrant C Data is divided into 100 sec bins |
 |
 |
| Module-wise count rates for Quadrant D Data is divided into 100 sec bins |
 |
 |
| Parameter | Plot |
|---|---|
| CZT HV Monitor | 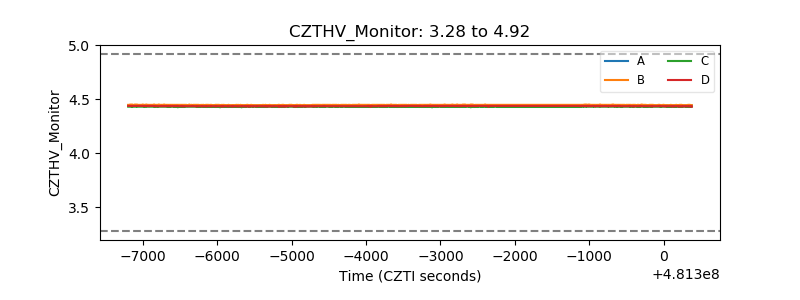 |
| D_VDD | 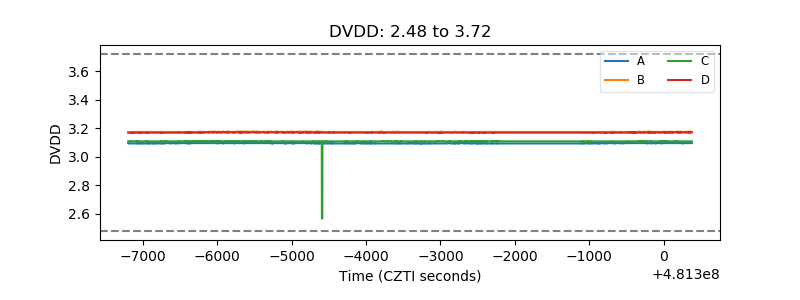 |
| Temperature 1 | 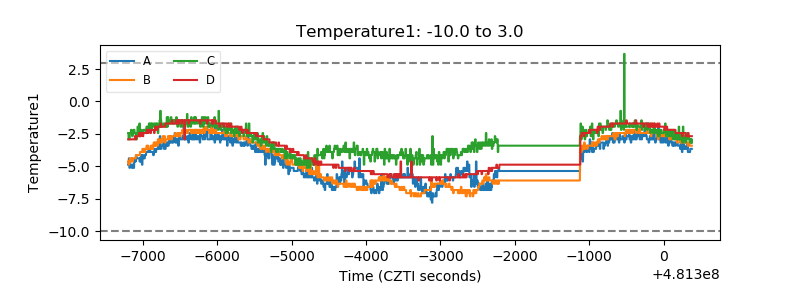 |
| Veto HV Monitor |  |
| Veto LLD | 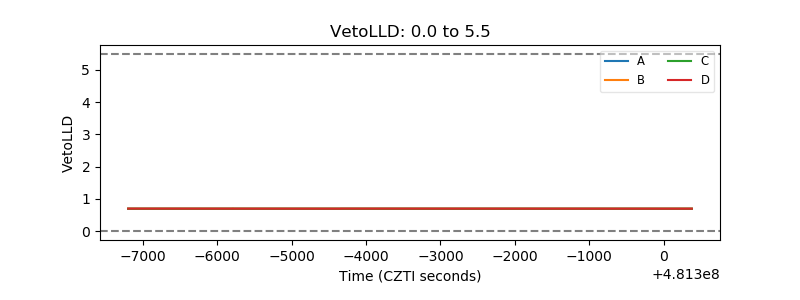 |
| Alpha Counter | 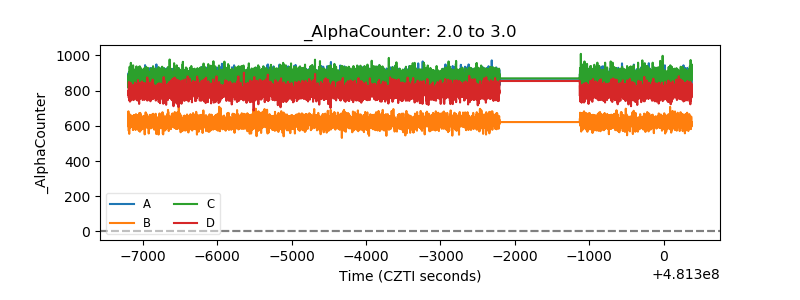 |
| _CPM_Rate | 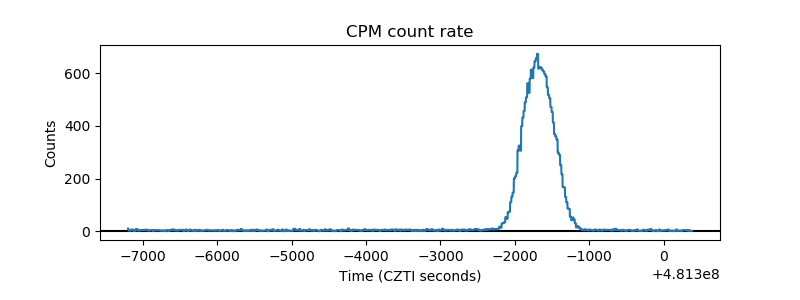 |
| CZT Counter | 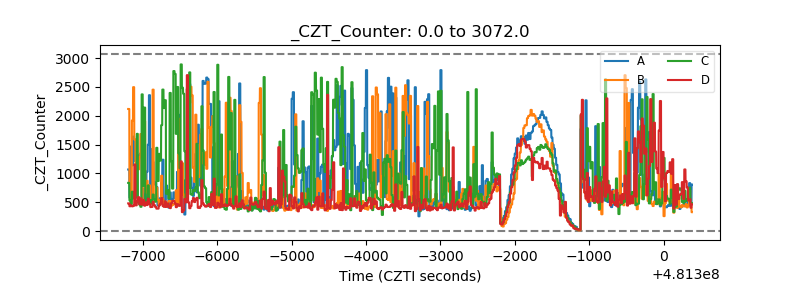 |
| +2.5 Volts monitor | 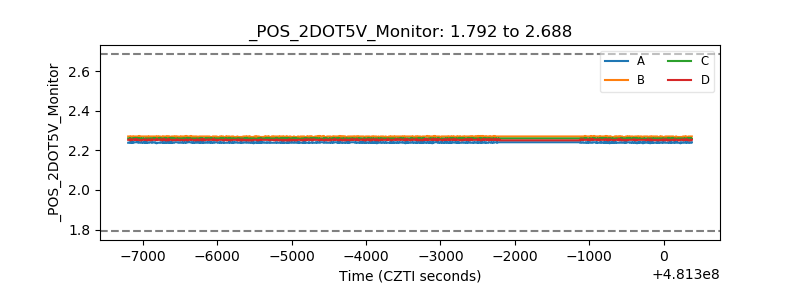 |
| +5 Volts monitor | 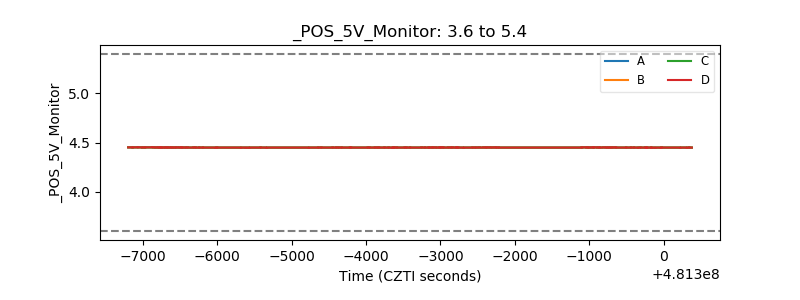 |
| _ROLL_ROT | 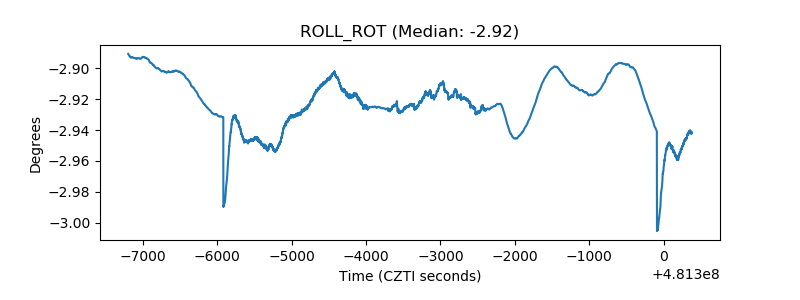 |
| _Roll_DEC | 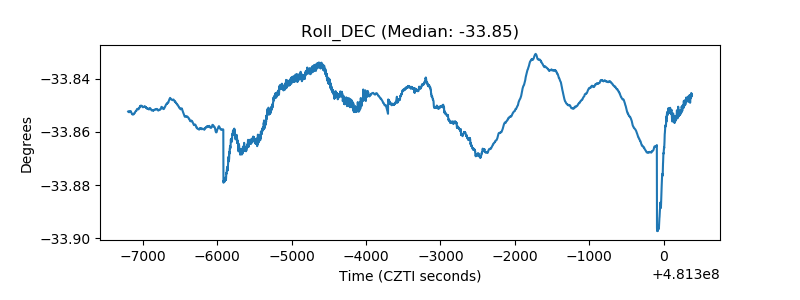 |
| _Roll_RA | 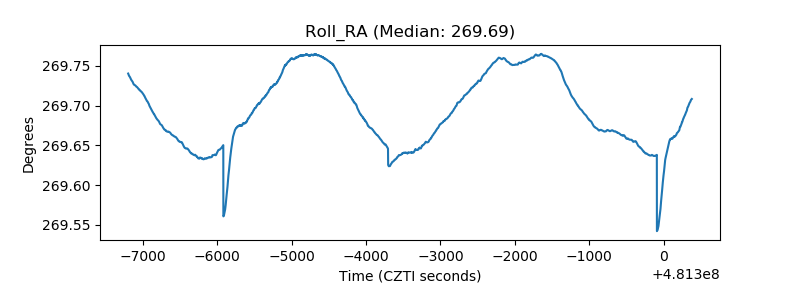 |
| Veto Counter | 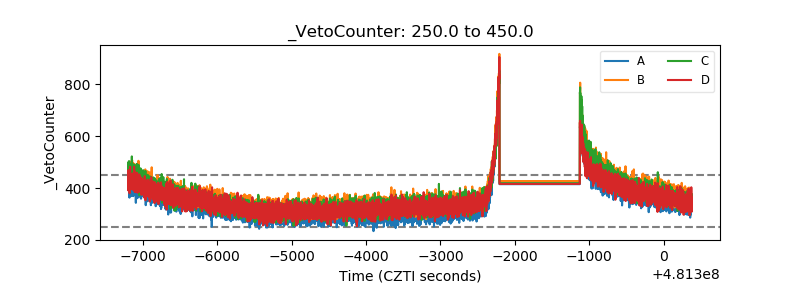 |