| Param | Original file | Final file |
|---|---|---|
| Filename | modeM0/AS1A13_090T01_9000006458_51453cztM0_level2.fits | modeM0/AS1A13_090T01_9000006458_51453cztM0_level2_quad_clean.evt |
| Size (bytes) | 589,106,880 | 92,903,040 |
| Size | 561.8 MB | 88.6 MB |
| Events in quadrant A | 6,858,378 | 573,652 |
| Events in quadrant B | 3,657,619 | 689,483 |
| Events in quadrant C | 6,450,287 | 512,113 |
| Events in quadrant D | 4,321,195 | 571,217 |
| Mode M0 | |||
|---|---|---|---|
| Quadrant | BADHDUFLAG | Total packets | Discarded packets |
| A | 0 | 24925 | 2 |
| B | 0 | 15477 | 2 |
| C | 0 | 23866 | 3 |
| D | 0 | 17587 | 2 |
| Mode M9 | |||
|---|---|---|---|
| Quadrant | BADHDUFLAG | Total packets | Discarded packets |
| A | 0 | 16 | 0 |
| B | 0 | 17 | 0 |
| C | 0 | 17 | 0 |
| D | 0 | 17 | 0 |
| Mode SS | |||
|---|---|---|---|
| Quadrant | BADHDUFLAG | Total packets | Discarded packets |
| A | 0 | 136 | 0 |
| B | 0 | 136 | 0 |
| C | 0 | 136 | 0 |
| D | 0 | 136 | 0 |
| Quadrant | Total seconds | Saturated seconds | Saturation percentage |
|---|---|---|---|
| A | 6691 | 1050 | 15.692722% |
| B | 6691 | 225 | 3.362726% |
| C | 6690 | 1344 | 20.089686% |
| D | 6690 | 285 | 4.260090% |
Noise dominated data is calculated using 1-second bins in cleaned event files. If a bin has >2000 counts, and if more than 50% of those come from <1% of pixels, then it is considered to be noise-dominated and hence unusable.
| Quadrant | # 1 sec bins | Bins with >0 counts | Bins with >2000 counts | High rate bins dominated by noise | Noise dominated (total time) | Noise dominated (detector-on time) | Marked lightcurve |
|---|---|---|---|---|---|---|---|
| A | 7686 | 6692 | 846 | 846 | 11.01% | 12.64% | 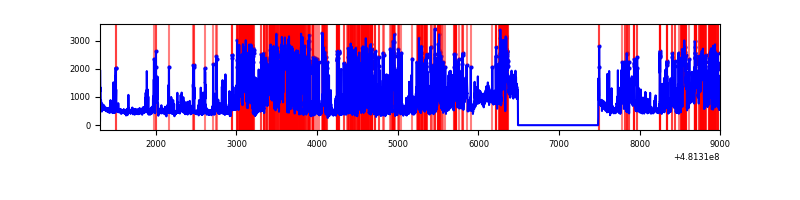 |
| B | 7686 | 6692 | 30 | 30 | 0.39% | 0.45% | 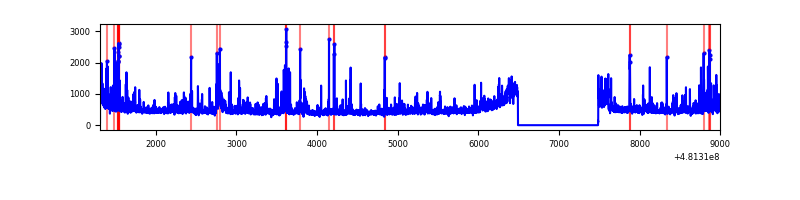 |
| C | 7685 | 6691 | 1246 | 1246 | 16.21% | 18.62% | 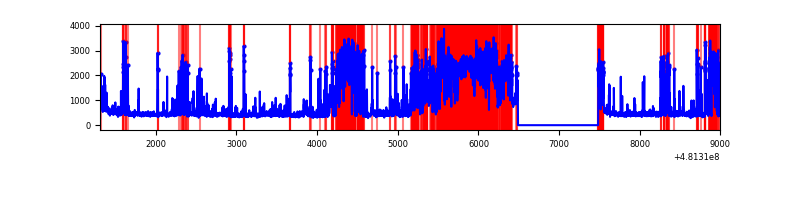 |
| D | 7685 | 6691 | 173 | 173 | 2.25% | 2.59% | 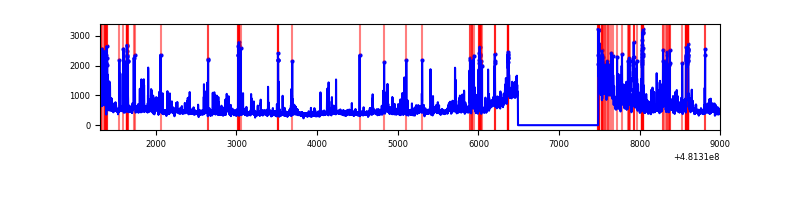 |
Top three noisy pixels from each quadrant. If the there are fewer than three noisy pixels in the level2.evt file, extra rows are filled as -1
| Pixel properties | Quadrant properties | ||||||
|---|---|---|---|---|---|---|---|
| Quadrant | DetID | PixID | Counts | Sigma | Mean | Median | Sigma |
| A | 7 | 64 | 2310682 | 13556.57 | 692 | 674 | 170.4 |
| A | 12 | 3 | 643581 | 3772.98 | 692 | 674 | 170.4 |
| A | 3 | 130 | 415600 | 2435.04 | 692 | 674 | 170.4 |
| B | 4 | 206 | 195526 | 1251.29 | 730 | 704 | 155.7 |
| B | 0 | 171 | 127645 | 815.31 | 730 | 704 | 155.7 |
| B | 15 | 52 | 93790 | 597.87 | 730 | 704 | 155.7 |
| C | 4 | 12 | 1300555 | 7393.97 | 642 | 637 | 175.8 |
| C | 15 | 179 | 1300173 | 7391.79 | 642 | 637 | 175.8 |
| C | 1 | 60 | 610162 | 3466.99 | 642 | 637 | 175.8 |
| D | 8 | 176 | 625836 | 3209.51 | 699 | 672 | 194.8 |
| D | 11 | 176 | 344885 | 1767.14 | 699 | 672 | 194.8 |
| D | 10 | 181 | 211022 | 1079.91 | 699 | 672 | 194.8 |
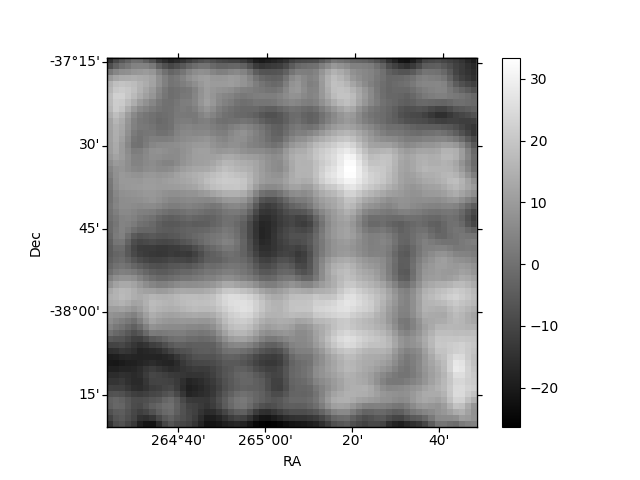
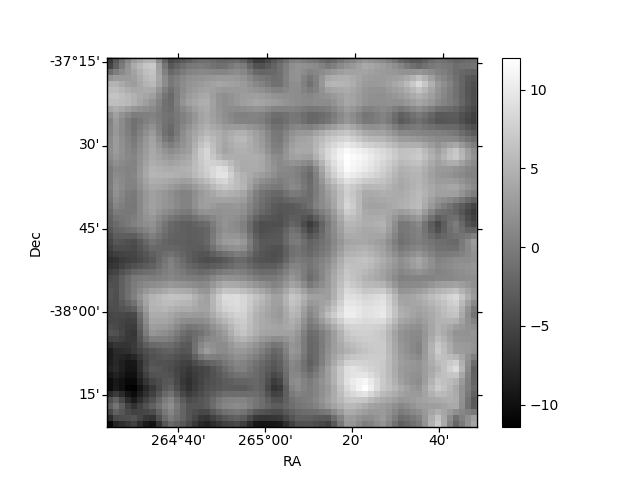
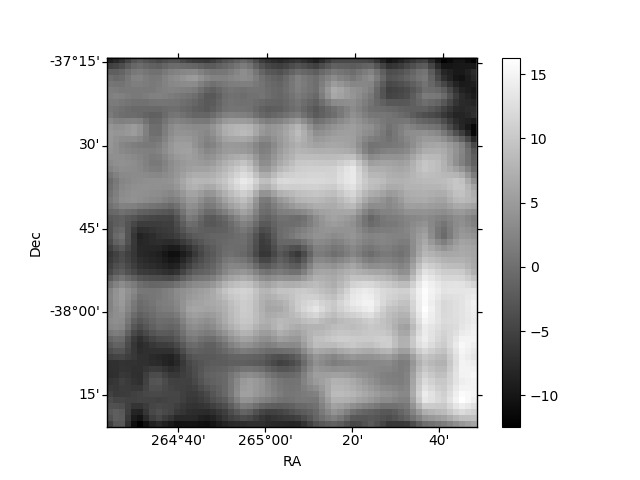
Histogram calculated using DETX and DETY for each event in the final _common_clean file
| Quadrant A | 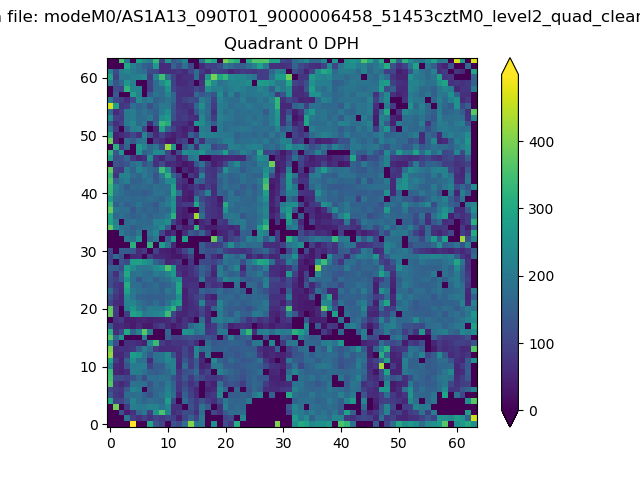 |
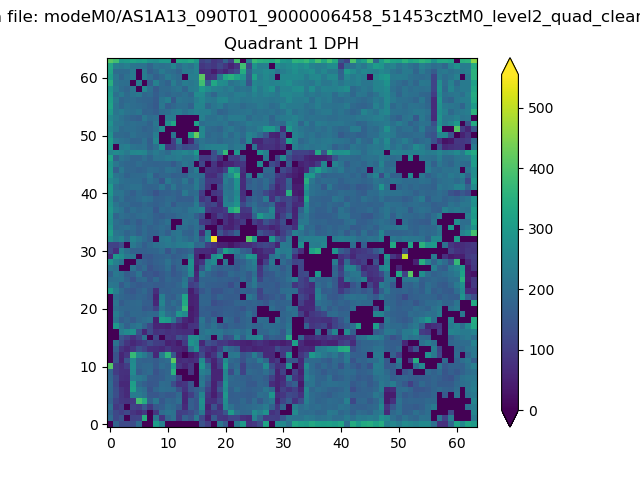 |
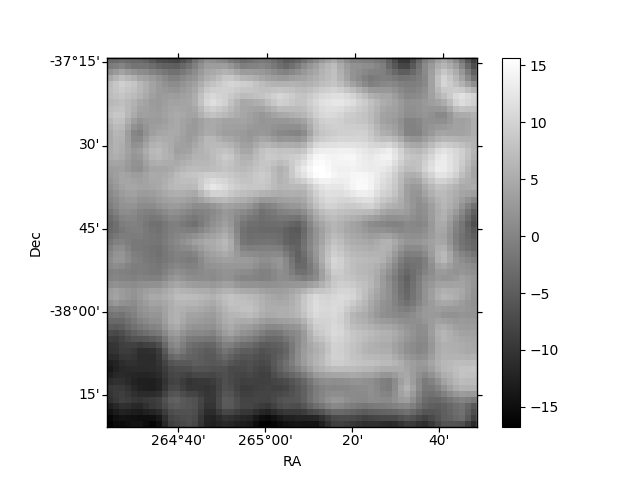
Quadrant B |
|---|---|---|---|
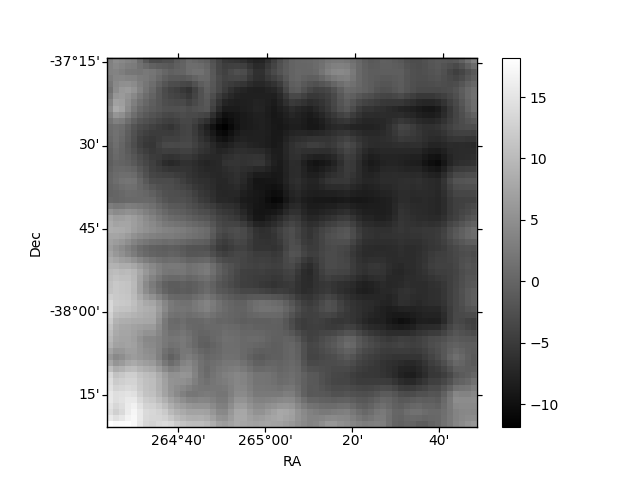
| Quadrant D | 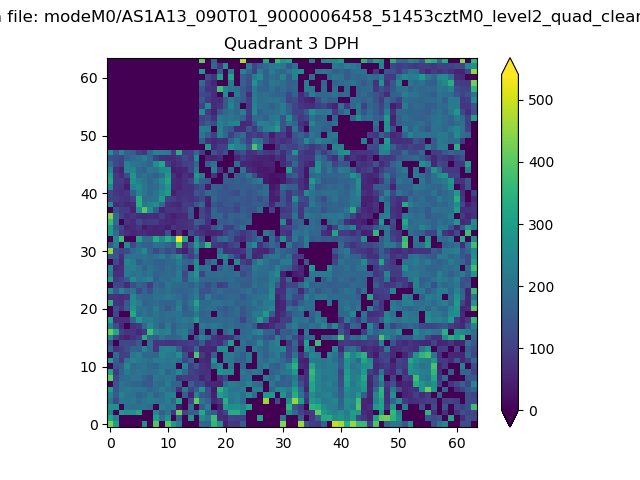 |
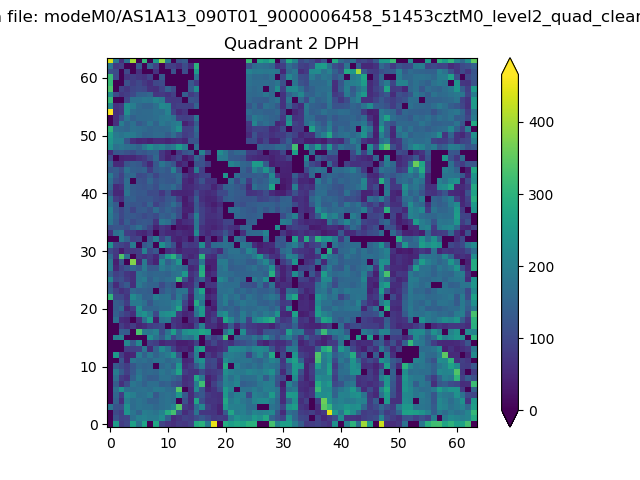 |
Quadrant C |
| Plot type | Count rate plots | Images |
|---|---|---|
| Comparison with Poisson distribution Blue bars denote a histogram of data divided into 1 sec bins. Red curve is a Poisson curve with rate = median count rate of data. |
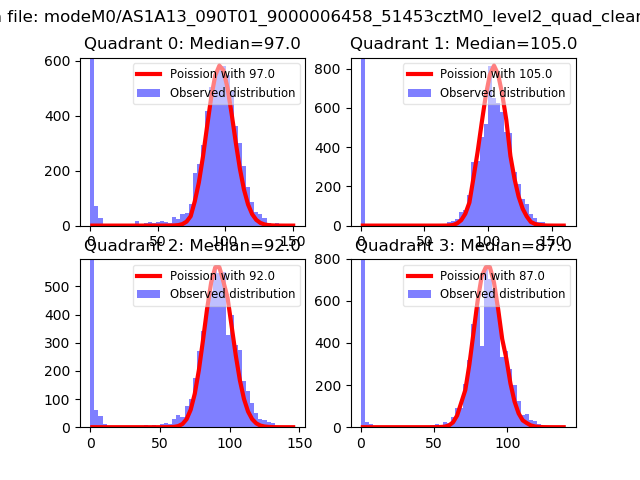 |
 |
| Quadrant-wise count rates Data is divided into 100 sec bins |
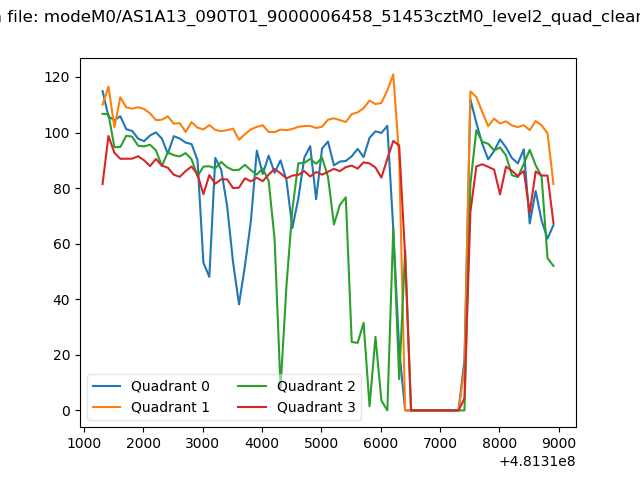 |
|
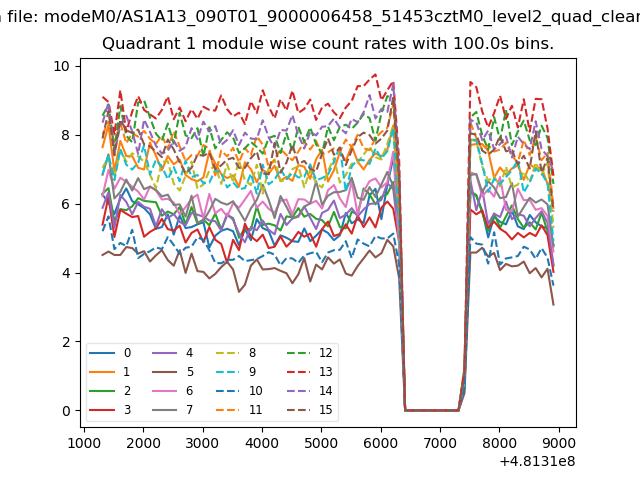
| Module-wise count rates for Quadrant A Data is divided into 100 sec bins |
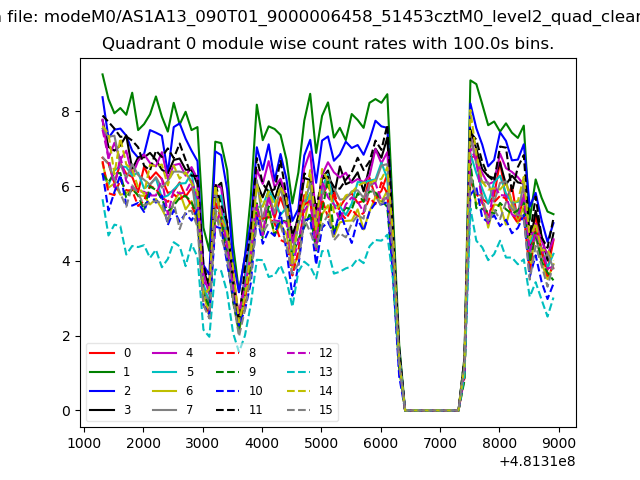 |
 |
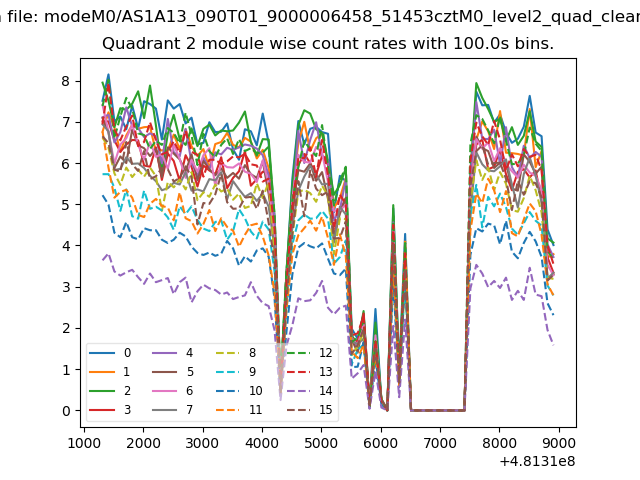
| Module-wise count rates for Quadrant B Data is divided into 100 sec bins |
 |
 |
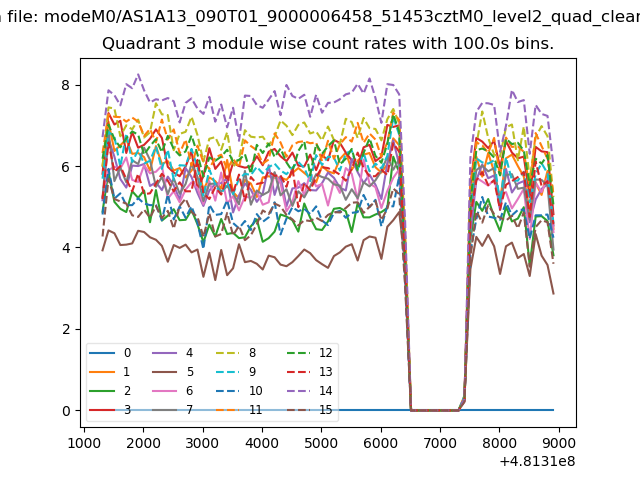
| Module-wise count rates for Quadrant C Data is divided into 100 sec bins |
 |
 |
| Module-wise count rates for Quadrant D Data is divided into 100 sec bins |
 |
 |
| Parameter | Plot |
|---|---|
| CZT HV Monitor | 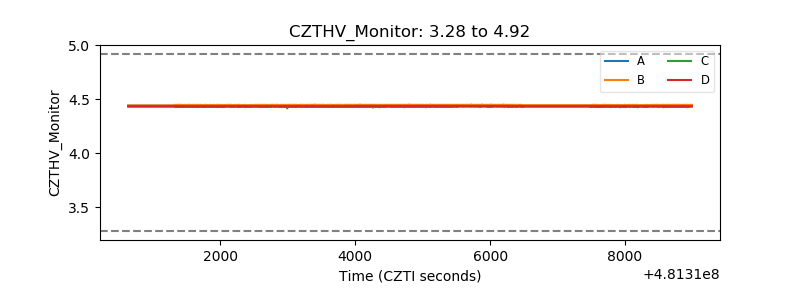 |
| D_VDD | 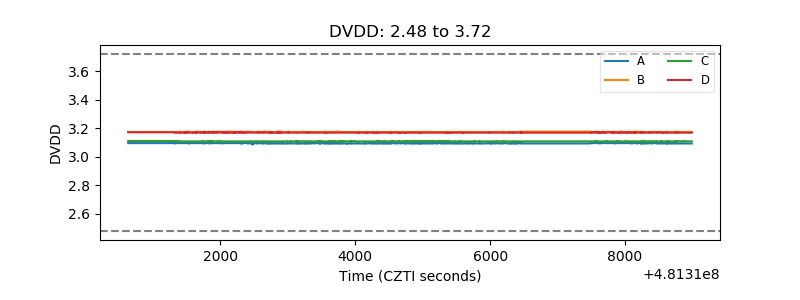 |
| Temperature 1 | 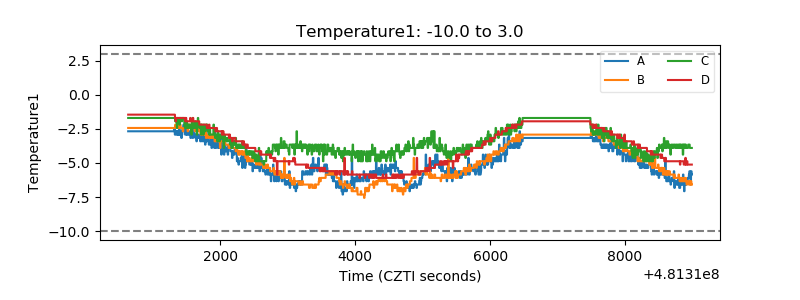 |
| Veto HV Monitor | 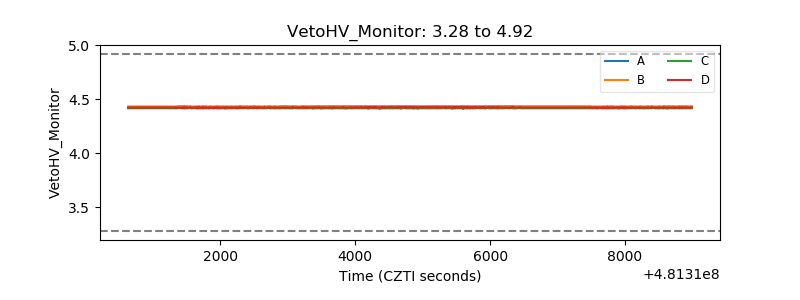 |
| Veto LLD | 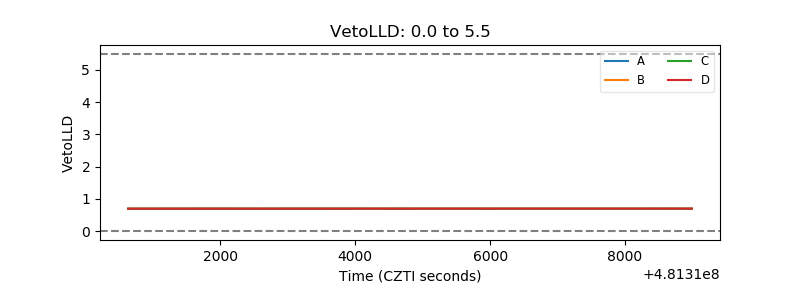 |
| Alpha Counter | 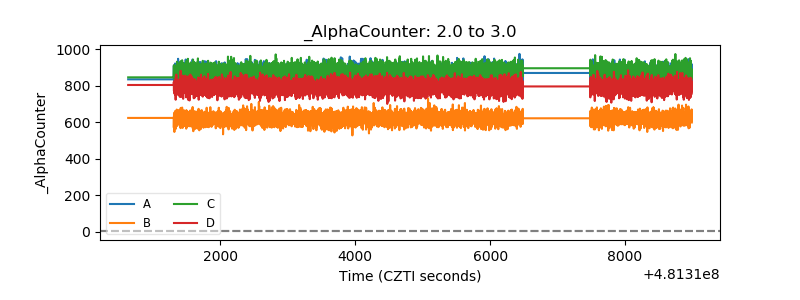 |
| _CPM_Rate | 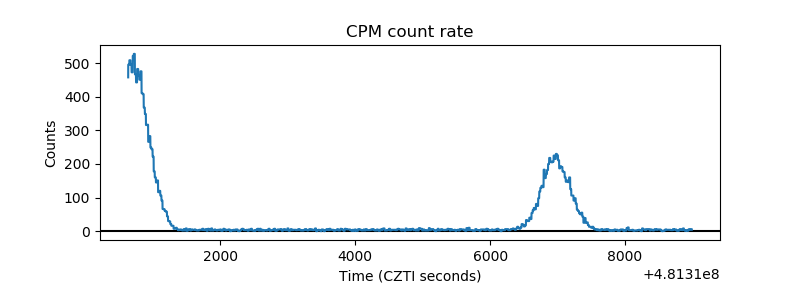 |
| CZT Counter | 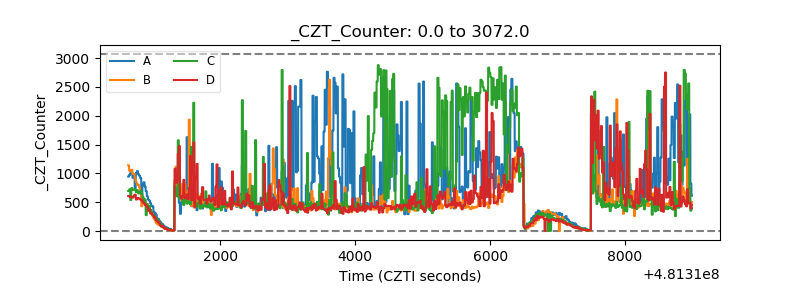 |
| +2.5 Volts monitor | 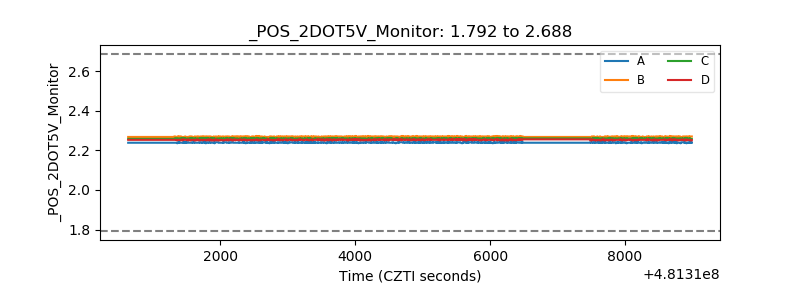 |
| +5 Volts monitor | 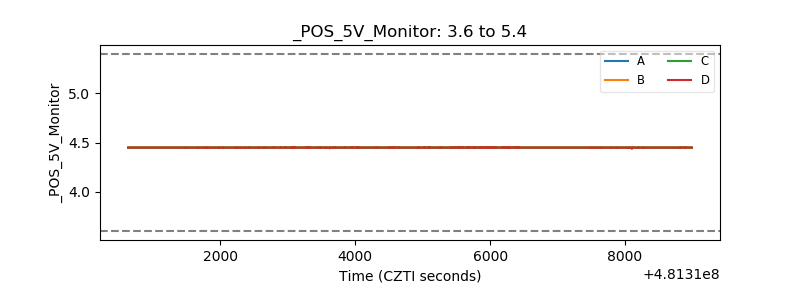 |
| _ROLL_ROT | 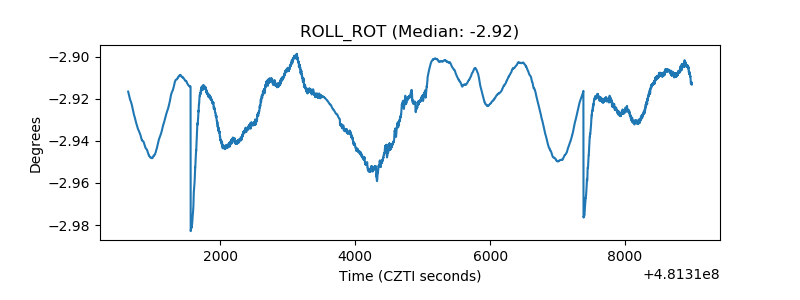 |
| _Roll_DEC | 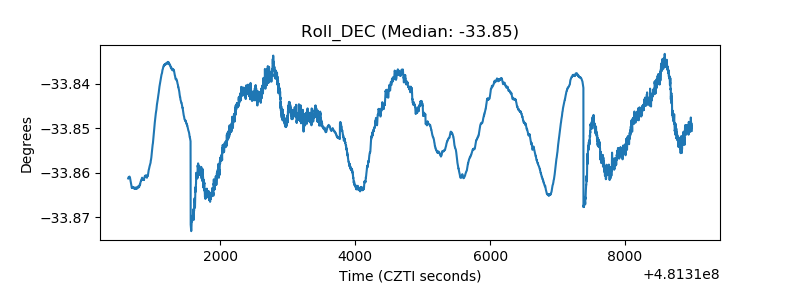 |
| _Roll_RA | 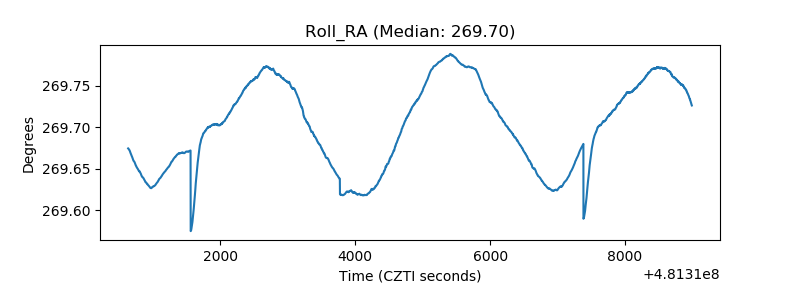 |
| Veto Counter | 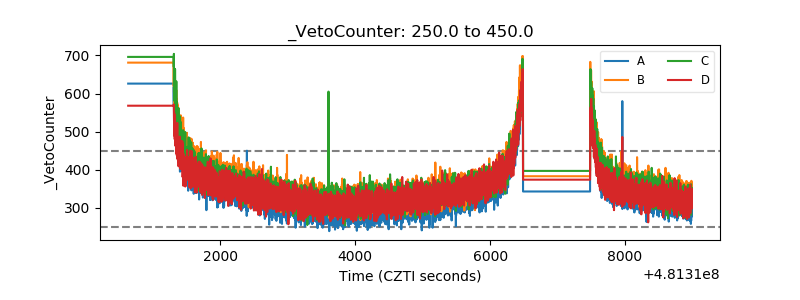 |