| Param | Original file | Final file |
|---|---|---|
| Filename | modeM0/AS1A13_090T01_9000006458_51454cztM0_level2.fits | modeM0/AS1A13_090T01_9000006458_51454cztM0_level2_quad_clean.evt |
| Size (bytes) | 691,056,000 | 93,669,120 |
| Size | 659.0 MB | 89.3 MB |
| Events in quadrant A | 7,379,556 | 585,855 |
| Events in quadrant B | 4,444,001 | 691,398 |
| Events in quadrant C | 8,062,443 | 509,422 |
| Events in quadrant D | 5,155,925 | 564,891 |
| Mode M0 | |||
|---|---|---|---|
| Quadrant | BADHDUFLAG | Total packets | Discarded packets |
| A | 0 | 26794 | 2 |
| B | 0 | 18086 | 2 |
| C | 0 | 28859 | 2 |
| D | 0 | 20258 | 2 |
| Mode M9 | |||
|---|---|---|---|
| Quadrant | BADHDUFLAG | Total packets | Discarded packets |
| A | 0 | 15 | 0 |
| B | 0 | 16 | 0 |
| C | 0 | 16 | 0 |
| D | 0 | 16 | 0 |
| Mode SS | |||
|---|---|---|---|
| Quadrant | BADHDUFLAG | Total packets | Discarded packets |
| A | 0 | 140 | 0 |
| B | 0 | 140 | 0 |
| C | 0 | 140 | 0 |
| D | 0 | 140 | 0 |
| Quadrant | Total seconds | Saturated seconds | Saturation percentage |
|---|---|---|---|
| A | 6956 | 998 | 14.347326% |
| B | 6956 | 389 | 5.592294% |
| C | 6956 | 1651 | 23.734905% |
| D | 6956 | 442 | 6.354227% |
Noise dominated data is calculated using 1-second bins in cleaned event files. If a bin has >2000 counts, and if more than 50% of those come from <1% of pixels, then it is considered to be noise-dominated and hence unusable.
| Quadrant | # 1 sec bins | Bins with >0 counts | Bins with >2000 counts | High rate bins dominated by noise | Noise dominated (total time) | Noise dominated (detector-on time) | Marked lightcurve |
|---|---|---|---|---|---|---|---|
| A | 7741 | 6958 | 722 | 722 | 9.33% | 10.38% | 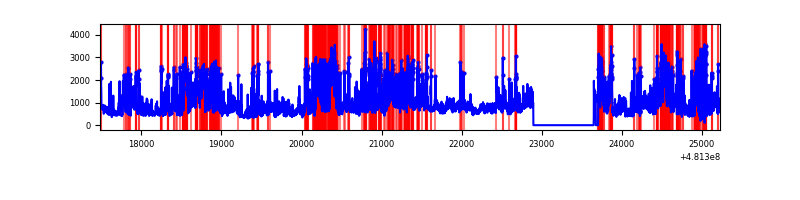 |
| B | 7741 | 6958 | 175 | 175 | 2.26% | 2.52% | 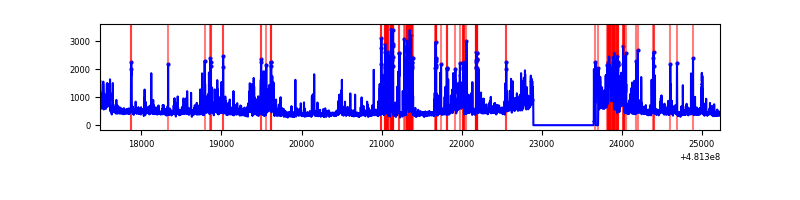 |
| C | 7741 | 6958 | 1642 | 1642 | 21.21% | 23.60% | 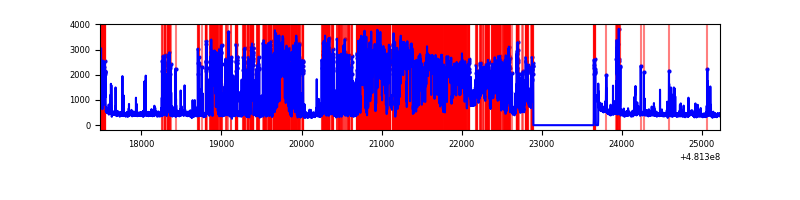 |
| D | 7741 | 6958 | 365 | 365 | 4.72% | 5.25% | 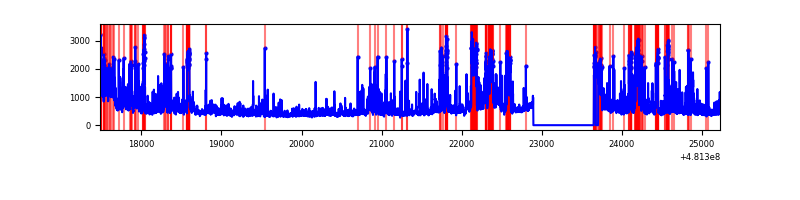 |
Top three noisy pixels from each quadrant. If the there are fewer than three noisy pixels in the level2.evt file, extra rows are filled as -1
| Pixel properties | Quadrant properties | ||||||
|---|---|---|---|---|---|---|---|
| Quadrant | DetID | PixID | Counts | Sigma | Mean | Median | Sigma |
| A | 7 | 64 | 2091609 | 12052.65 | 704 | 686 | 173.5 |
| A | 12 | 3 | 1460926 | 8417.22 | 704 | 686 | 173.5 |
| A | 15 | 174 | 212165 | 1219.02 | 704 | 686 | 173.5 |
| B | 5 | 185 | 754817 | 4822.29 | 736 | 712 | 156.4 |
| B | 4 | 81 | 173686 | 1106.12 | 736 | 712 | 156.4 |
| B | 4 | 206 | 96674 | 613.65 | 736 | 712 | 156.4 |
| C | 4 | 12 | 3442379 | 18939.83 | 656 | 649 | 181.7 |
| C | 15 | 179 | 1540892 | 8475.95 | 656 | 649 | 181.7 |
| C | 13 | 3 | 186916 | 1025.03 | 656 | 649 | 181.7 |
| D | 11 | 176 | 750109 | 3769.7 | 705 | 677 | 198.8 |
| D | 8 | 176 | 749918 | 3768.74 | 705 | 677 | 198.8 |
| D | 3 | 12 | 333124 | 1672.24 | 705 | 677 | 198.8 |
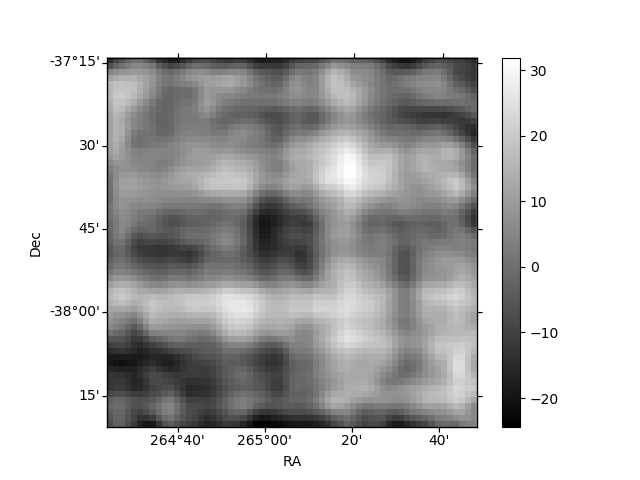
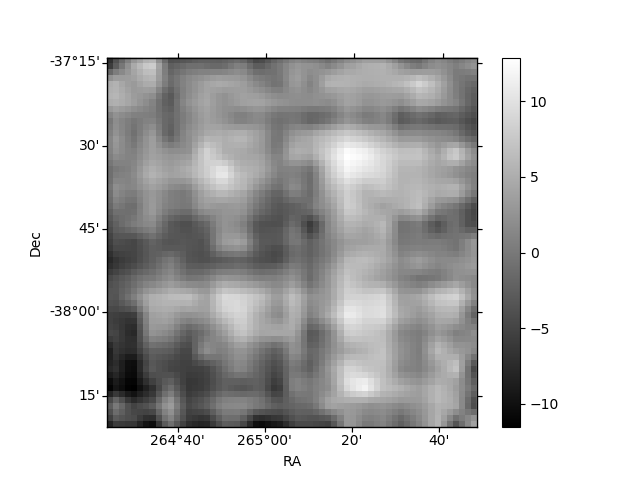
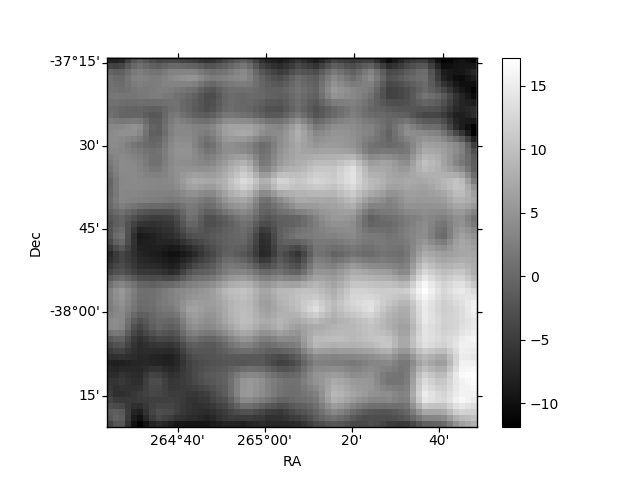
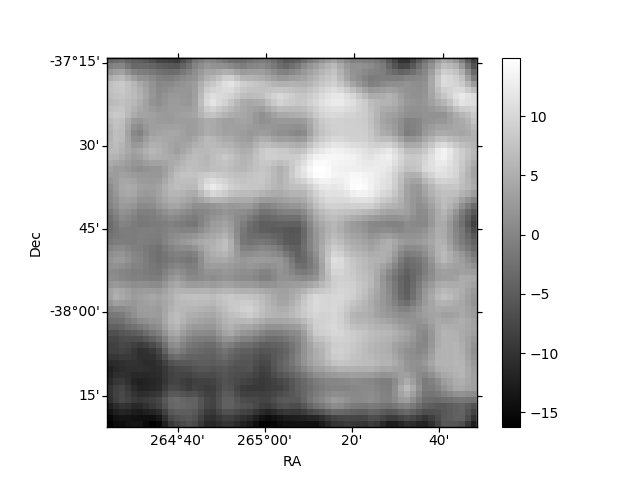
Histogram calculated using DETX and DETY for each event in the final _common_clean file
| Quadrant A | 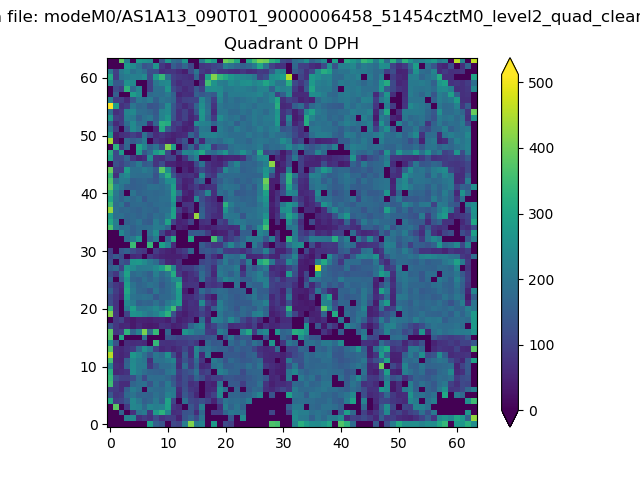 |
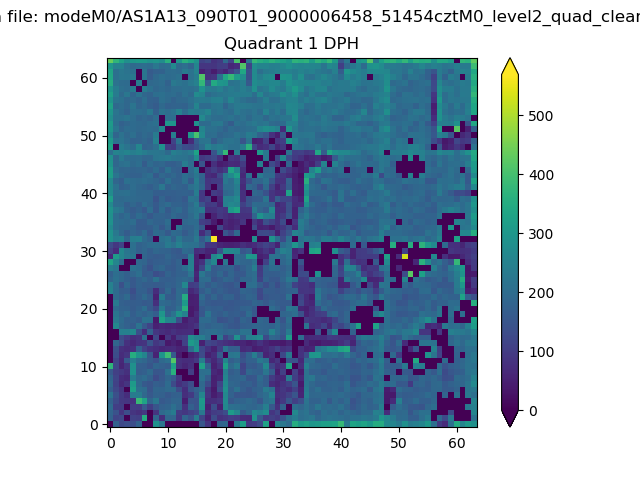 |
Quadrant B |
|---|---|---|---|
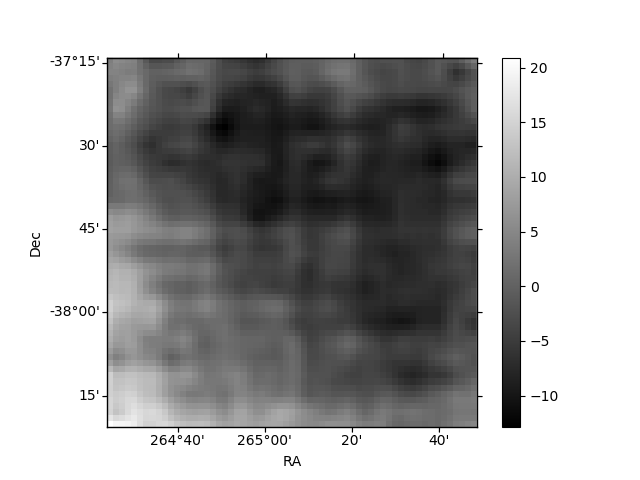
| Quadrant D | 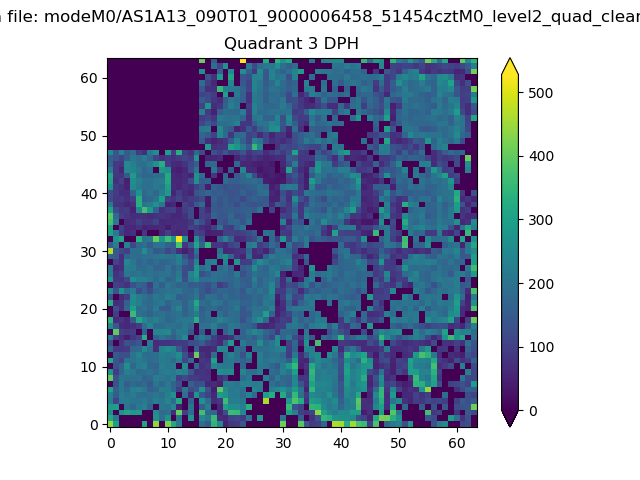 |
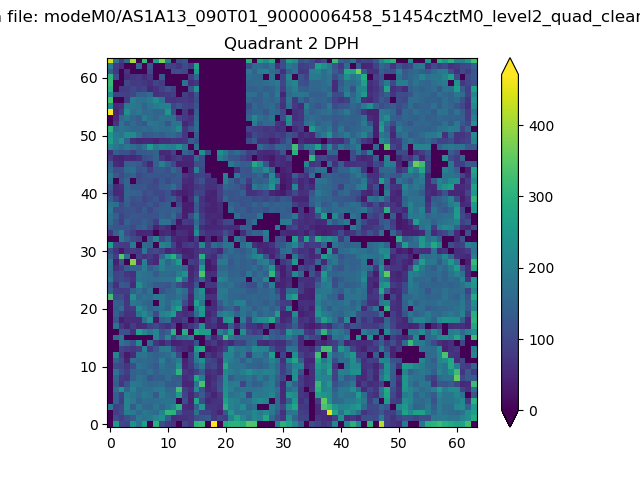 |
Quadrant C |
| Plot type | Count rate plots | Images |
|---|---|---|
| Comparison with Poisson distribution Blue bars denote a histogram of data divided into 1 sec bins. Red curve is a Poisson curve with rate = median count rate of data. |
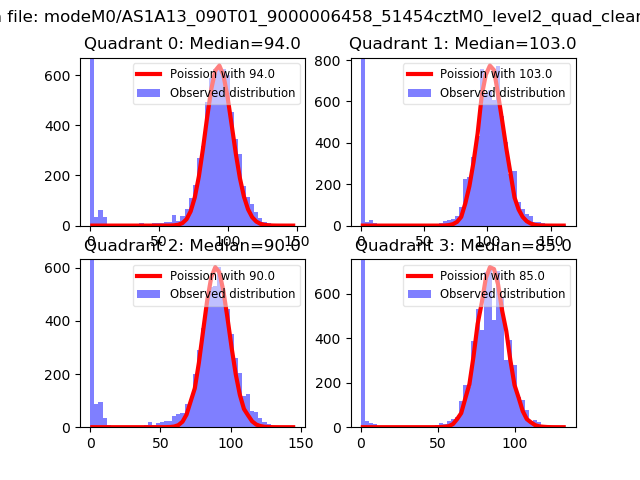 |
 |
| Quadrant-wise count rates Data is divided into 100 sec bins |
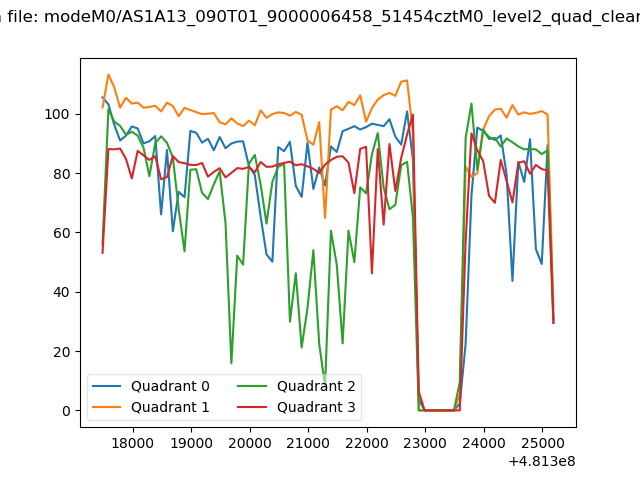 |
|
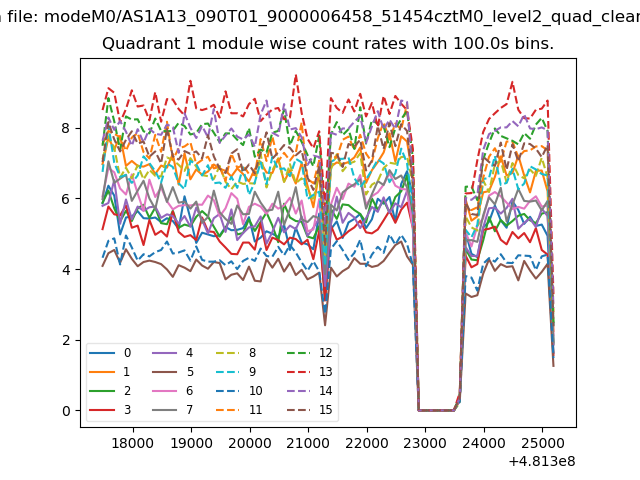
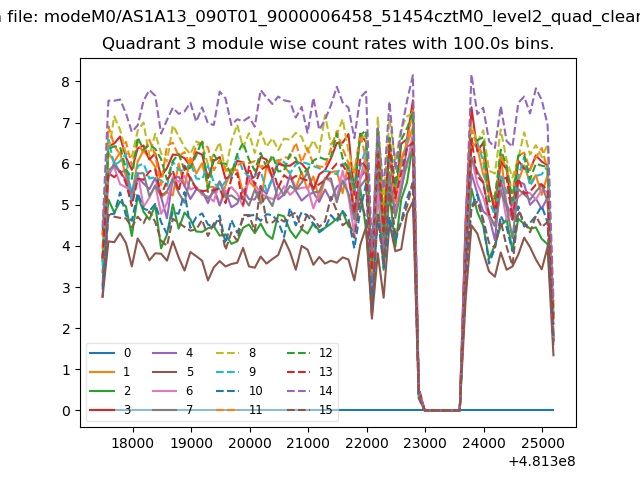
| Module-wise count rates for Quadrant A Data is divided into 100 sec bins |
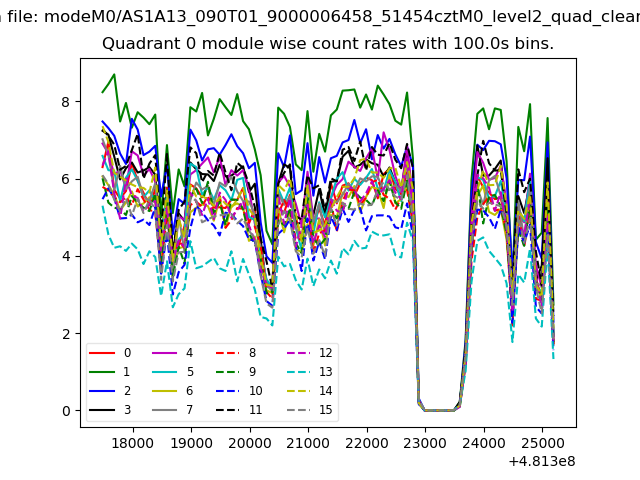 |
 |
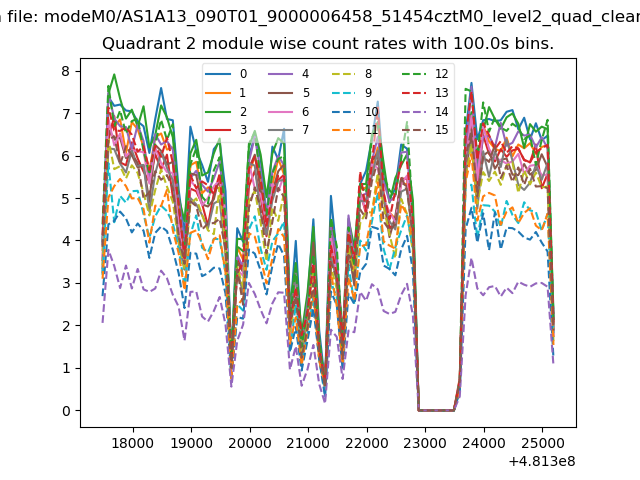
| Module-wise count rates for Quadrant B Data is divided into 100 sec bins |
 |
 |
| Module-wise count rates for Quadrant C Data is divided into 100 sec bins |
 |
 |
| Module-wise count rates for Quadrant D Data is divided into 100 sec bins |
 |
 |
| Parameter | Plot |
|---|---|
| CZT HV Monitor |  |
| D_VDD | 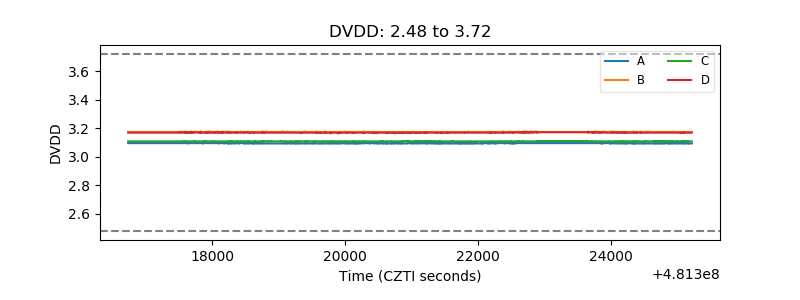 |
| Temperature 1 | 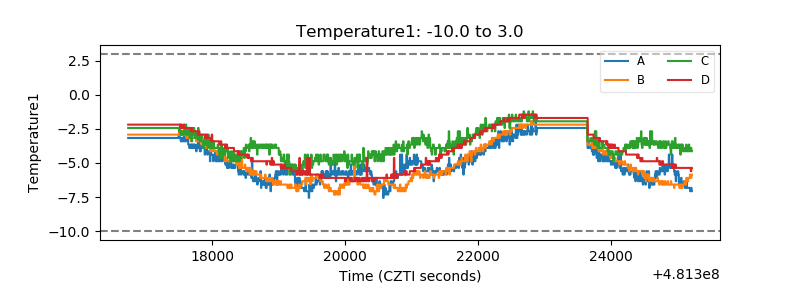 |
| Veto HV Monitor | 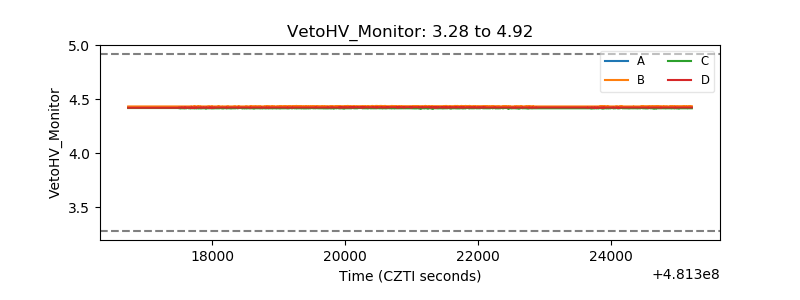 |
| Veto LLD | 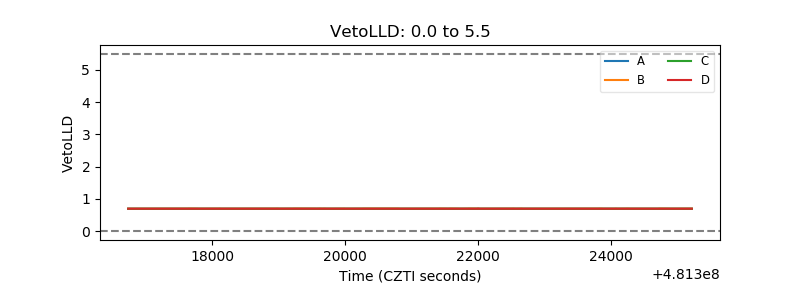 |
| Alpha Counter | 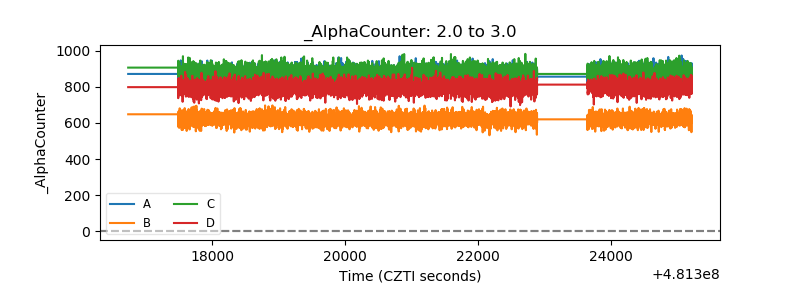 |
| _CPM_Rate | 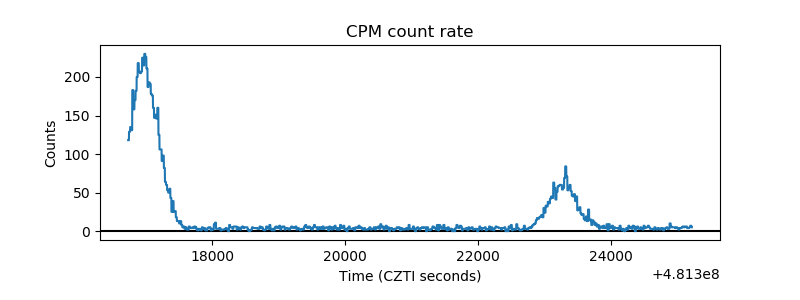 |
| CZT Counter | 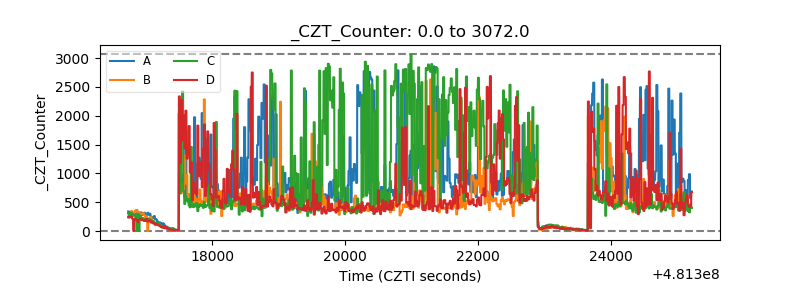 |
| +2.5 Volts monitor | 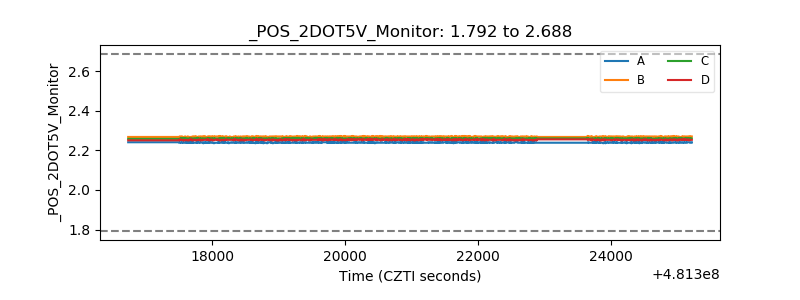 |
| +5 Volts monitor | 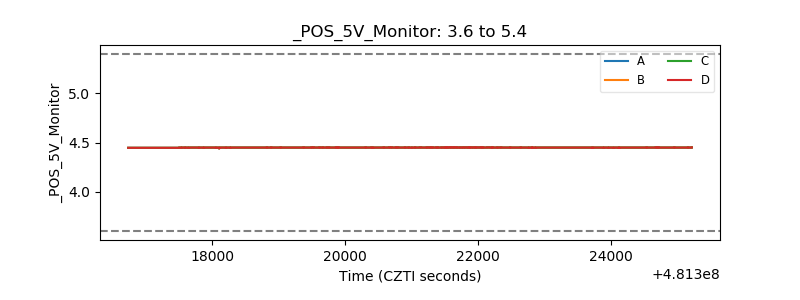 |
| _ROLL_ROT | 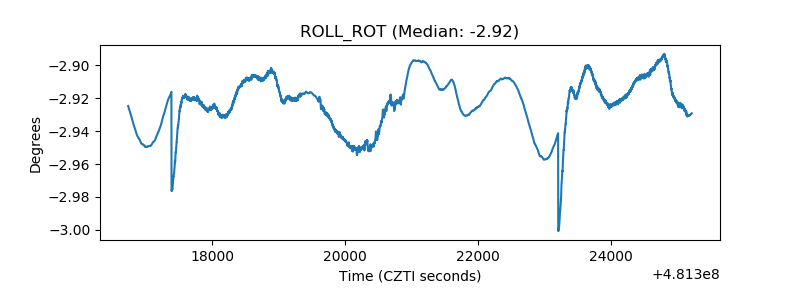 |
| _Roll_DEC | 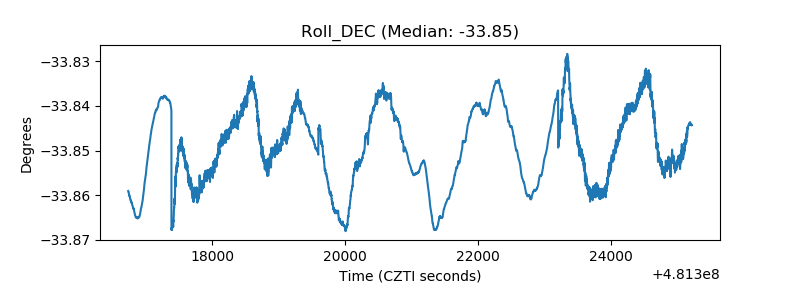 |
| _Roll_RA | 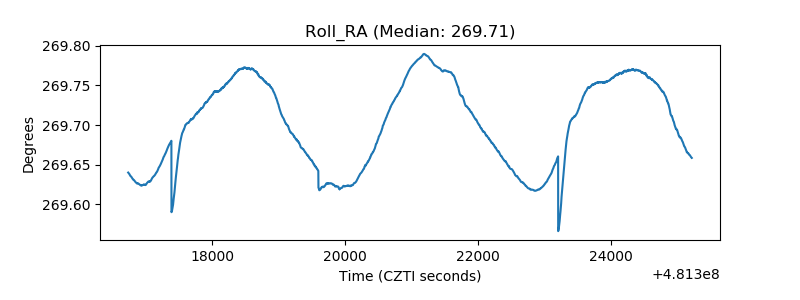 |
| Veto Counter | 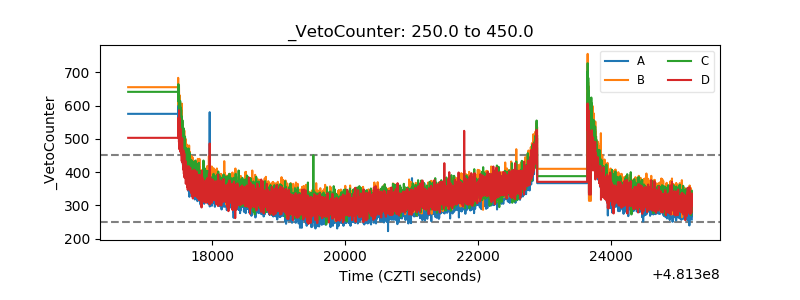 |