| Param | Original file | Final file |
|---|---|---|
| Filename | modeM0/AS1A13_090T01_9000006458_51456cztM0_level2.fits | modeM0/AS1A13_090T01_9000006458_51456cztM0_level2_quad_clean.evt |
| Size (bytes) | 935,415,360 | 98,936,640 |
| Size | 892.1 MB | 94.4 MB |
| Events in quadrant A | 6,824,050 | 715,726 |
| Events in quadrant B | 4,425,237 | 803,958 |
| Events in quadrant C | 11,667,423 | 441,774 |
| Events in quadrant D | 11,085,727 | 473,432 |
| Mode M0 | |||
|---|---|---|---|
| Quadrant | BADHDUFLAG | Total packets | Discarded packets |
| A | 0 | 25954 | 2 |
| B | 0 | 18773 | 1 |
| C | 0 | 40318 | 1 |
| D | 0 | 38547 | 1 |
| Mode M9 | |||
|---|---|---|---|
| Quadrant | BADHDUFLAG | Total packets | Discarded packets |
| A | 0 | 2 | 0 |
| B | 0 | 2 | 0 |
| C | 0 | 2 | 0 |
| D | 0 | 2 | 0 |
| Mode SS | |||
|---|---|---|---|
| Quadrant | BADHDUFLAG | Total packets | Discarded packets |
| A | 0 | 164 | 0 |
| B | 0 | 164 | 0 |
| C | 0 | 164 | 0 |
| D | 0 | 164 | 0 |
| Quadrant | Total seconds | Saturated seconds | Saturation percentage |
|---|---|---|---|
| A | 8060 | 574 | 7.121588% |
| B | 8060 | 203 | 2.518610% |
| C | 8060 | 3299 | 40.930521% |
| D | 8060 | 2660 | 33.002481% |
Noise dominated data is calculated using 1-second bins in cleaned event files. If a bin has >2000 counts, and if more than 50% of those come from <1% of pixels, then it is considered to be noise-dominated and hence unusable.
| Quadrant | # 1 sec bins | Bins with >0 counts | Bins with >2000 counts | High rate bins dominated by noise | Noise dominated (total time) | Noise dominated (detector-on time) | Marked lightcurve |
|---|---|---|---|---|---|---|---|
| A | 8265 | 8061 | 376 | 376 | 4.55% | 4.66% | 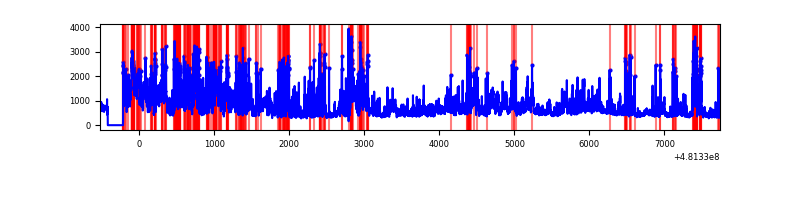 |
| B | 8265 | 8061 | 87 | 87 | 1.05% | 1.08% | 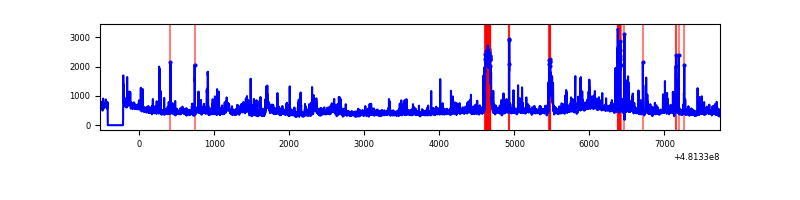 |
| C | 8265 | 8061 | 2966 | 2966 | 35.89% | 36.79% | 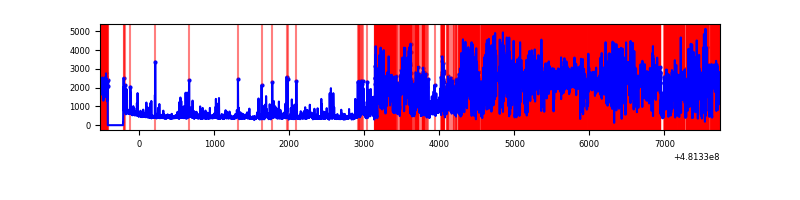 |
| D | 8265 | 8061 | 2485 | 2485 | 30.07% | 30.83% | 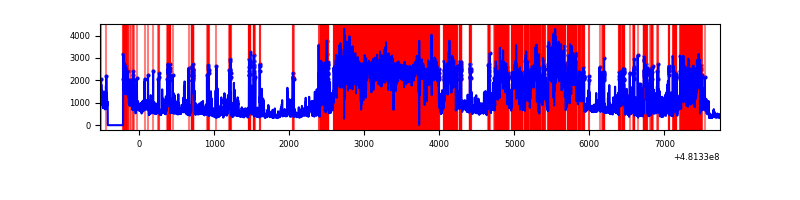 |
Top three noisy pixels from each quadrant. If the there are fewer than three noisy pixels in the level2.evt file, extra rows are filled as -1
| Pixel properties | Quadrant properties | ||||||
|---|---|---|---|---|---|---|---|
| Quadrant | DetID | PixID | Counts | Sigma | Mean | Median | Sigma |
| A | 12 | 3 | 1406714 | 6671.43 | 848 | 826 | 210.7 |
| A | 7 | 64 | 1067658 | 5062.49 | 848 | 826 | 210.7 |
| A | 4 | 175 | 189319 | 894.46 | 848 | 826 | 210.7 |
| B | 15 | 52 | 217777 | 1171.52 | 866 | 836 | 185.2 |
| B | 5 | 185 | 161039 | 865.12 | 866 | 836 | 185.2 |
| B | 0 | 171 | 103398 | 553.85 | 866 | 836 | 185.2 |
| C | 4 | 12 | 5956429 | 33471.61 | 639 | 632 | 177.9 |
| C | 15 | 179 | 2484517 | 13959.45 | 639 | 632 | 177.9 |
| C | 13 | 3 | 234578 | 1314.78 | 639 | 632 | 177.9 |
| D | 6 | 42 | 4723110 | 23712.15 | 705 | 678 | 199.2 |
| D | 8 | 176 | 1940244 | 9738.9 | 705 | 678 | 199.2 |
| D | 11 | 176 | 302043 | 1513.21 | 705 | 678 | 199.2 |
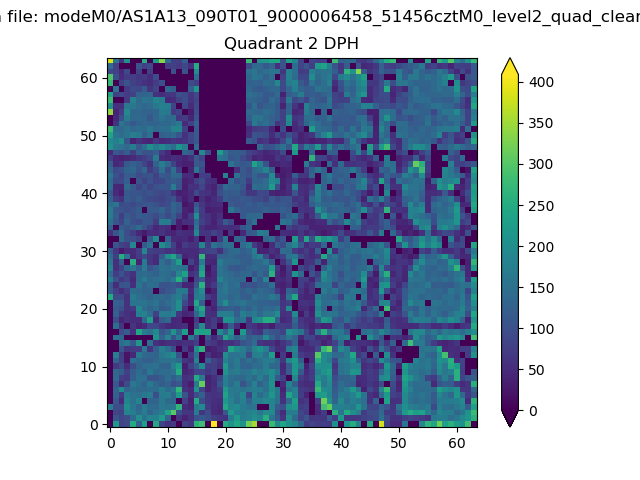
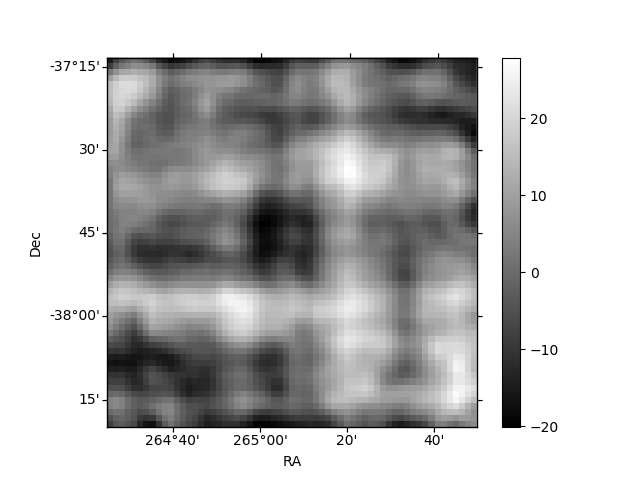
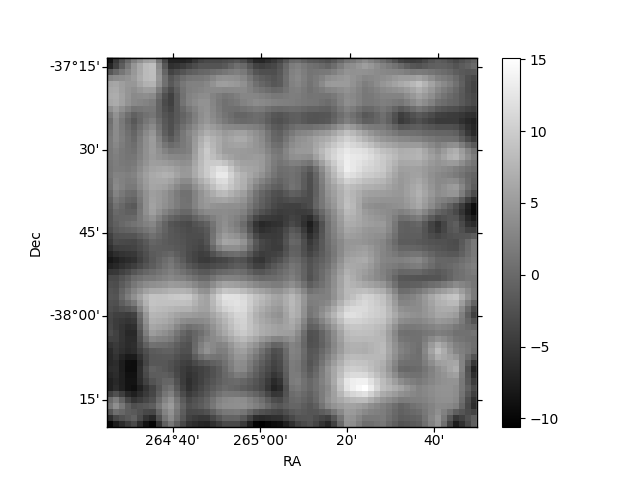
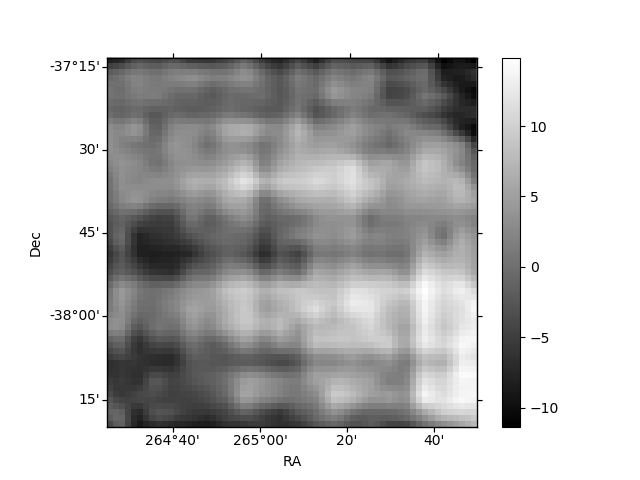
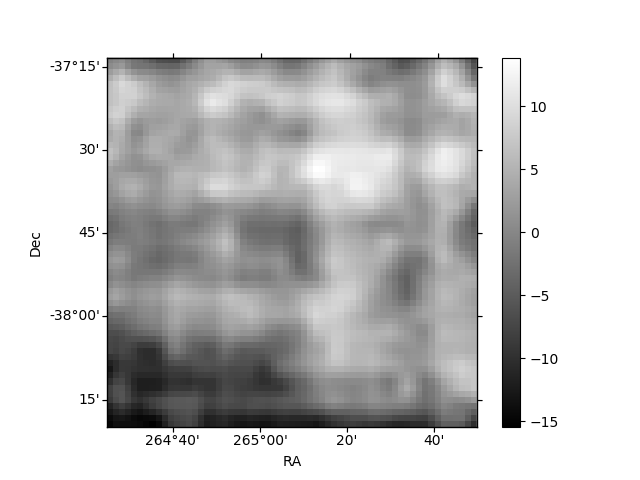
Histogram calculated using DETX and DETY for each event in the final _common_clean file
| Quadrant A | 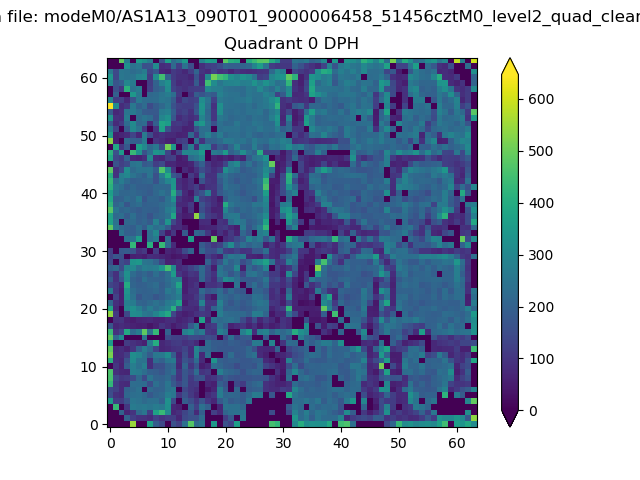 |
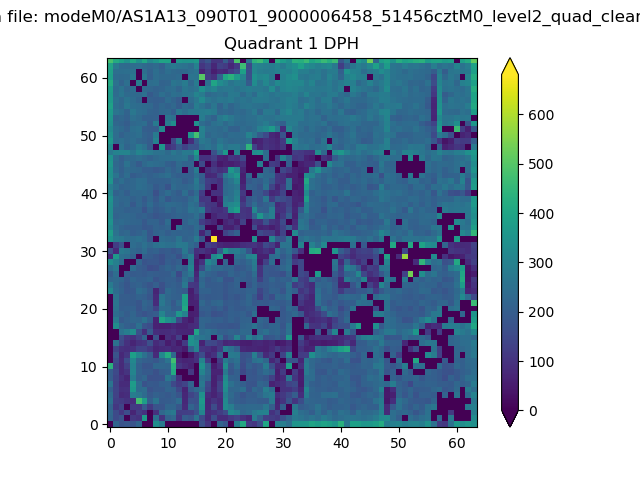 |
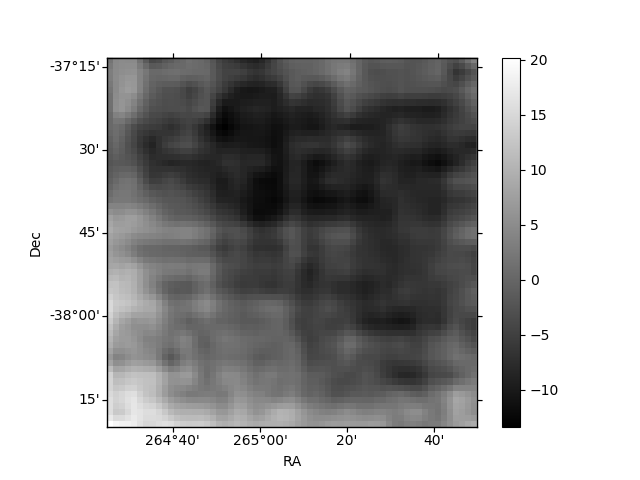
Quadrant B |
|---|---|---|---|
| Quadrant D | 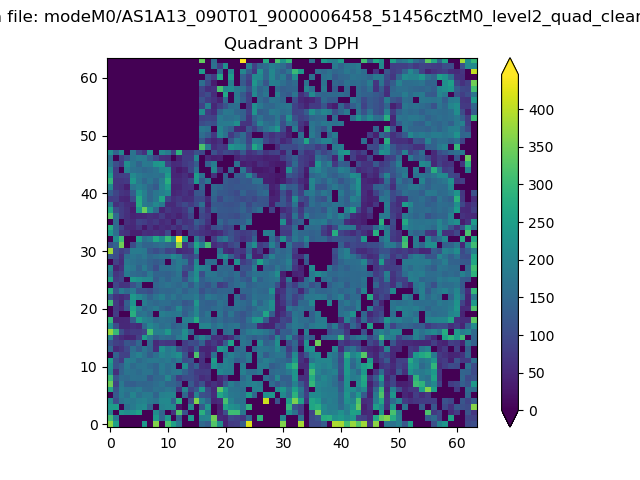 |
 |
Quadrant C |
| Plot type | Count rate plots | Images |
|---|---|---|
| Comparison with Poisson distribution Blue bars denote a histogram of data divided into 1 sec bins. Red curve is a Poisson curve with rate = median count rate of data. |
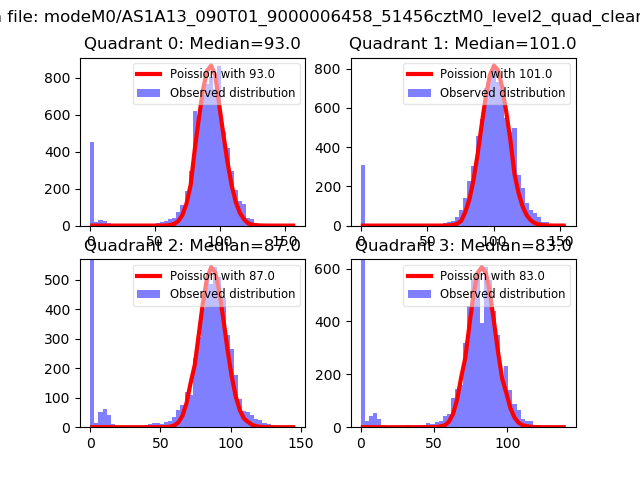 |
 |
| Quadrant-wise count rates Data is divided into 100 sec bins |
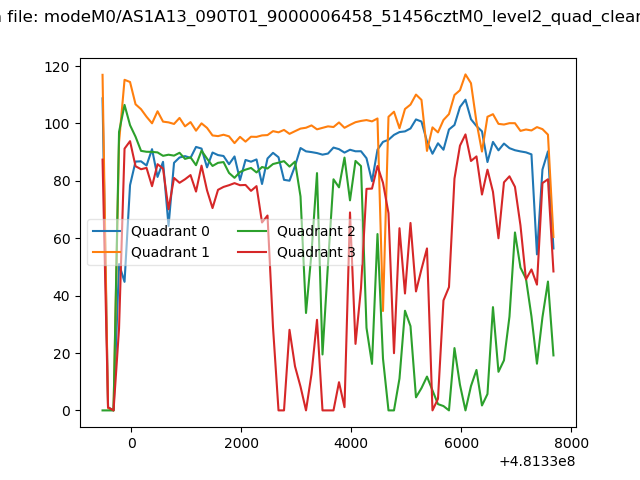 |
|
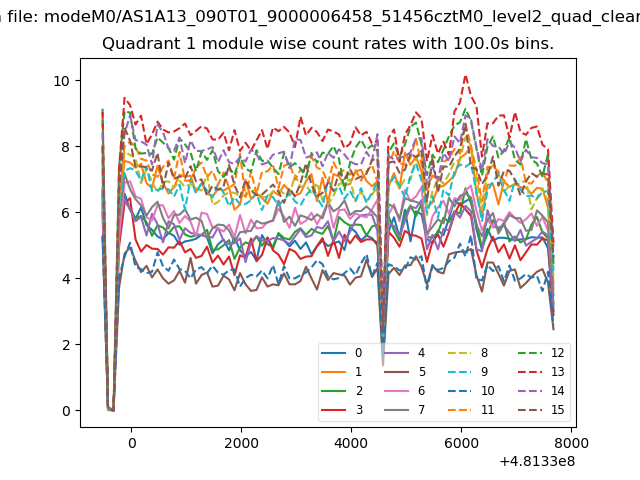
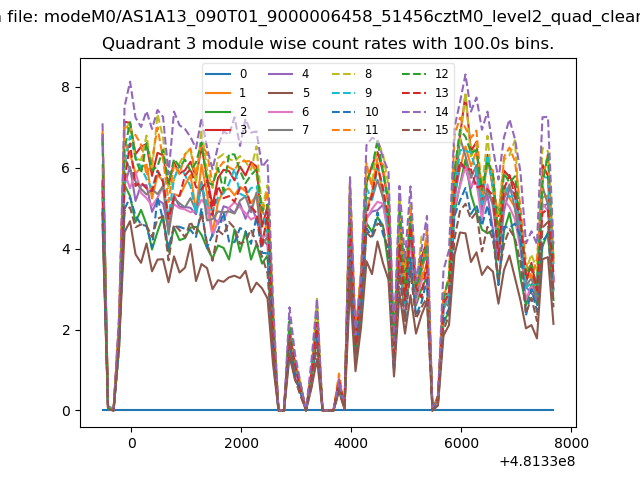
| Module-wise count rates for Quadrant A Data is divided into 100 sec bins |
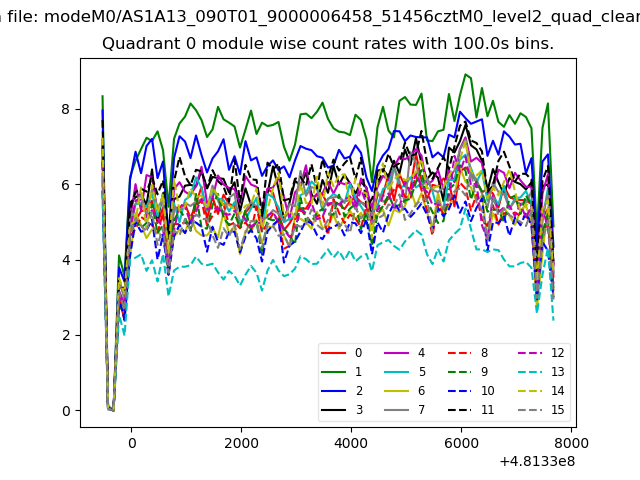 |
 |
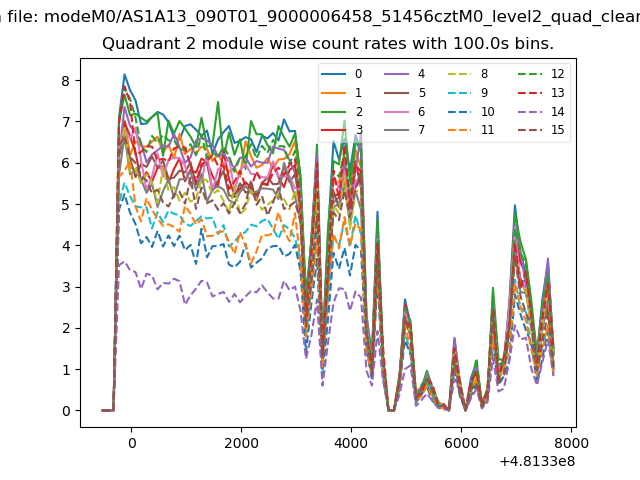
| Module-wise count rates for Quadrant B Data is divided into 100 sec bins |
 |
 |
| Module-wise count rates for Quadrant C Data is divided into 100 sec bins |
 |
 |
| Module-wise count rates for Quadrant D Data is divided into 100 sec bins |
 |
 |
| Parameter | Plot |
|---|---|
| CZT HV Monitor | 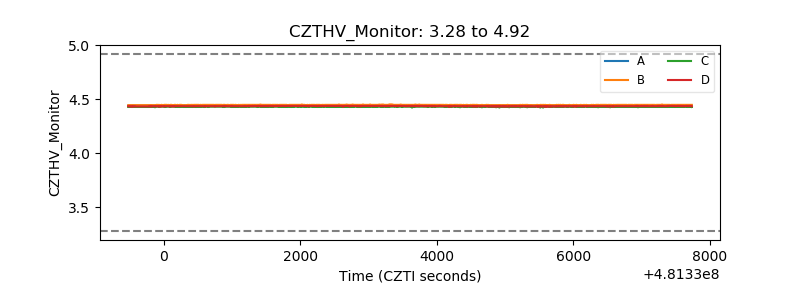 |
| D_VDD | 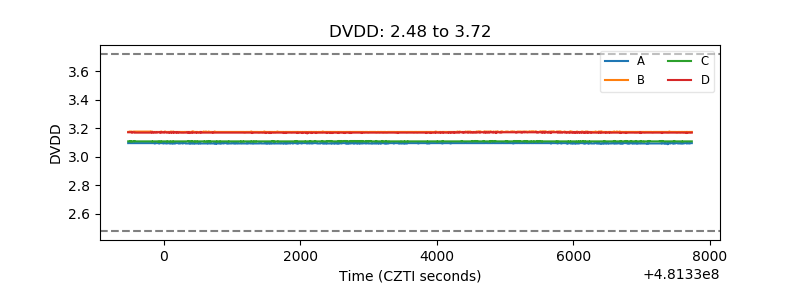 |
| Temperature 1 | 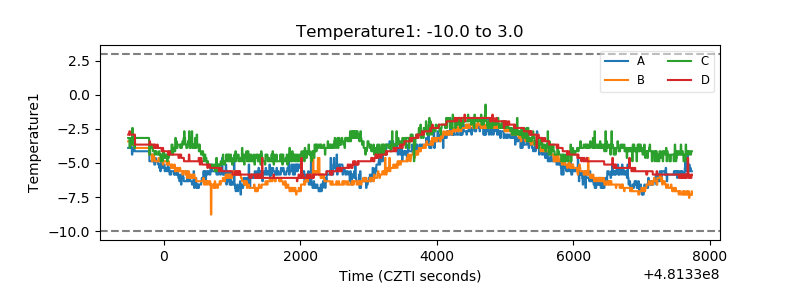 |
| Veto HV Monitor | 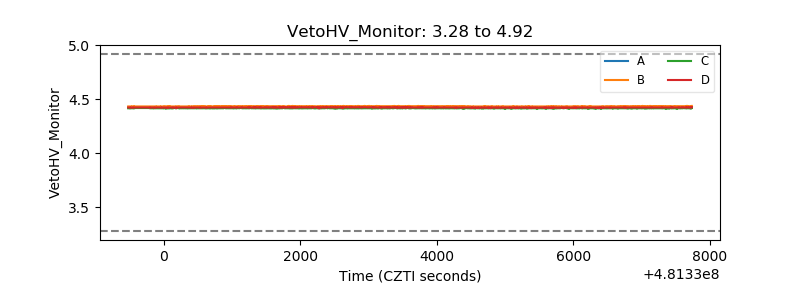 |
| Veto LLD | 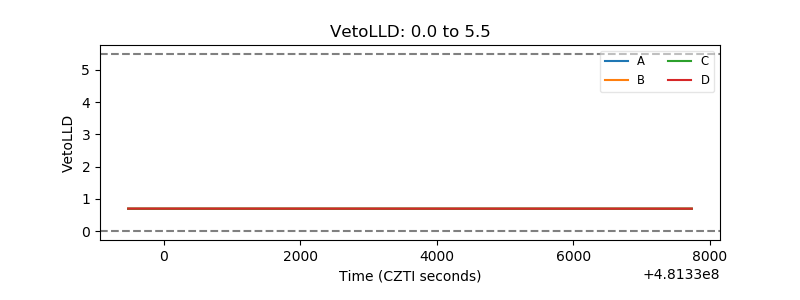 |
| Alpha Counter | 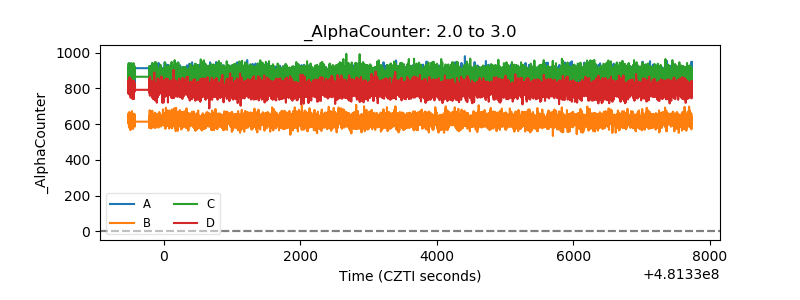 |
| _CPM_Rate | 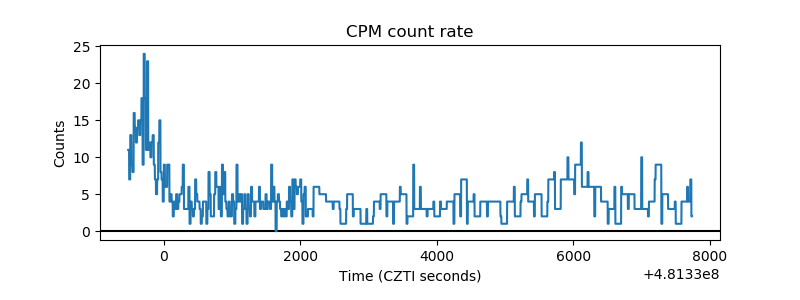 |
| CZT Counter | 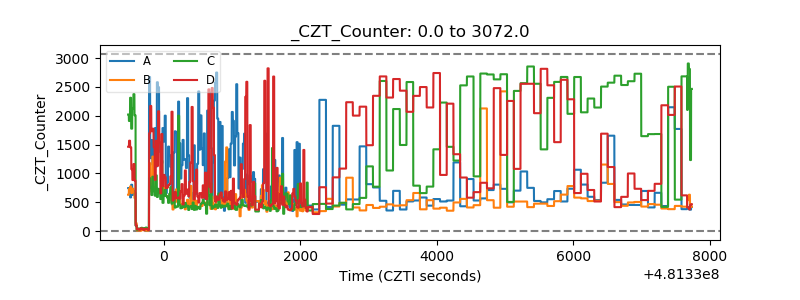 |
| +2.5 Volts monitor | 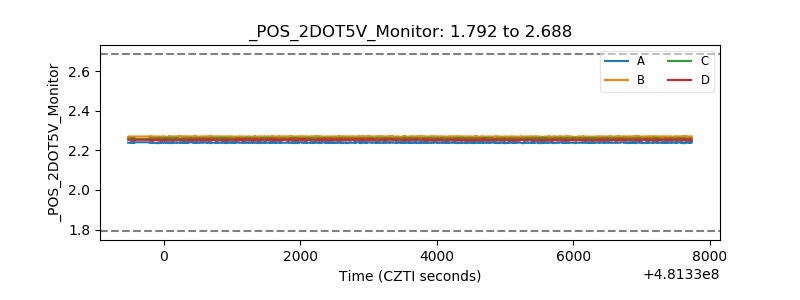 |
| +5 Volts monitor | 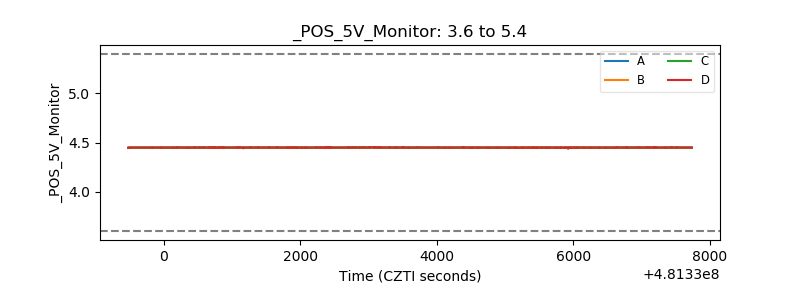 |
| _ROLL_ROT | 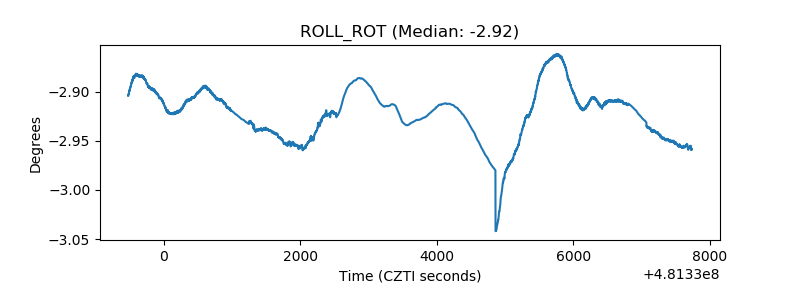 |
| _Roll_DEC | 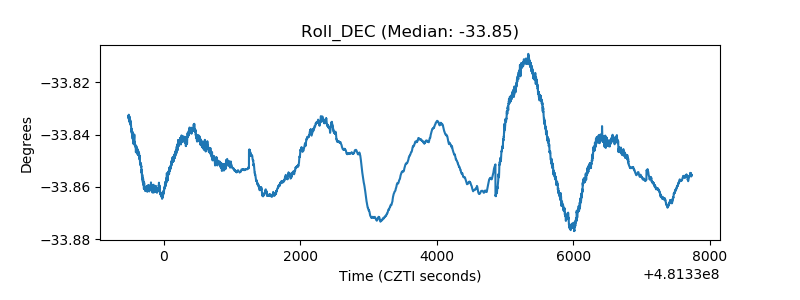 |
| _Roll_RA | 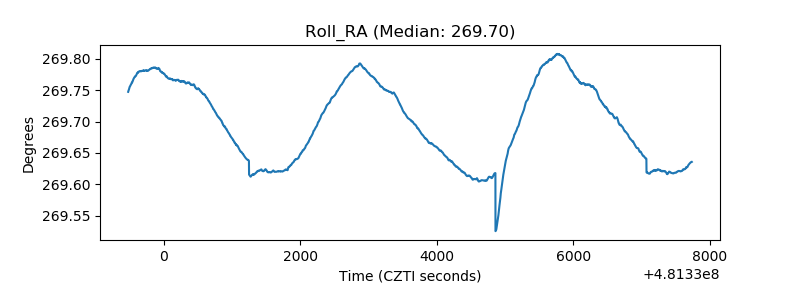 |
| Veto Counter | 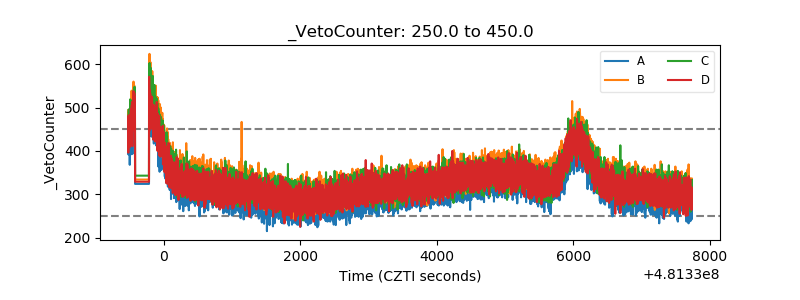 |