| Param | Original file | Final file |
|---|---|---|
| Filename | modeM0/AS1A13_090T01_9000006458_51461cztM0_level2.fits | modeM0/AS1A13_090T01_9000006458_51461cztM0_level2_quad_clean.evt |
| Size (bytes) | 2,779,623,360 | 215,861,760 |
| Size | 2.6 GB | 205.9 MB |
| Events in quadrant A | 21,743,486 | 1,522,469 |
| Events in quadrant B | 14,659,557 | 1,856,308 |
| Events in quadrant C | 42,835,146 | 425,536 |
| Events in quadrant D | 22,110,686 | 1,349,289 |
| Mode M0 | |||
|---|---|---|---|
| Quadrant | BADHDUFLAG | Total packets | Discarded packets |
| A | 0 | 78578 | 2 |
| B | 0 | 57568 | 2 |
| C | 0 | 140935 | 2 |
| D | 0 | 79756 | 2 |
| Mode M9 | |||
|---|---|---|---|
| Quadrant | BADHDUFLAG | Total packets | Discarded packets |
| A | 0 | 3 | 0 |
| B | 0 | 3 | 0 |
| C | 0 | 3 | 0 |
| D | 0 | 3 | 0 |
| Mode SS | |||
|---|---|---|---|
| Quadrant | BADHDUFLAG | Total packets | Discarded packets |
| A | 0 | 404 | 0 |
| B | 0 | 404 | 0 |
| C | 0 | 404 | 0 |
| D | 0 | 404 | 0 |
| Quadrant | Total seconds | Saturated seconds | Saturation percentage |
|---|---|---|---|
| A | 20042 | 3946 | 19.688654% |
| B | 20042 | 1612 | 8.043109% |
| C | 20042 | 15871 | 79.188704% |
| D | 20042 | 3769 | 18.805508% |
Noise dominated data is calculated using 1-second bins in cleaned event files. If a bin has >2000 counts, and if more than 50% of those come from <1% of pixels, then it is considered to be noise-dominated and hence unusable.
| Quadrant | # 1 sec bins | Bins with >0 counts | Bins with >2000 counts | High rate bins dominated by noise | Noise dominated (total time) | Noise dominated (detector-on time) | Marked lightcurve |
|---|---|---|---|---|---|---|---|
| A | 20417 | 20045 | 2896 | 2896 | 14.18% | 14.45% | 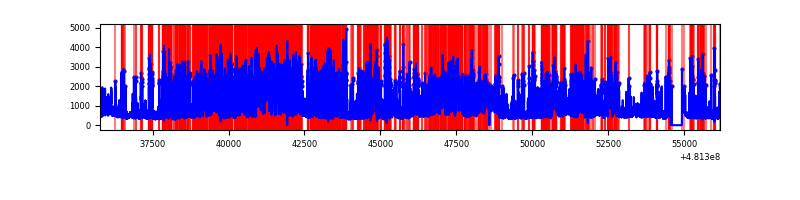 |
| B | 20417 | 20045 | 1175 | 1175 | 5.76% | 5.86% | 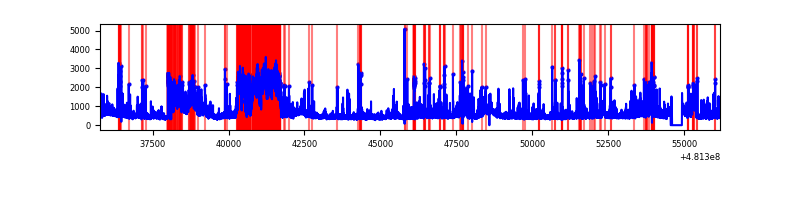 |
| C | 20417 | 20042 | 12959 | 12959 | 63.47% | 64.66% | 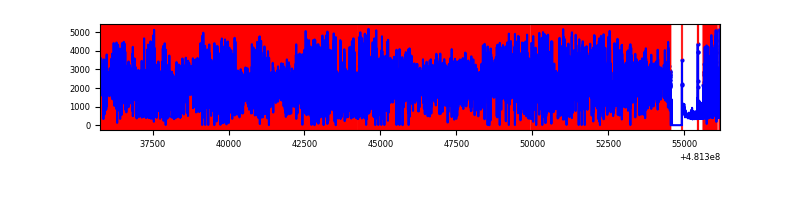 |
| D | 20417 | 20045 | 3541 | 3541 | 17.34% | 17.67% | 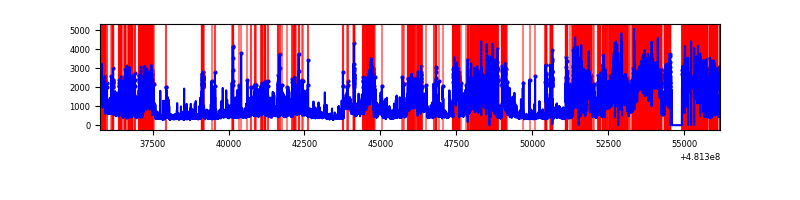 |
Top three noisy pixels from each quadrant. If the there are fewer than three noisy pixels in the level2.evt file, extra rows are filled as -1
| Pixel properties | Quadrant properties | ||||||
|---|---|---|---|---|---|---|---|
| Quadrant | DetID | PixID | Counts | Sigma | Mean | Median | Sigma |
| A | 7 | 64 | 6781441 | 13897.96 | 1987 | 1931 | 487.8 |
| A | 12 | 250 | 4715272 | 9662.32 | 1987 | 1931 | 487.8 |
| A | 5 | 240 | 457197 | 933.29 | 1987 | 1931 | 487.8 |
| B | 5 | 172 | 3601997 | 8046.2 | 2083 | 2004 | 447.4 |
| B | 15 | 52 | 605736 | 1349.38 | 2083 | 2004 | 447.4 |
| B | 4 | 206 | 377781 | 839.88 | 2083 | 2004 | 447.4 |
| C | 4 | 12 | 22503812 | 81279.47 | 1008 | 999 | 276.9 |
| C | 15 | 179 | 14735936 | 53222.14 | 1008 | 999 | 276.9 |
| C | 13 | 3 | 351773 | 1266.98 | 1008 | 999 | 276.9 |
| D | 6 | 42 | 7395339 | 14045.14 | 1891 | 1827 | 526.4 |
| D | 10 | 199 | 1437530 | 2727.34 | 1891 | 1827 | 526.4 |
| D | 8 | 176 | 1181242 | 2240.48 | 1891 | 1827 | 526.4 |
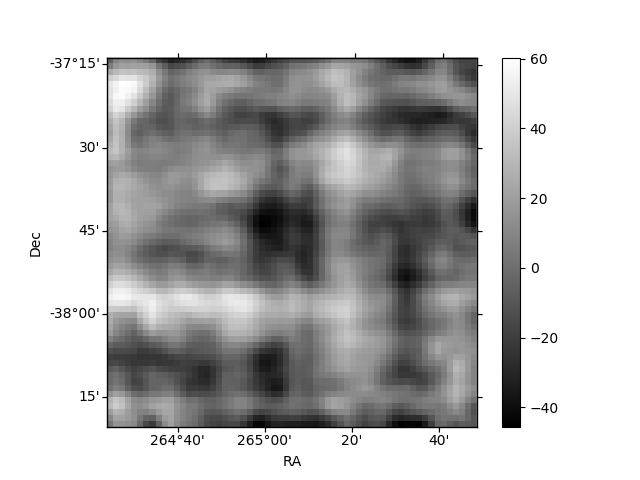
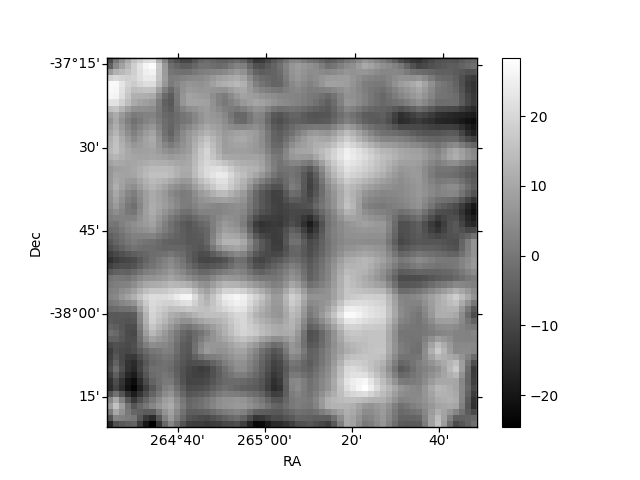
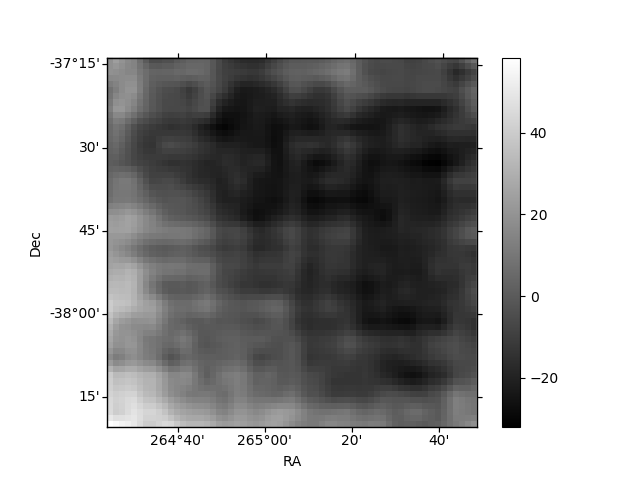
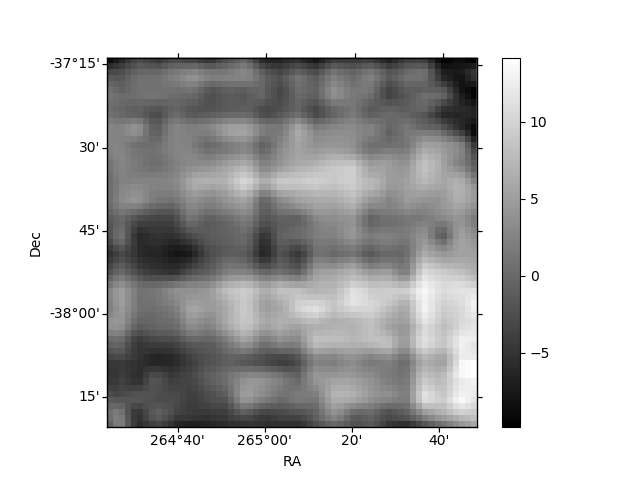
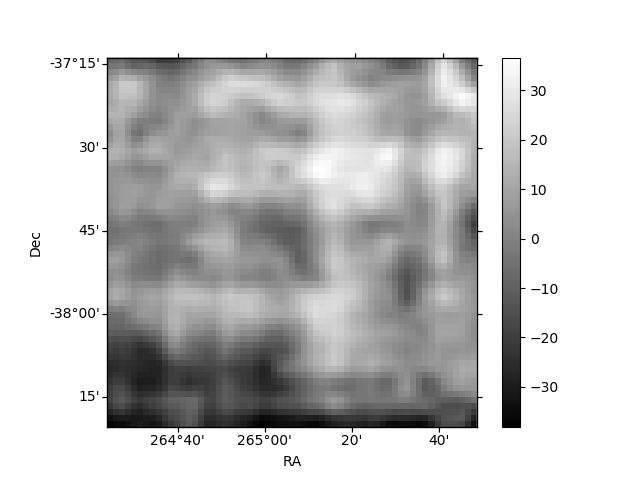
Histogram calculated using DETX and DETY for each event in the final _common_clean file
| Quadrant A | 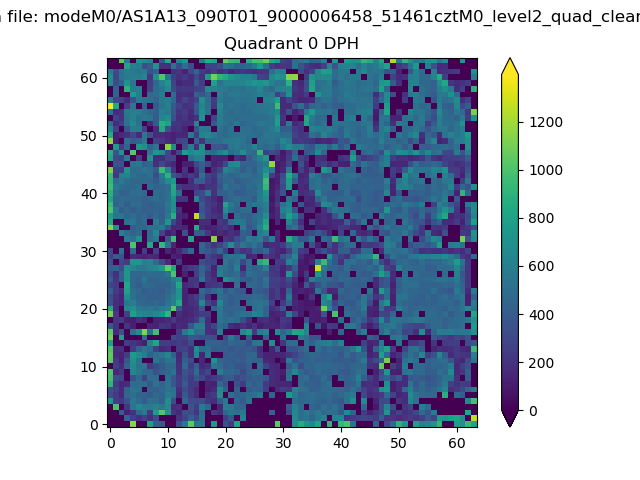 |
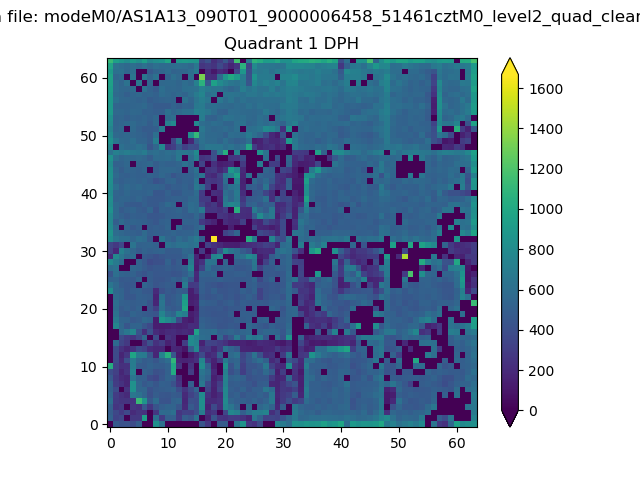 |
Quadrant B |
|---|---|---|---|
| Quadrant D | 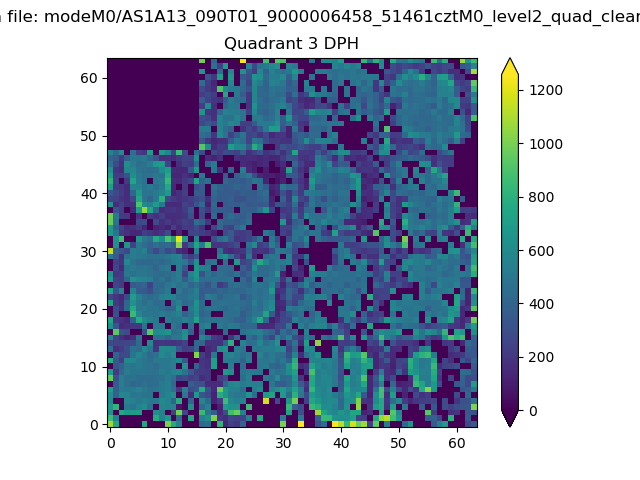 |
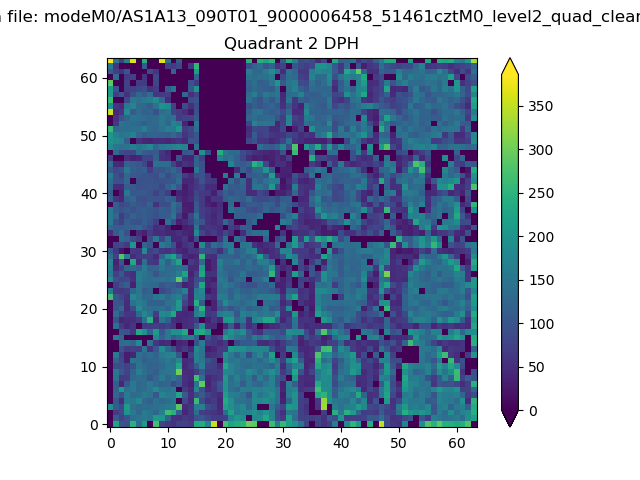 |
Quadrant C |
| Plot type | Count rate plots | Images |
|---|---|---|
| Comparison with Poisson distribution Blue bars denote a histogram of data divided into 1 sec bins. Red curve is a Poisson curve with rate = median count rate of data. |
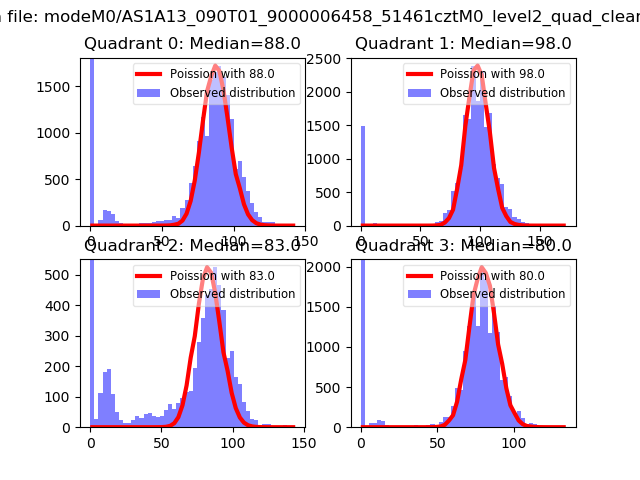 |
 |
| Quadrant-wise count rates Data is divided into 100 sec bins |
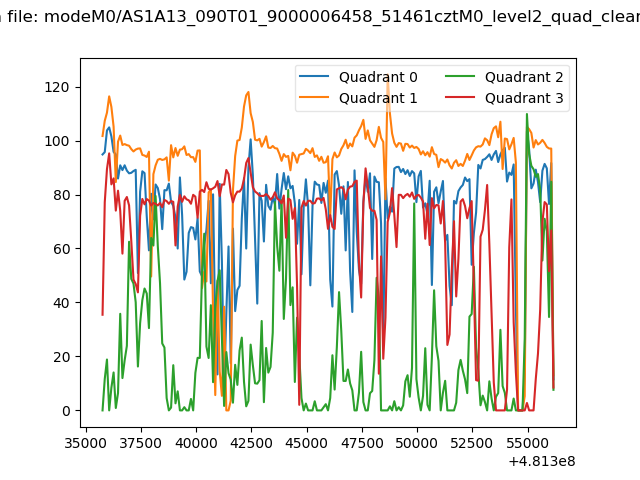 |
|
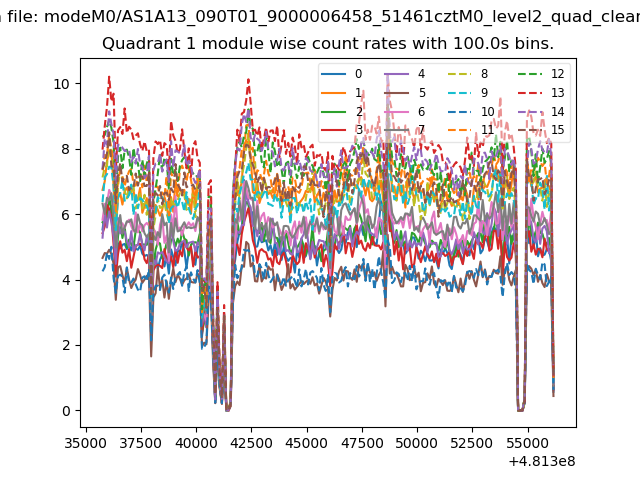
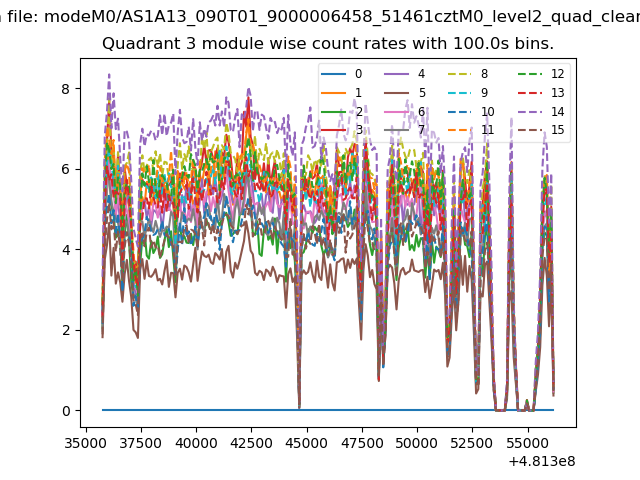
| Module-wise count rates for Quadrant A Data is divided into 100 sec bins |
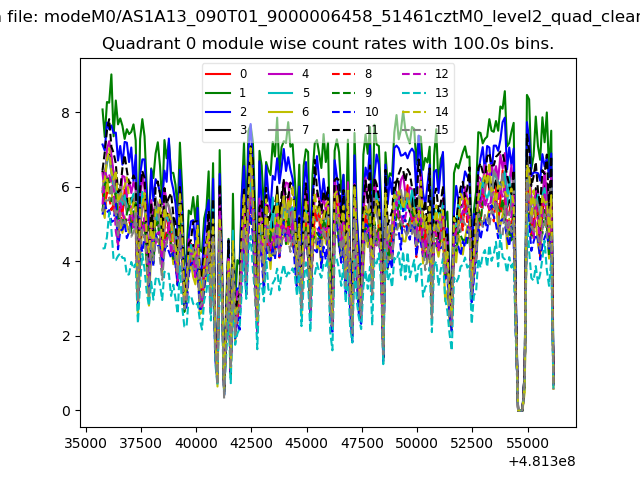 |
 |
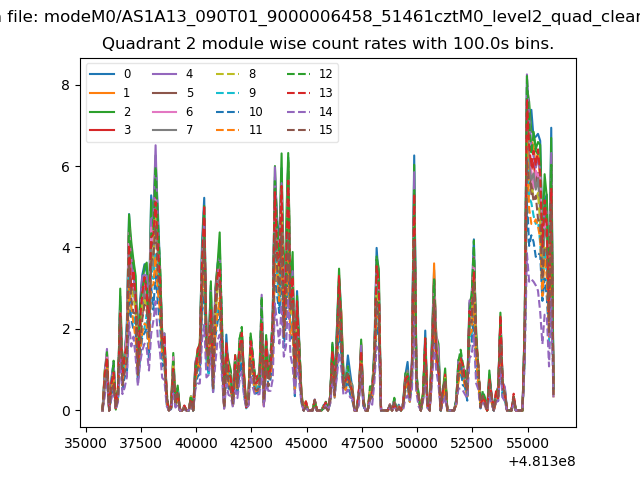
| Module-wise count rates for Quadrant B Data is divided into 100 sec bins |
 |
 |
| Module-wise count rates for Quadrant C Data is divided into 100 sec bins |
 |
 |
| Module-wise count rates for Quadrant D Data is divided into 100 sec bins |
 |
 |
| Parameter | Plot |
|---|---|
| CZT HV Monitor | 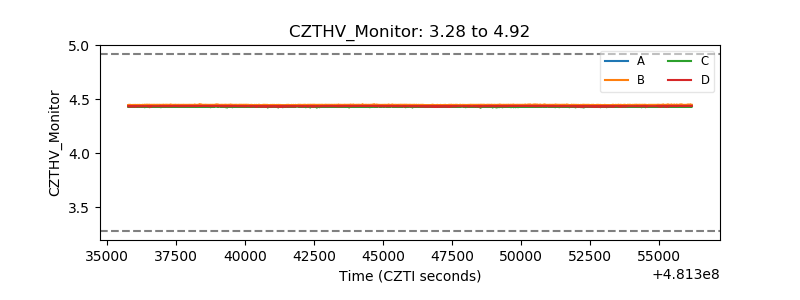 |
| D_VDD | 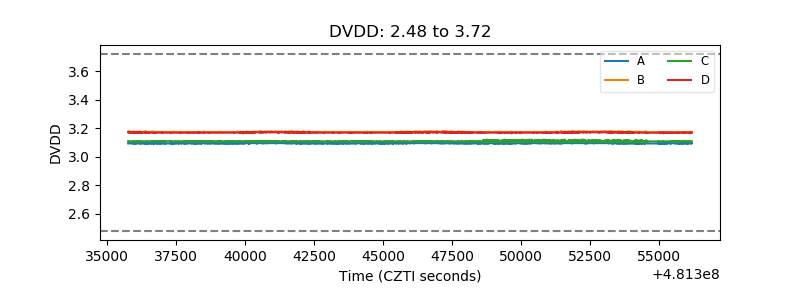 |
| Temperature 1 | 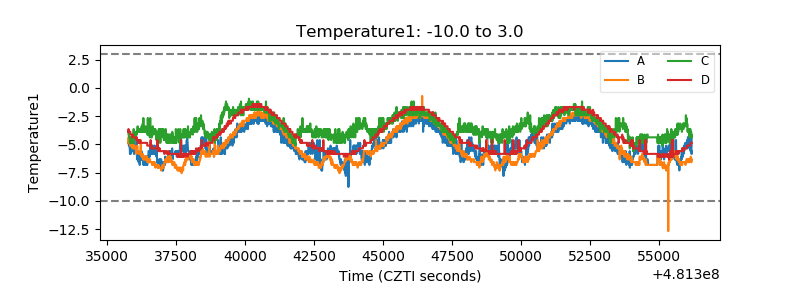 |
| Veto HV Monitor | 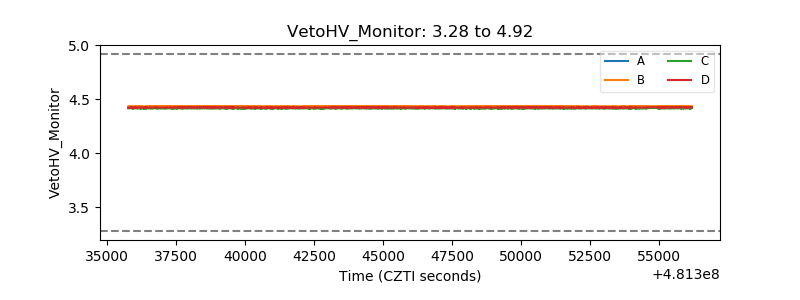 |
| Veto LLD | 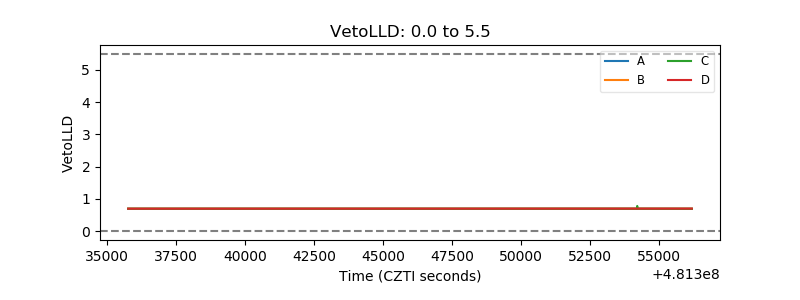 |
| Alpha Counter | 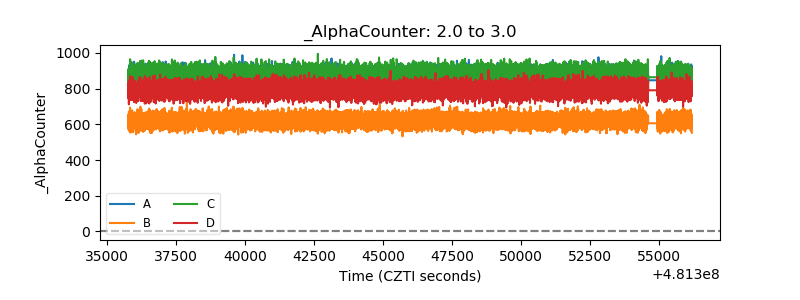 |
| _CPM_Rate | 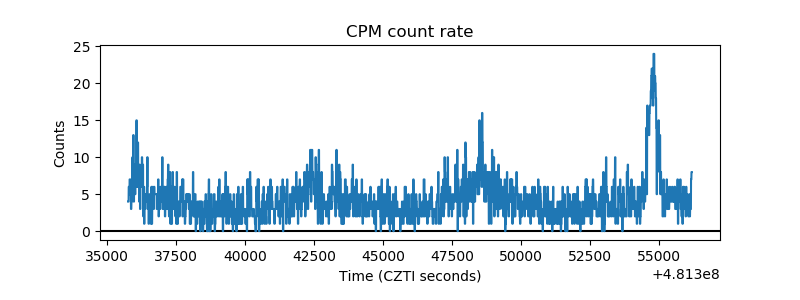 |
| CZT Counter | 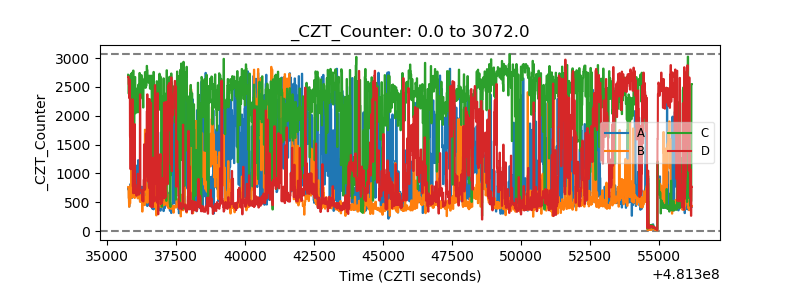 |
| +2.5 Volts monitor | 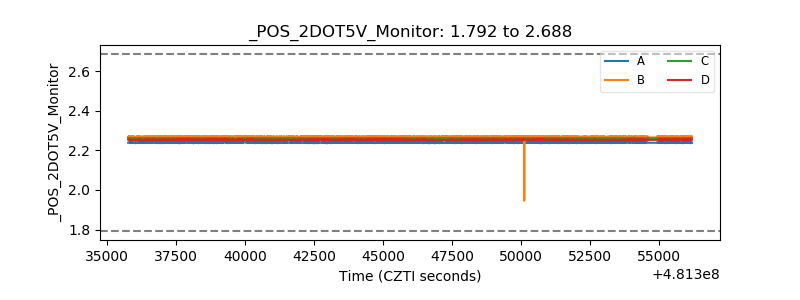 |
| +5 Volts monitor | 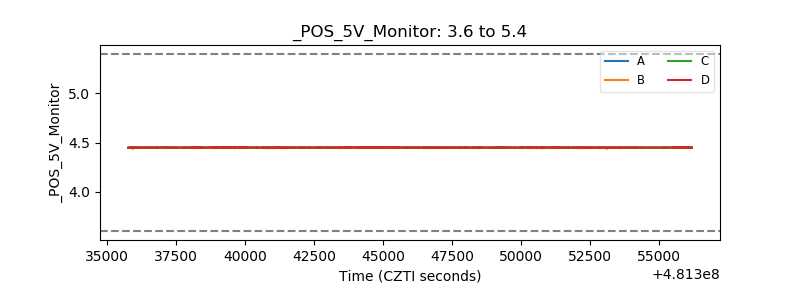 |
| _ROLL_ROT | 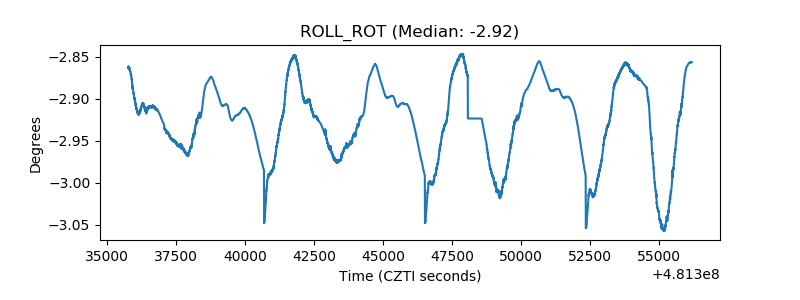 |
| _Roll_DEC | 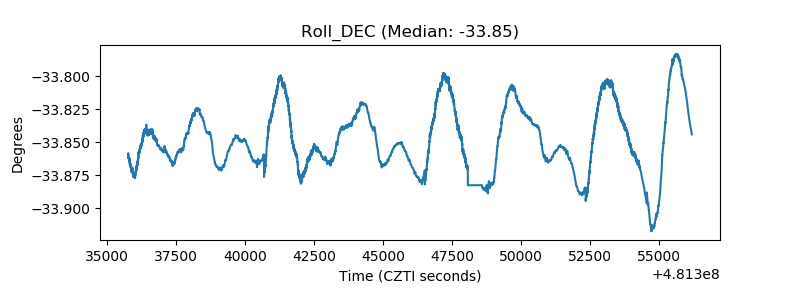 |
| _Roll_RA | 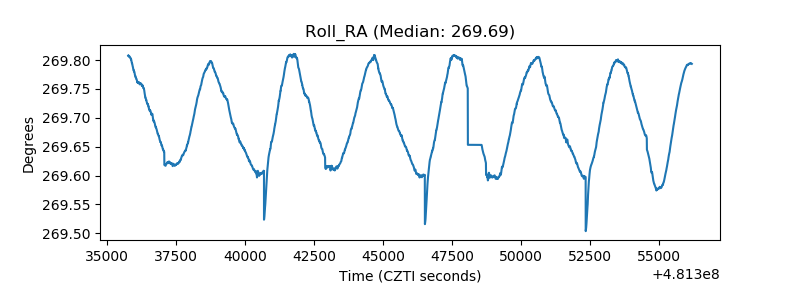 |
| Veto Counter | 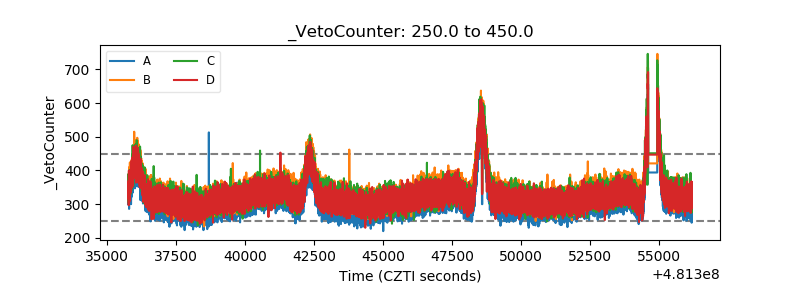 |