| Param | Original file | Final file |
|---|---|---|
| Filename | modeM0/AS1A13_090T01_9000006458_51463cztM0_level2.fits | modeM0/AS1A13_090T01_9000006458_51463cztM0_level2_quad_clean.evt |
| Size (bytes) | 1,630,632,960 | 222,491,520 |
| Size | 1.5 GB | 212.2 MB |
| Events in quadrant A | 17,784,678 | 1,354,243 |
| Events in quadrant B | 11,215,575 | 1,639,610 |
| Events in quadrant C | 10,243,841 | 1,446,360 |
| Events in quadrant D | 19,781,495 | 1,104,366 |
| Mode M0 | |||
|---|---|---|---|
| Quadrant | BADHDUFLAG | Total packets | Discarded packets |
| A | 0 | 64771 | 3 |
| B | 0 | 45392 | 3 |
| C | 0 | 43235 | 3 |
| D | 0 | 70645 | 4 |
| Mode M9 | |||
|---|---|---|---|
| Quadrant | BADHDUFLAG | Total packets | Discarded packets |
| A | 0 | 23 | 0 |
| B | 0 | 23 | 0 |
| C | 0 | 23 | 0 |
| D | 0 | 23 | 0 |
| Mode SS | |||
|---|---|---|---|
| Quadrant | BADHDUFLAG | Total packets | Discarded packets |
| A | 0 | 350 | 0 |
| B | 0 | 350 | 0 |
| C | 0 | 350 | 0 |
| D | 0 | 350 | 0 |
| Quadrant | Total seconds | Saturated seconds | Saturation percentage |
|---|---|---|---|
| A | 17307 | 2949 | 17.039348% |
| B | 17307 | 897 | 5.182874% |
| C | 17215 | 952 | 5.530061% |
| D | 17306 | 3827 | 22.113718% |
Noise dominated data is calculated using 1-second bins in cleaned event files. If a bin has >2000 counts, and if more than 50% of those come from <1% of pixels, then it is considered to be noise-dominated and hence unusable.
| Quadrant | # 1 sec bins | Bins with >0 counts | Bins with >2000 counts | High rate bins dominated by noise | Noise dominated (total time) | Noise dominated (detector-on time) | Marked lightcurve |
|---|---|---|---|---|---|---|---|
| A | 19542 | 17310 | 2089 | 2089 | 10.69% | 12.07% | 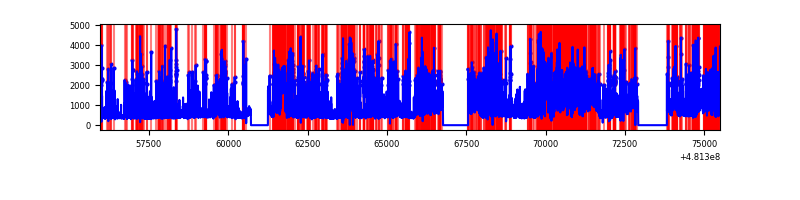 |
| B | 19542 | 17310 | 428 | 428 | 2.19% | 2.47% | 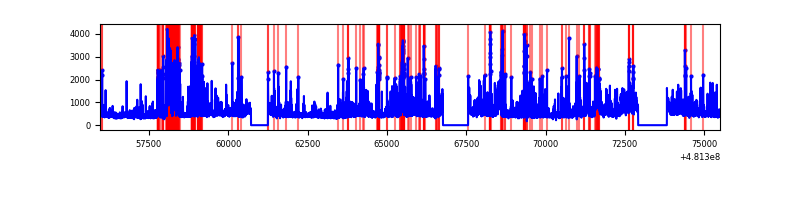 |
| C | 19542 | 17219 | 652 | 652 | 3.34% | 3.79% | 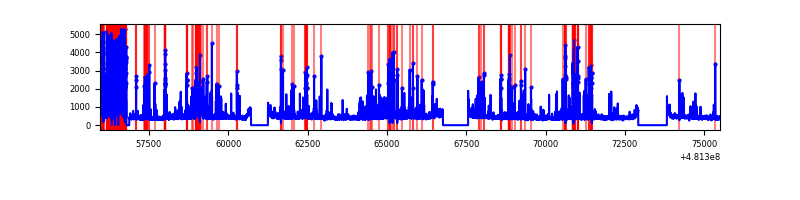 |
| D | 19541 | 17308 | 3612 | 3612 | 18.48% | 20.87% |  |
Top three noisy pixels from each quadrant. If the there are fewer than three noisy pixels in the level2.evt file, extra rows are filled as -1
| Pixel properties | Quadrant properties | ||||||
|---|---|---|---|---|---|---|---|
| Quadrant | DetID | PixID | Counts | Sigma | Mean | Median | Sigma |
| A | 7 | 64 | 4152827 | 9744.1 | 1740 | 1696 | 426.0 |
| A | 12 | 250 | 2294369 | 5381.68 | 1740 | 1696 | 426.0 |
| A | 12 | 3 | 1182160 | 2770.95 | 1740 | 1696 | 426.0 |
| B | 0 | 171 | 806595 | 2099.85 | 1804 | 1744 | 383.3 |
| B | 4 | 206 | 750206 | 1952.73 | 1804 | 1744 | 383.3 |
| B | 8 | 234 | 590731 | 1536.66 | 1804 | 1744 | 383.3 |
| C | 4 | 12 | 1518309 | 3183.53 | 1753 | 1733 | 476.4 |
| C | 13 | 3 | 683253 | 1430.62 | 1753 | 1733 | 476.4 |
| C | 12 | 250 | 273932 | 571.39 | 1753 | 1733 | 476.4 |
| D | 6 | 42 | 7525666 | 17024.4 | 1587 | 1529 | 442.0 |
| D | 10 | 199 | 2440041 | 5517.47 | 1587 | 1529 | 442.0 |
| D | 0 | 129 | 1532465 | 3463.95 | 1587 | 1529 | 442.0 |
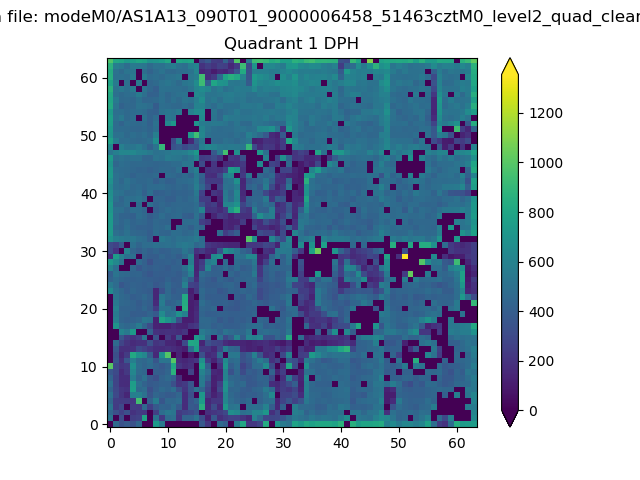
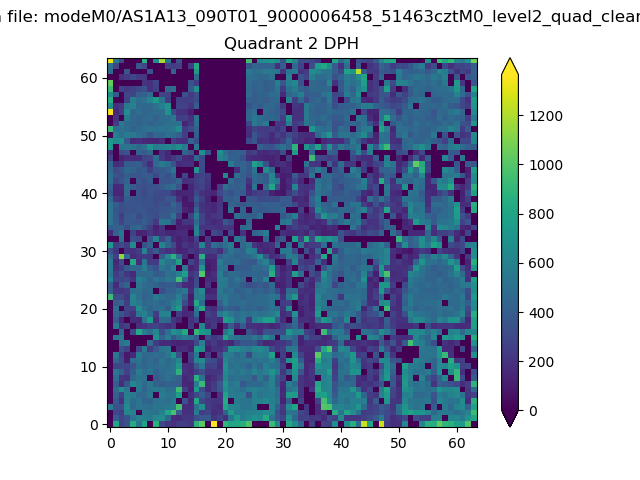
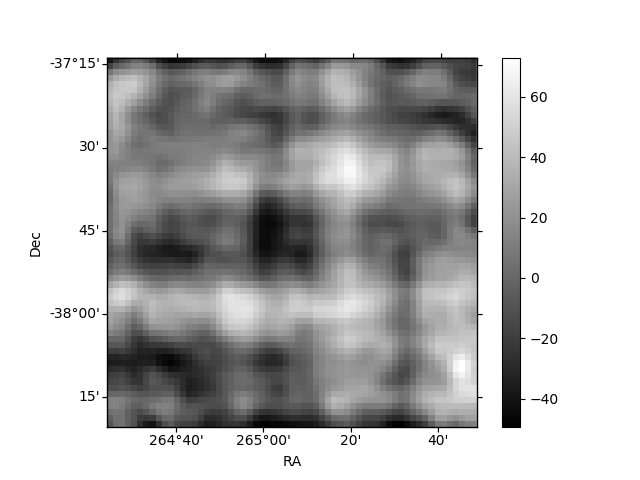
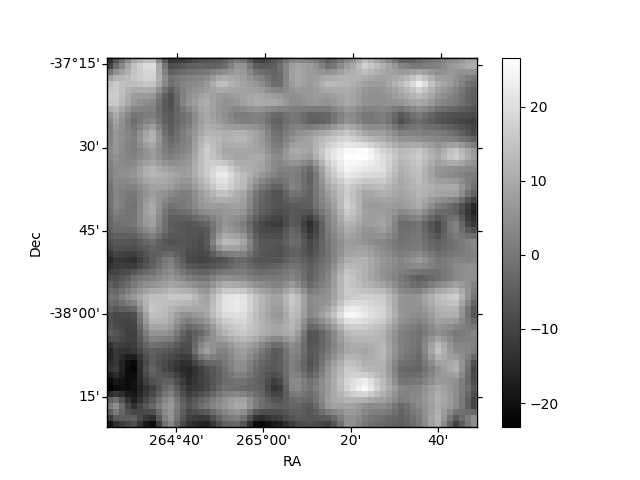
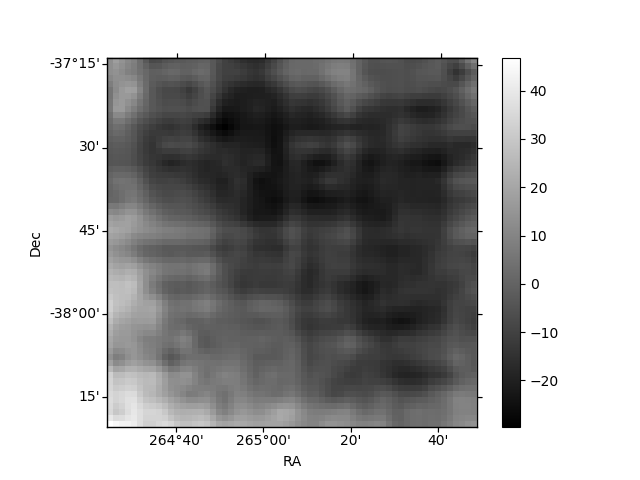
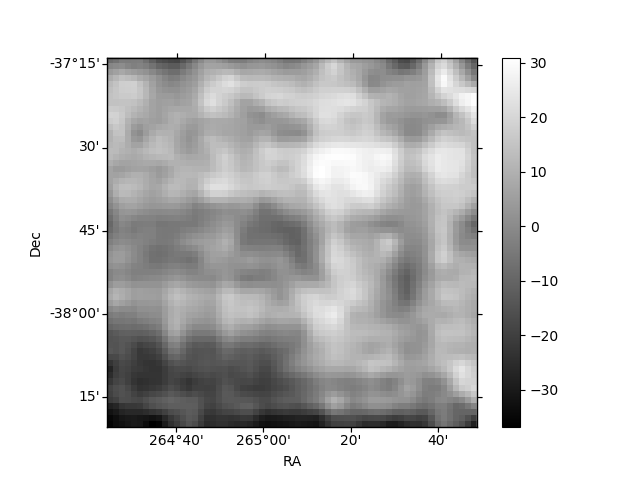
Histogram calculated using DETX and DETY for each event in the final _common_clean file
| Quadrant A | 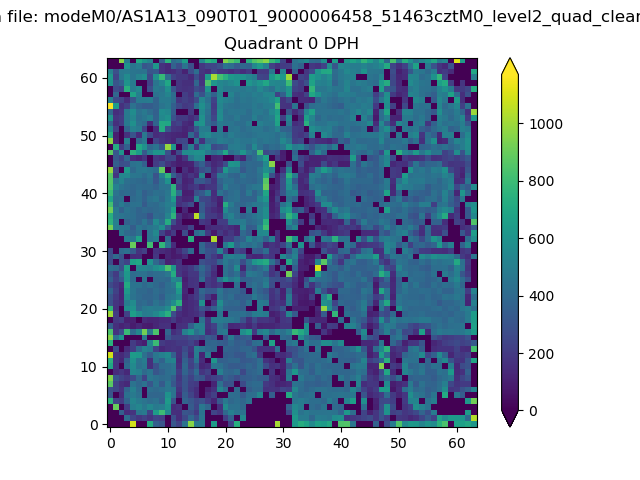 |
 |
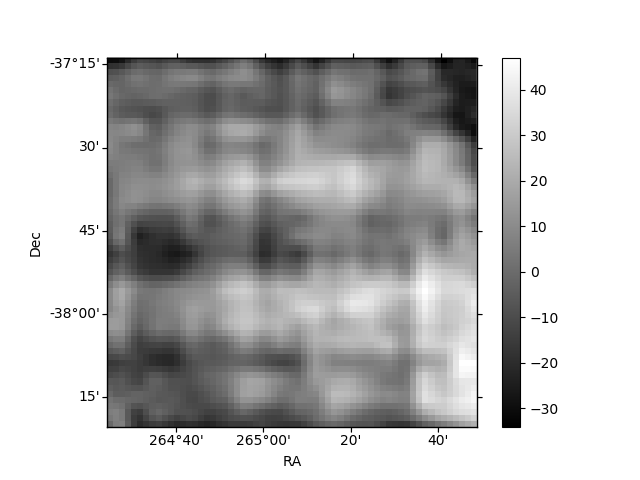
Quadrant B |
|---|---|---|---|
| Quadrant D | 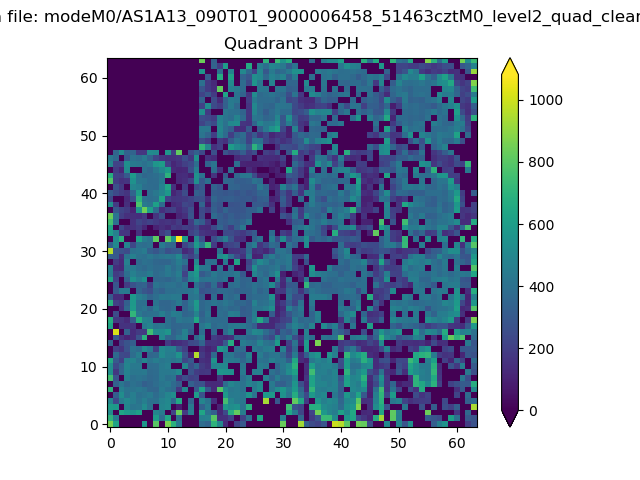 |
 |
Quadrant C |
| Plot type | Count rate plots | Images |
|---|---|---|
| Comparison with Poisson distribution Blue bars denote a histogram of data divided into 1 sec bins. Red curve is a Poisson curve with rate = median count rate of data. |
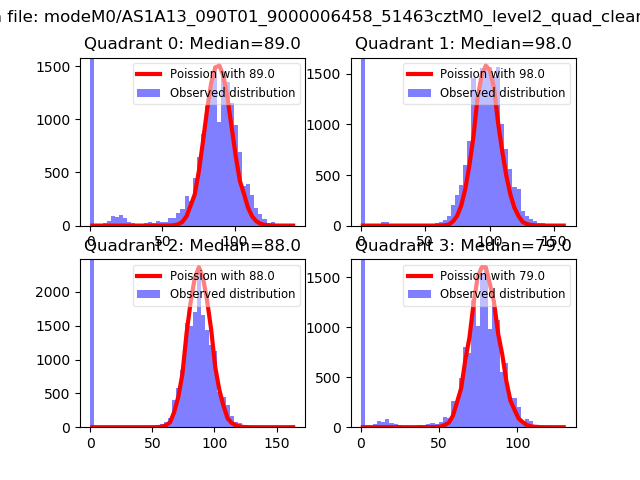 |
 |
| Quadrant-wise count rates Data is divided into 100 sec bins |
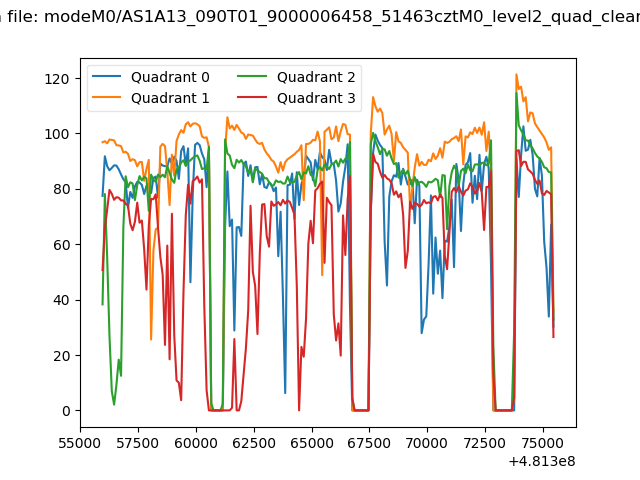 |
|
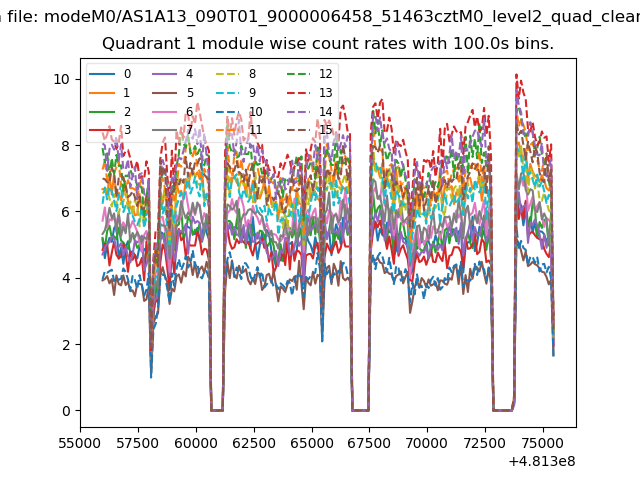
| Module-wise count rates for Quadrant A Data is divided into 100 sec bins |
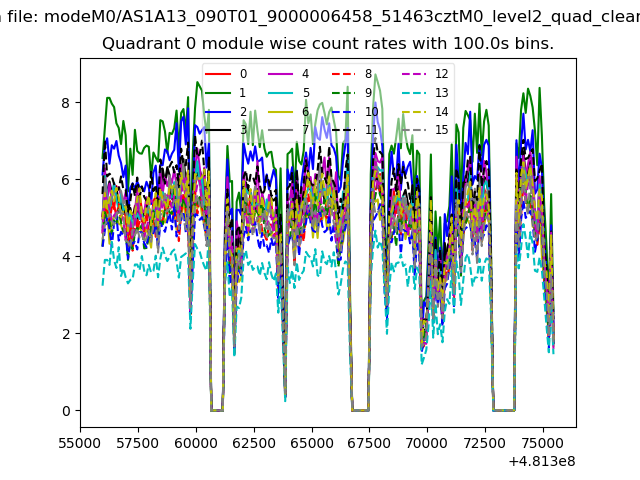 |
 |
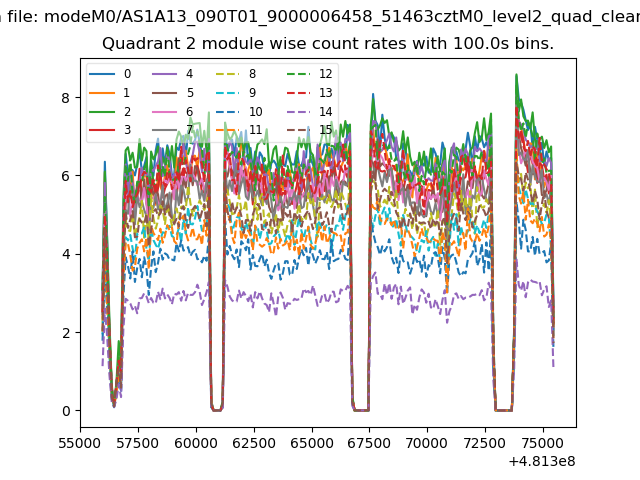
| Module-wise count rates for Quadrant B Data is divided into 100 sec bins |
 |
 |
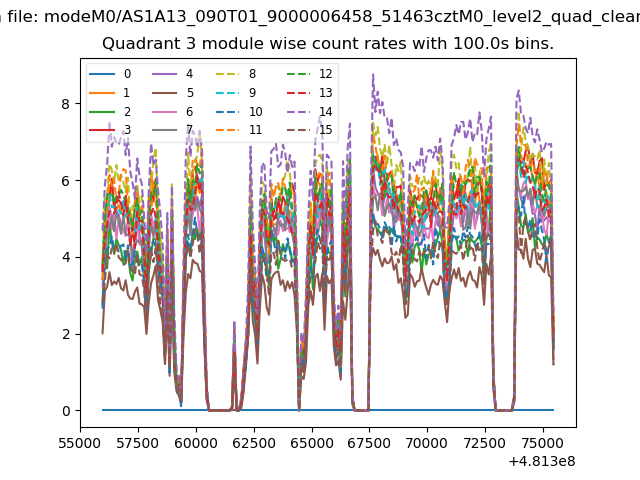
| Module-wise count rates for Quadrant C Data is divided into 100 sec bins |
 |
 |
| Module-wise count rates for Quadrant D Data is divided into 100 sec bins |
 |
 |
| Parameter | Plot |
|---|---|
| CZT HV Monitor | 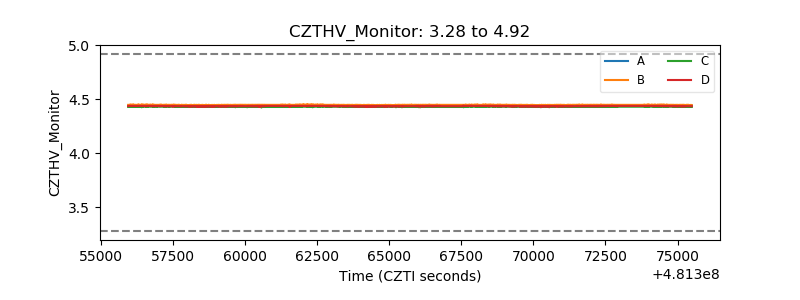 |
| D_VDD | 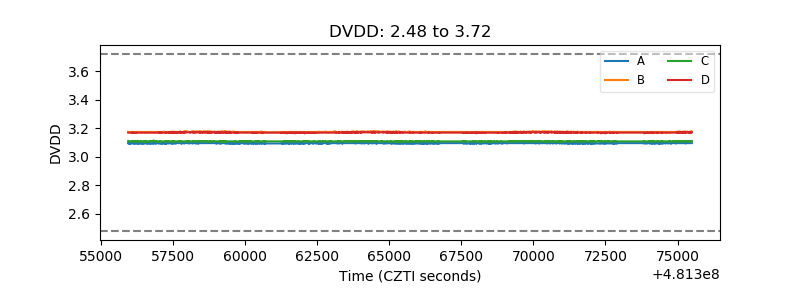 |
| Temperature 1 | 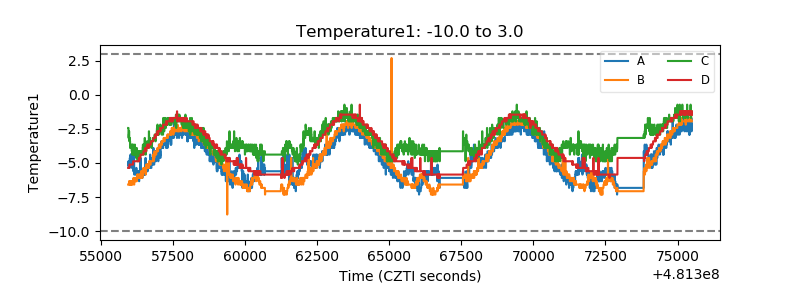 |
| Veto HV Monitor | 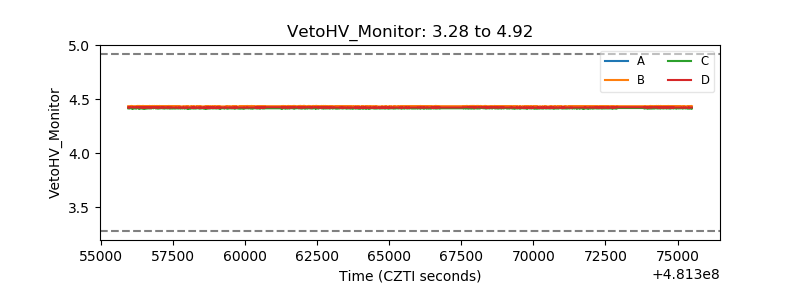 |
| Veto LLD |  |
| Alpha Counter | 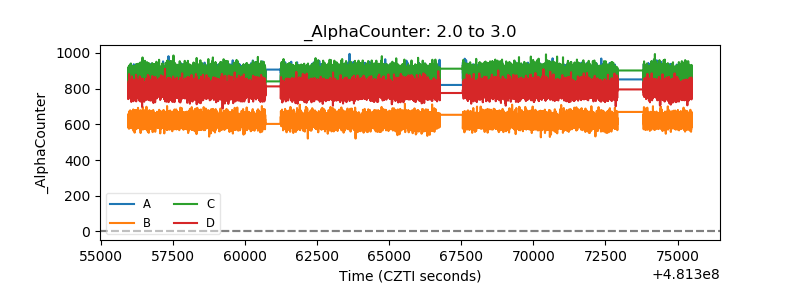 |
| _CPM_Rate | 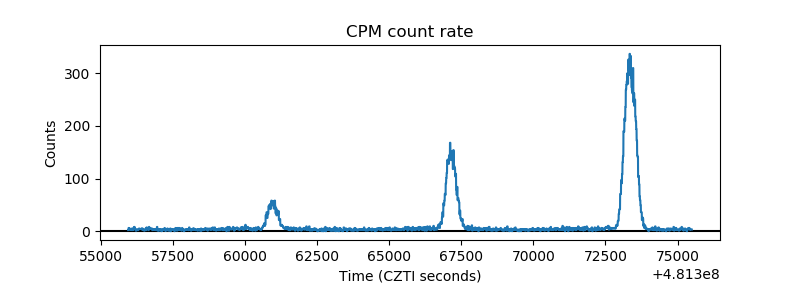 |
| CZT Counter | 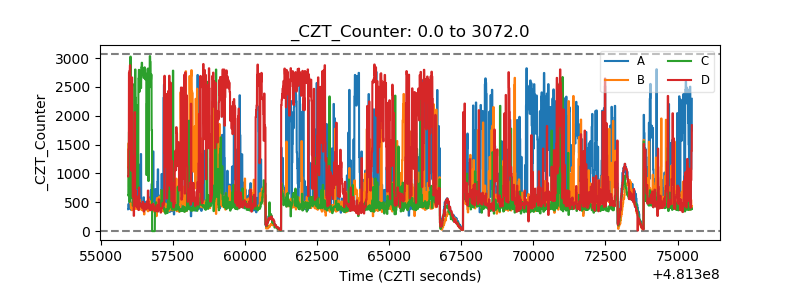 |
| +2.5 Volts monitor | 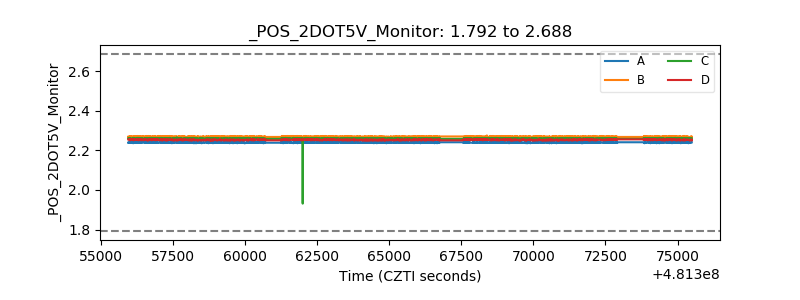 |
| +5 Volts monitor | 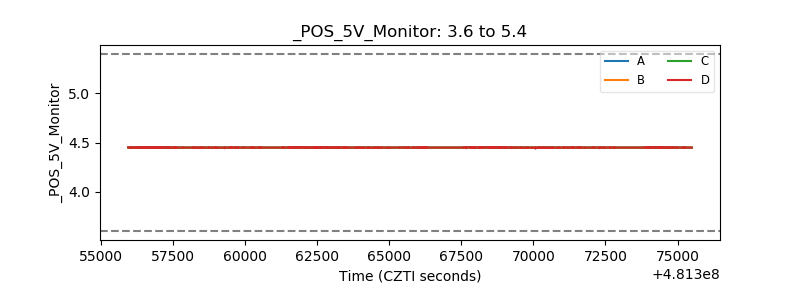 |
| _ROLL_ROT | 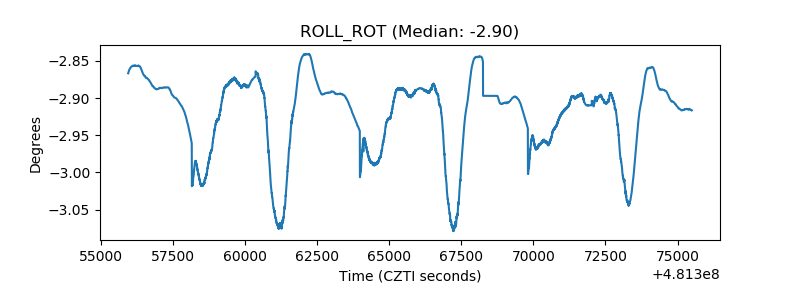 |
| _Roll_DEC | 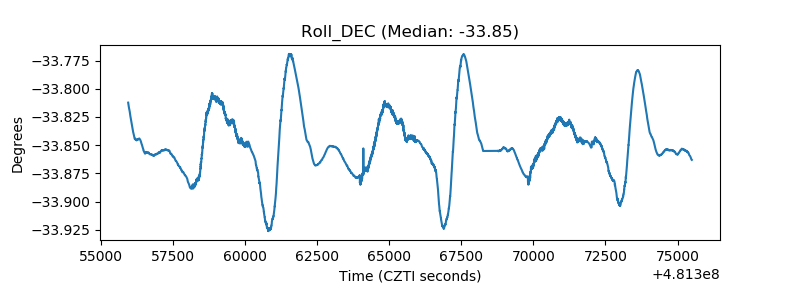 |
| _Roll_RA | 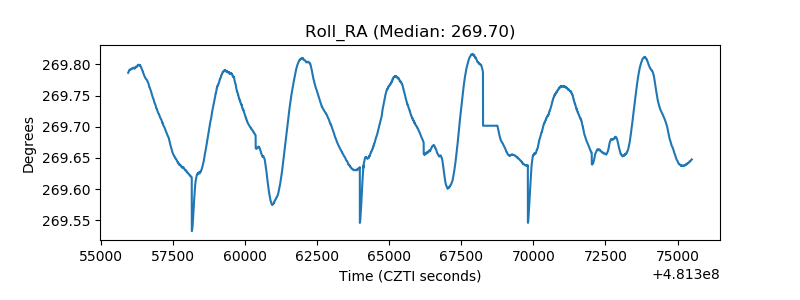 |
| Veto Counter | 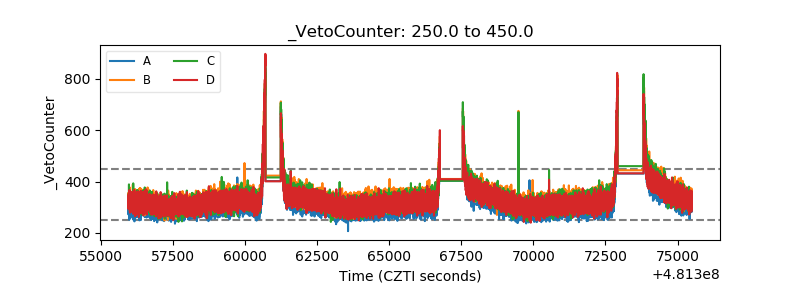 |