| Param | Original file | Final file |
|---|---|---|
| Filename | modeM0/AS1A13_090T01_9000006458_51464cztM0_level2.fits | modeM0/AS1A13_090T01_9000006458_51464cztM0_level2_quad_clean.evt |
| Size (bytes) | 615,225,600 | 88,980,480 |
| Size | 586.7 MB | 84.9 MB |
| Events in quadrant A | 8,818,934 | 476,182 |
| Events in quadrant B | 4,322,339 | 648,100 |
| Events in quadrant C | 3,282,351 | 592,873 |
| Events in quadrant D | 5,851,125 | 527,689 |
| Mode M0 | |||
|---|---|---|---|
| Quadrant | BADHDUFLAG | Total packets | Discarded packets |
| A | 0 | 30620 | 1 |
| B | 0 | 17159 | 1 |
| C | 0 | 14546 | 1 |
| D | 0 | 21817 | 1 |
| Mode M9 | |||
|---|---|---|---|
| Quadrant | BADHDUFLAG | Total packets | Discarded packets |
| A | 0 | 10 | 0 |
| B | 0 | 10 | 0 |
| C | 0 | 10 | 0 |
| D | 0 | 10 | 0 |
| Mode SS | |||
|---|---|---|---|
| Quadrant | BADHDUFLAG | Total packets | Discarded packets |
| A | 0 | 132 | 0 |
| B | 0 | 132 | 0 |
| C | 0 | 132 | 0 |
| D | 0 | 132 | 0 |
| Quadrant | Total seconds | Saturated seconds | Saturation percentage |
|---|---|---|---|
| A | 6433 | 1842 | 28.633608% |
| B | 6434 | 307 | 4.771526% |
| C | 6434 | 134 | 2.082686% |
| D | 6434 | 526 | 8.175319% |
Noise dominated data is calculated using 1-second bins in cleaned event files. If a bin has >2000 counts, and if more than 50% of those come from <1% of pixels, then it is considered to be noise-dominated and hence unusable.
| Quadrant | # 1 sec bins | Bins with >0 counts | Bins with >2000 counts | High rate bins dominated by noise | Noise dominated (total time) | Noise dominated (detector-on time) | Marked lightcurve |
|---|---|---|---|---|---|---|---|
| A | 7463 | 6434 | 1514 | 1514 | 20.29% | 23.53% | 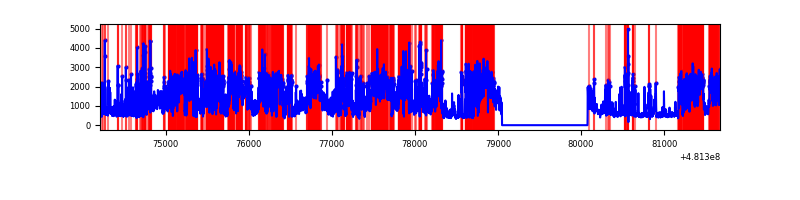 |
| B | 7464 | 6435 | 114 | 114 | 1.53% | 1.77% | 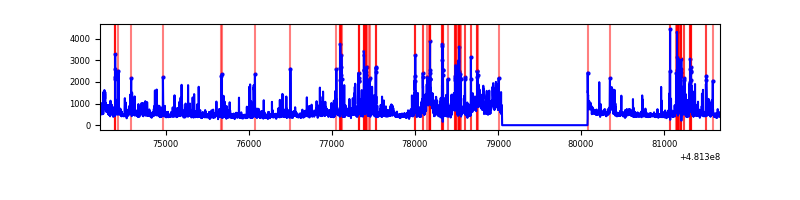 |
| C | 7464 | 6435 | 75 | 75 | 1.00% | 1.17% | 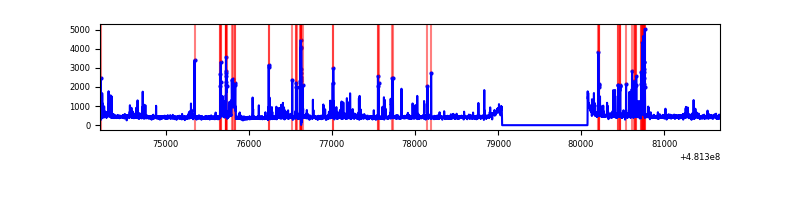 |
| D | 7464 | 6435 | 482 | 482 | 6.46% | 7.49% | 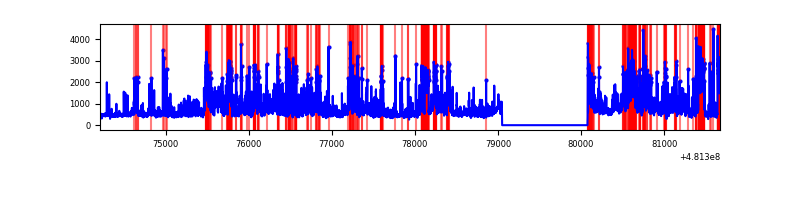 |
Top three noisy pixels from each quadrant. If the there are fewer than three noisy pixels in the level2.evt file, extra rows are filled as -1
| Pixel properties | Quadrant properties | ||||||
|---|---|---|---|---|---|---|---|
| Quadrant | DetID | PixID | Counts | Sigma | Mean | Median | Sigma |
| A | 8 | 249 | 2203890 | 13815.72 | 649 | 635 | 159.5 |
| A | 12 | 3 | 1041161 | 6524.72 | 649 | 635 | 159.5 |
| A | 12 | 250 | 950705 | 5957.5 | 649 | 635 | 159.5 |
| B | 8 | 234 | 339261 | 2301.36 | 688 | 665 | 147.1 |
| B | 4 | 206 | 316902 | 2149.39 | 688 | 665 | 147.1 |
| B | 10 | 254 | 261781 | 1774.75 | 688 | 665 | 147.1 |
| C | 13 | 3 | 278369 | 1497.69 | 681 | 676 | 185.4 |
| C | 14 | 254 | 140335 | 753.23 | 681 | 676 | 185.4 |
| C | 12 | 250 | 107575 | 576.54 | 681 | 676 | 185.4 |
| D | 8 | 176 | 1190849 | 6370.09 | 666 | 642 | 186.8 |
| D | 3 | 12 | 970960 | 5193.22 | 666 | 642 | 186.8 |
| D | 6 | 42 | 324028 | 1730.79 | 666 | 642 | 186.8 |
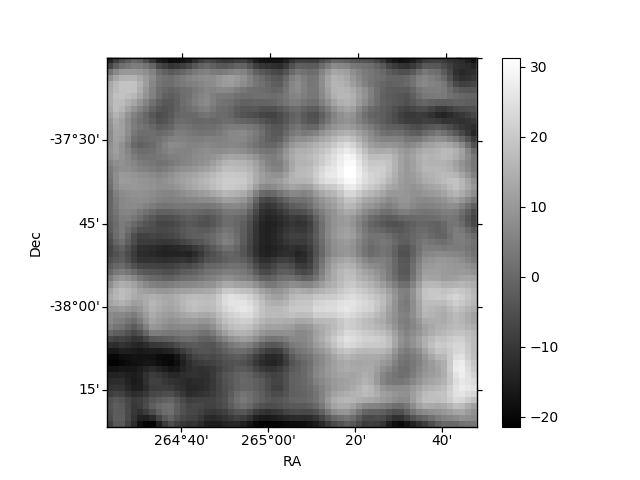
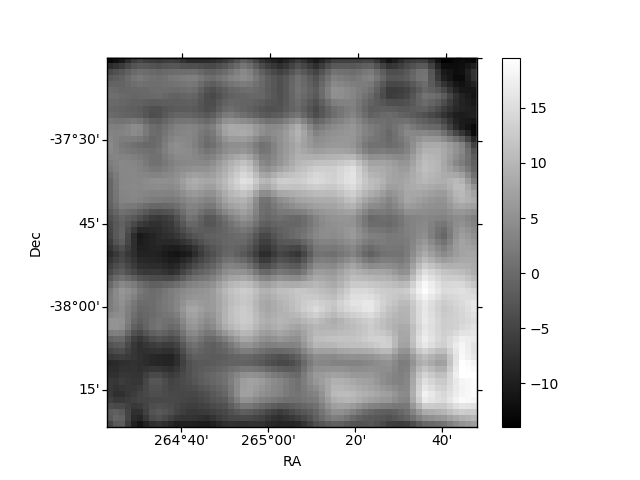
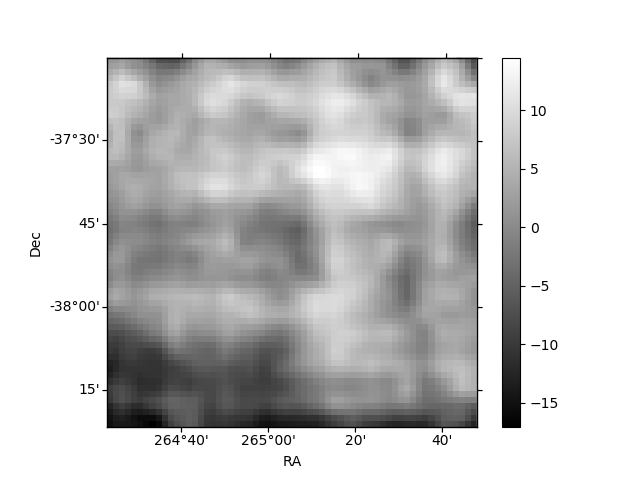
Histogram calculated using DETX and DETY for each event in the final _common_clean file
| Quadrant A | 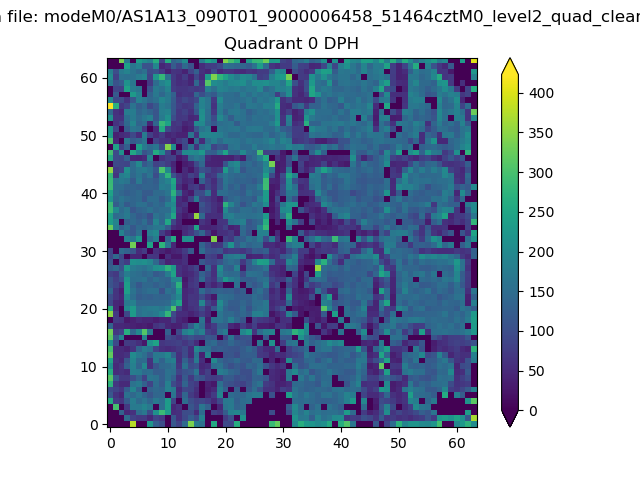 |
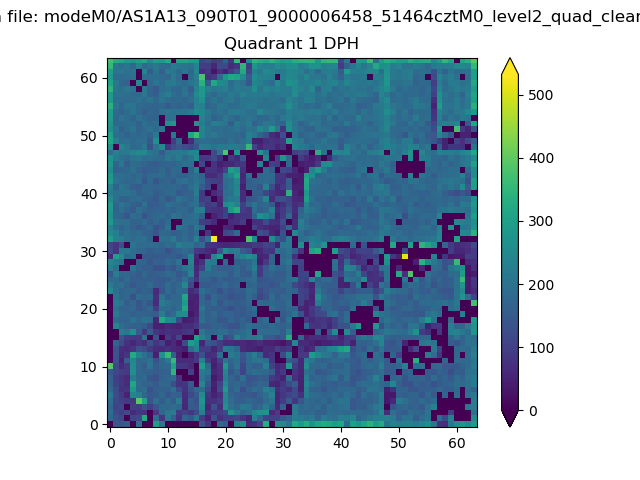 |
Quadrant B |
|---|---|---|---|
| Quadrant D | 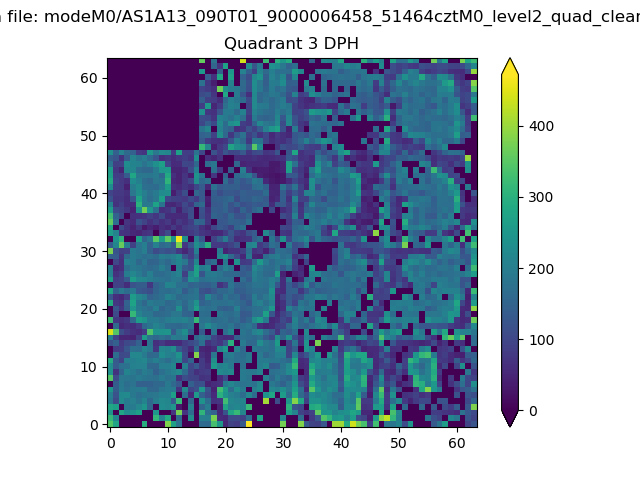 |
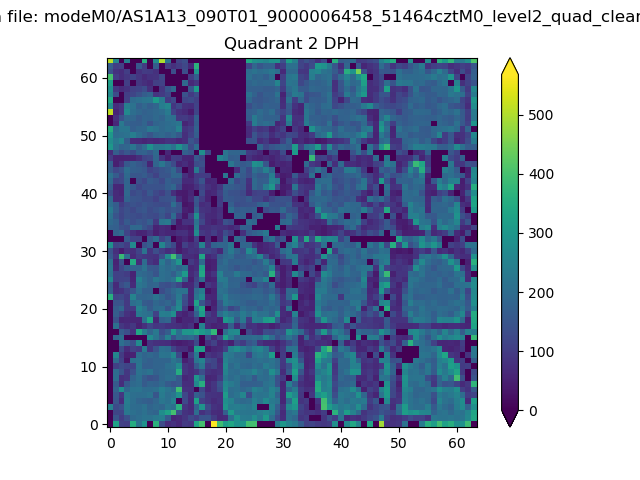 |
Quadrant C |
| Plot type | Count rate plots | Images |
|---|---|---|
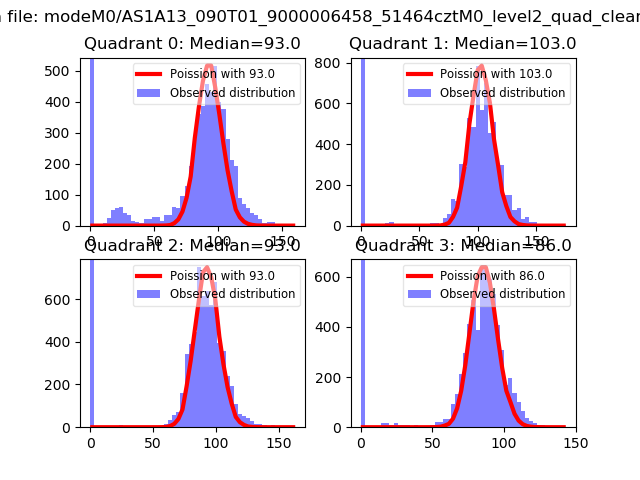
| Comparison with Poisson distribution Blue bars denote a histogram of data divided into 1 sec bins. Red curve is a Poisson curve with rate = median count rate of data. |
 |
 |
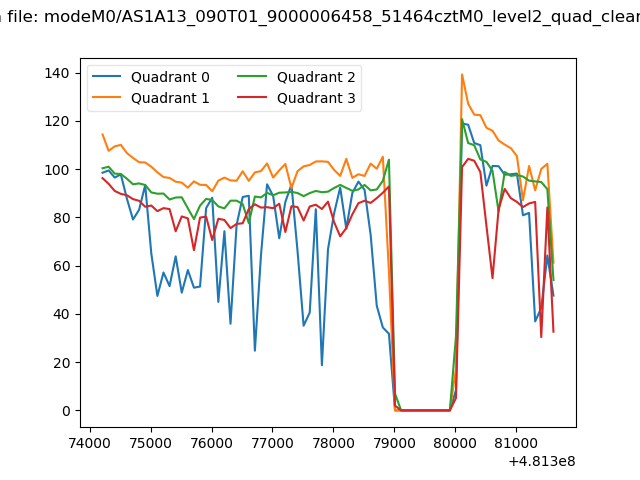
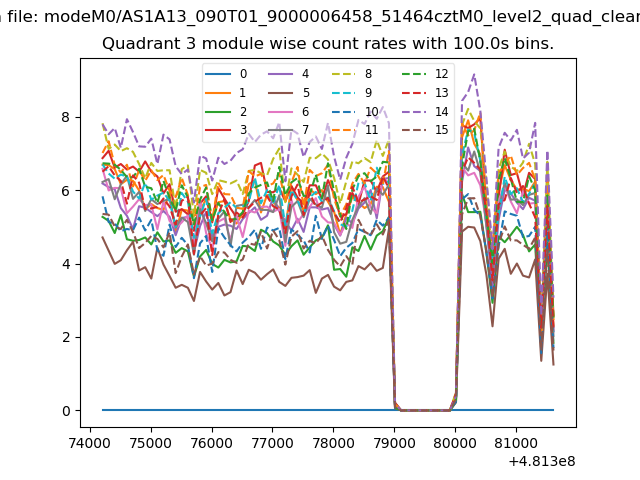
| Quadrant-wise count rates Data is divided into 100 sec bins |
 |
|
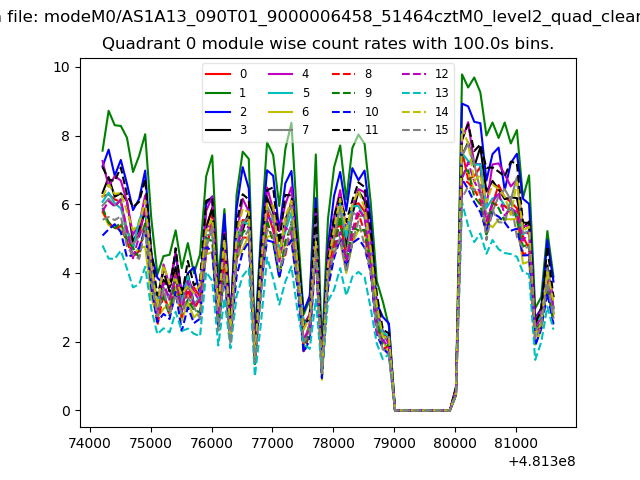
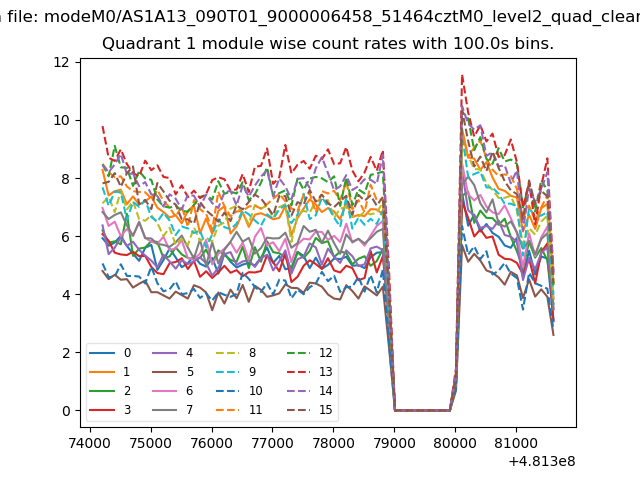
| Module-wise count rates for Quadrant A Data is divided into 100 sec bins |
 |
 |
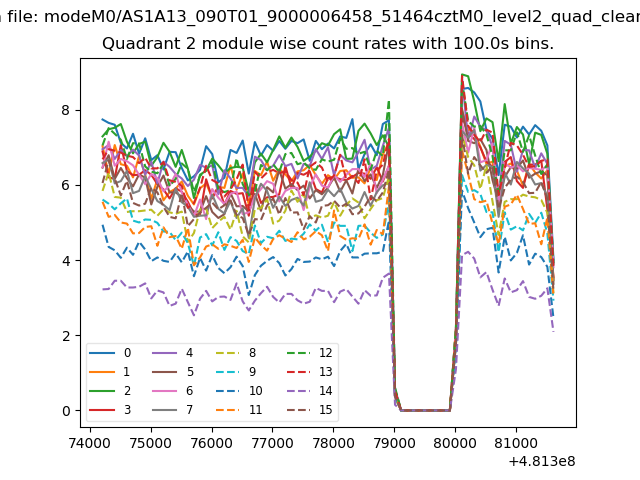
| Module-wise count rates for Quadrant B Data is divided into 100 sec bins |
 |
 |
| Module-wise count rates for Quadrant C Data is divided into 100 sec bins |
 |
 |
| Module-wise count rates for Quadrant D Data is divided into 100 sec bins |
 |
 |
| Parameter | Plot |
|---|---|
| CZT HV Monitor | 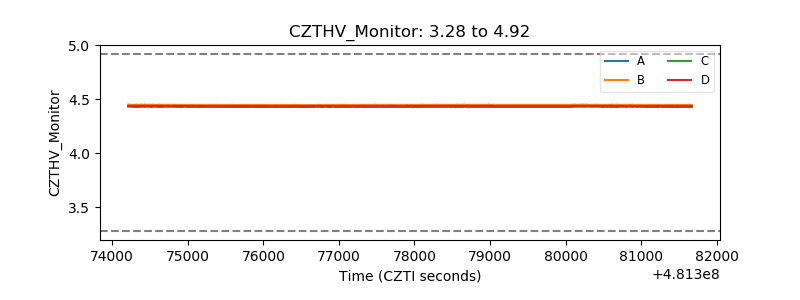 |
| D_VDD | 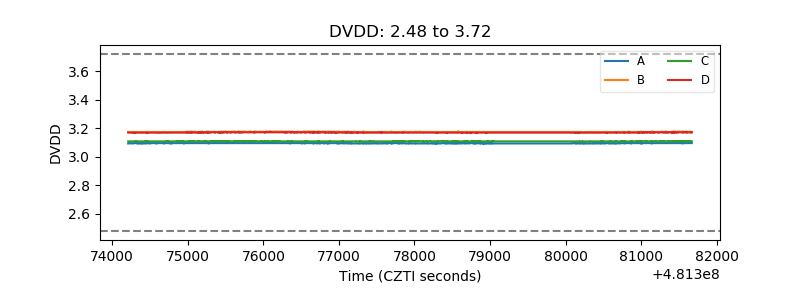 |
| Temperature 1 | 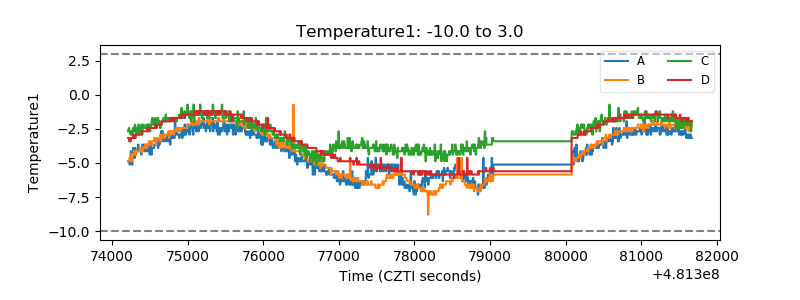 |
| Veto HV Monitor | 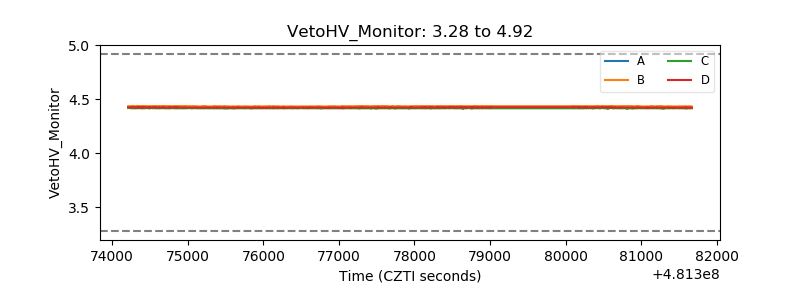 |
| Veto LLD | 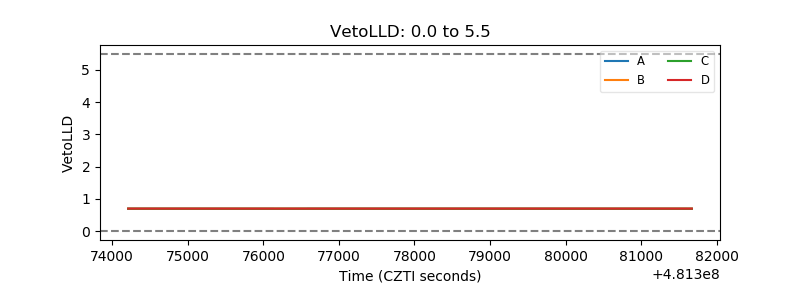 |
| Alpha Counter | 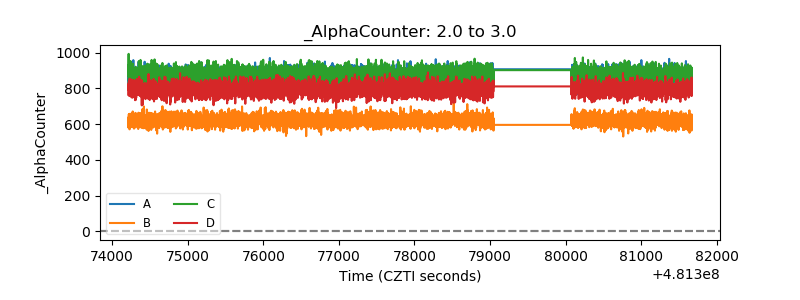 |
| _CPM_Rate | 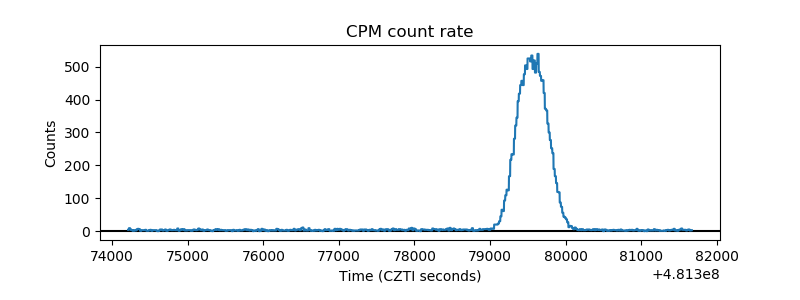 |
| CZT Counter | 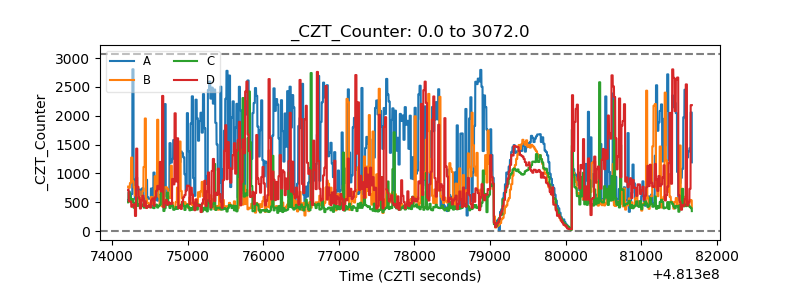 |
| +2.5 Volts monitor | 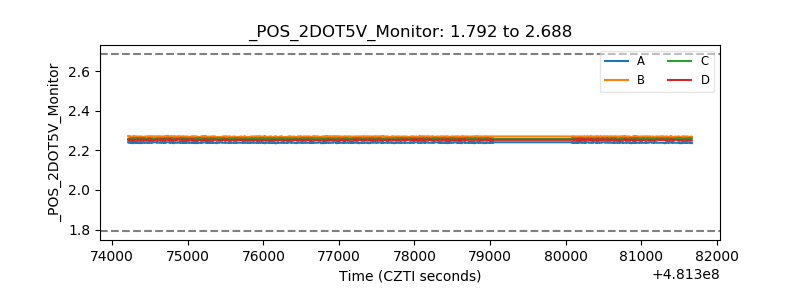 |
| +5 Volts monitor | 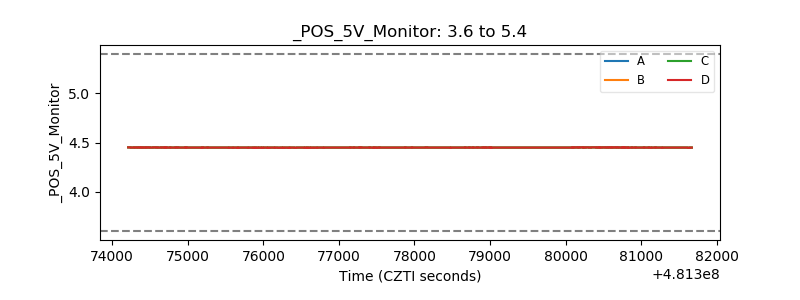 |
| _ROLL_ROT | 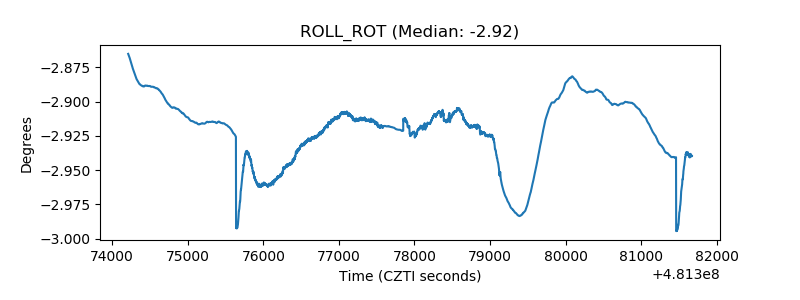 |
| _Roll_DEC | 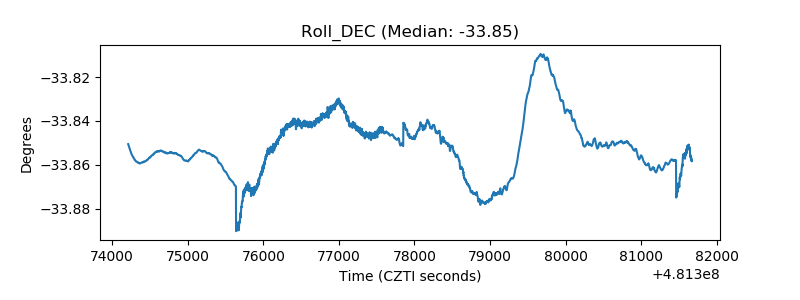 |
| _Roll_RA | 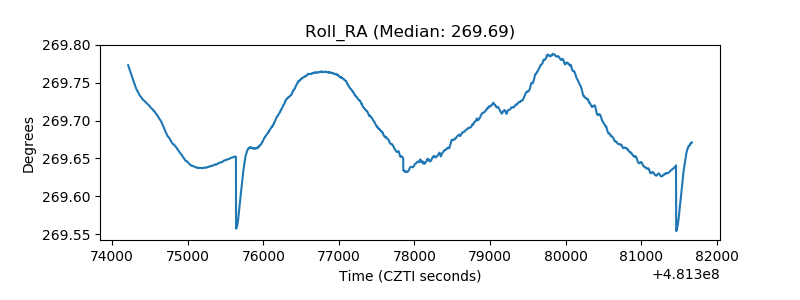 |
| Veto Counter | 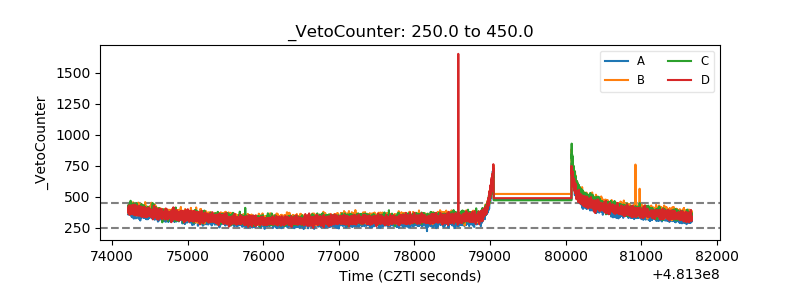 |