| Param | Original file | Final file |
|---|---|---|
| Filename | modeM0/AS1A13_090T01_9000006458_51465cztM0_level2.fits | modeM0/AS1A13_090T01_9000006458_51465cztM0_level2_quad_clean.evt |
| Size (bytes) | 742,953,600 | 92,675,520 |
| Size | 708.5 MB | 88.4 MB |
| Events in quadrant A | 8,444,447 | 577,879 |
| Events in quadrant B | 5,085,528 | 709,642 |
| Events in quadrant C | 3,756,975 | 638,665 |
| Events in quadrant D | 9,692,232 | 408,707 |
| Mode M0 | |||
|---|---|---|---|
| Quadrant | BADHDUFLAG | Total packets | Discarded packets |
| A | 0 | 29761 | 2 |
| B | 0 | 19646 | 3 |
| C | 0 | 15980 | 2 |
| D | 0 | 33479 | 2 |
| Mode M9 | |||
|---|---|---|---|
| Quadrant | BADHDUFLAG | Total packets | Discarded packets |
| A | 0 | 11 | 0 |
| B | 0 | 11 | 0 |
| C | 0 | 11 | 0 |
| D | 0 | 11 | 0 |
| Mode SS | |||
|---|---|---|---|
| Quadrant | BADHDUFLAG | Total packets | Discarded packets |
| A | 0 | 138 | 0 |
| B | 0 | 138 | 0 |
| C | 0 | 138 | 0 |
| D | 0 | 138 | 0 |
| Quadrant | Total seconds | Saturated seconds | Saturation percentage |
|---|---|---|---|
| A | 6755 | 1297 | 19.200592% |
| B | 6754 | 316 | 4.678709% |
| C | 6754 | 197 | 2.916790% |
| D | 6754 | 2409 | 35.667752% |
Noise dominated data is calculated using 1-second bins in cleaned event files. If a bin has >2000 counts, and if more than 50% of those come from <1% of pixels, then it is considered to be noise-dominated and hence unusable.
| Quadrant | # 1 sec bins | Bins with >0 counts | Bins with >2000 counts | High rate bins dominated by noise | Noise dominated (total time) | Noise dominated (detector-on time) | Marked lightcurve |
|---|---|---|---|---|---|---|---|
| A | 7845 | 6756 | 1155 | 1155 | 14.72% | 17.10% | 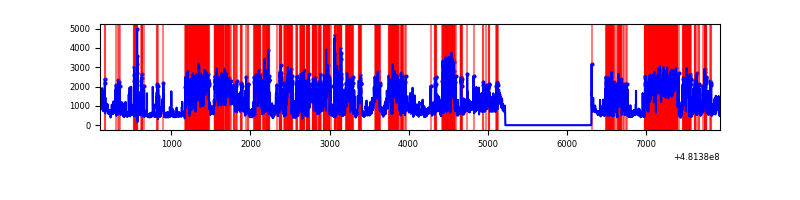 |
| B | 7844 | 6755 | 98 | 98 | 1.25% | 1.45% | 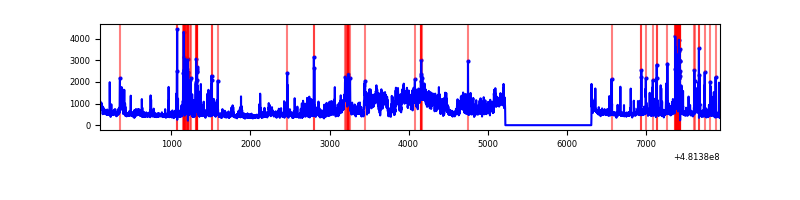 |
| C | 7844 | 6755 | 115 | 115 | 1.47% | 1.70% | 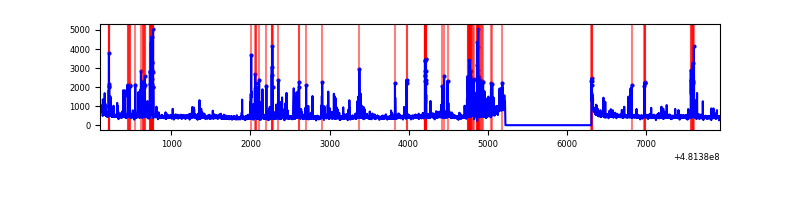 |
| D | 7844 | 6754 | 2034 | 2034 | 25.93% | 30.12% | 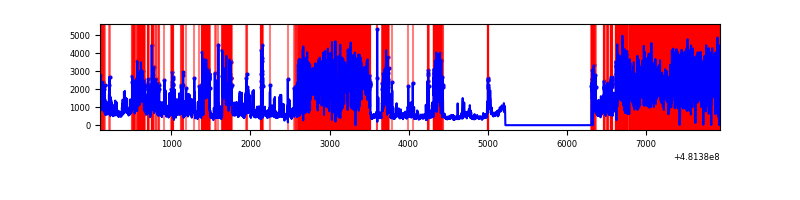 |
Top three noisy pixels from each quadrant. If the there are fewer than three noisy pixels in the level2.evt file, extra rows are filled as -1
| Pixel properties | Quadrant properties | ||||||
|---|---|---|---|---|---|---|---|
| Quadrant | DetID | PixID | Counts | Sigma | Mean | Median | Sigma |
| A | 8 | 249 | 2324077 | 12952.41 | 731 | 716 | 179.4 |
| A | 4 | 175 | 1109026 | 6178.67 | 731 | 716 | 179.4 |
| A | 12 | 3 | 798273 | 4446.27 | 731 | 716 | 179.4 |
| B | 10 | 254 | 1239281 | 7781.67 | 746 | 720 | 159.2 |
| B | 4 | 206 | 390835 | 2451.03 | 746 | 720 | 159.2 |
| B | 8 | 234 | 57873 | 359.08 | 746 | 720 | 159.2 |
| C | 13 | 3 | 363705 | 1785.46 | 735 | 730 | 203.3 |
| C | 12 | 250 | 297623 | 1460.41 | 735 | 730 | 203.3 |
| C | 14 | 254 | 72923 | 355.12 | 735 | 730 | 203.3 |
| D | 8 | 176 | 3367158 | 19851.59 | 610 | 587 | 169.6 |
| D | 3 | 12 | 2680594 | 15803.14 | 610 | 587 | 169.6 |
| D | 15 | 94 | 417461 | 2458.17 | 610 | 587 | 169.6 |
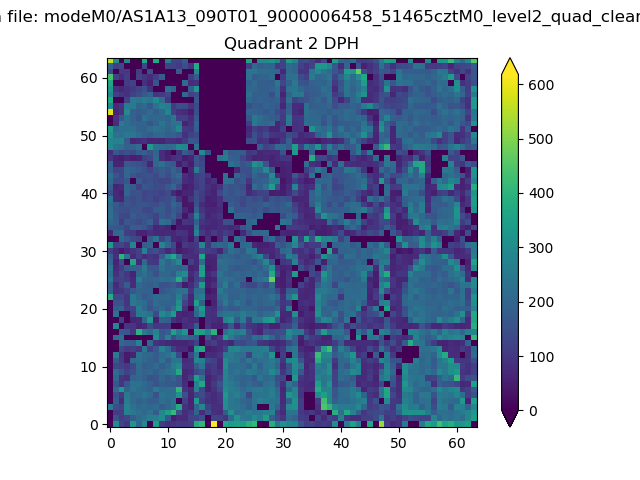
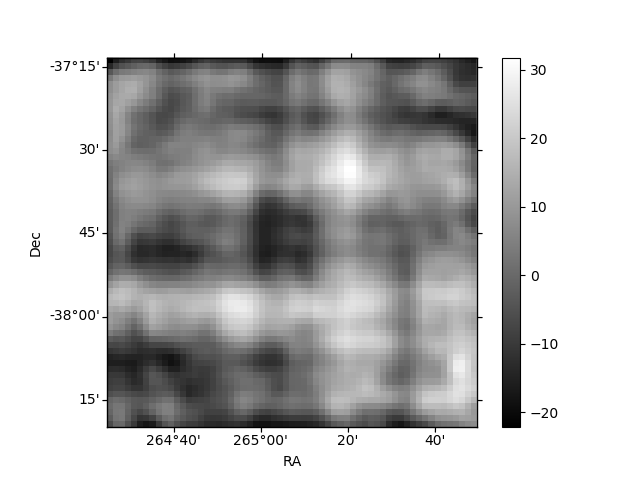
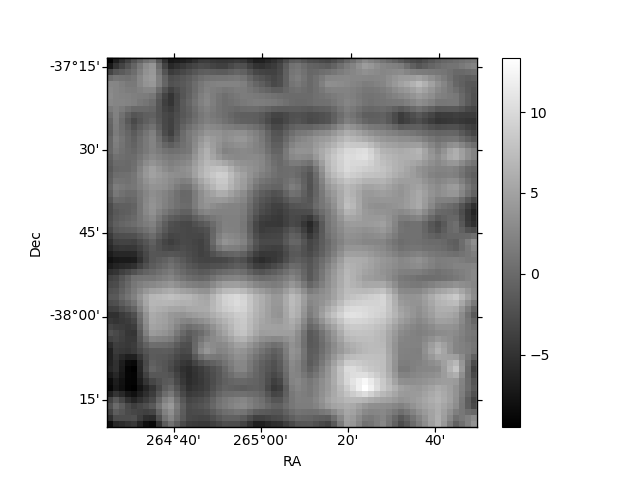
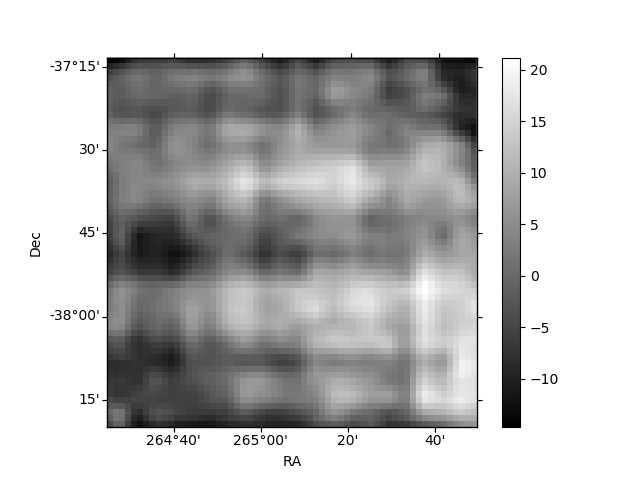
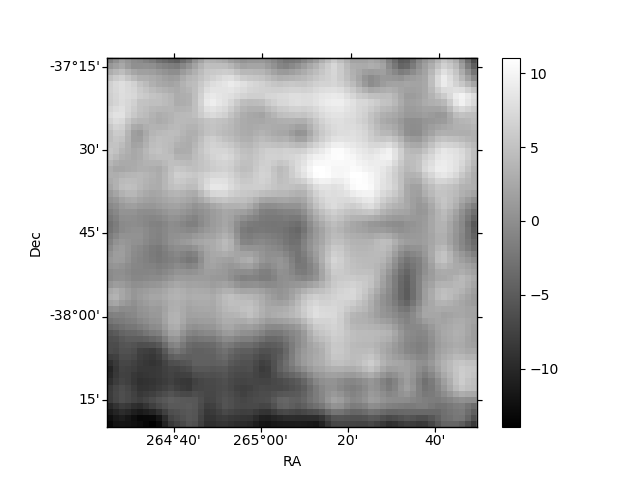
Histogram calculated using DETX and DETY for each event in the final _common_clean file
| Quadrant A | 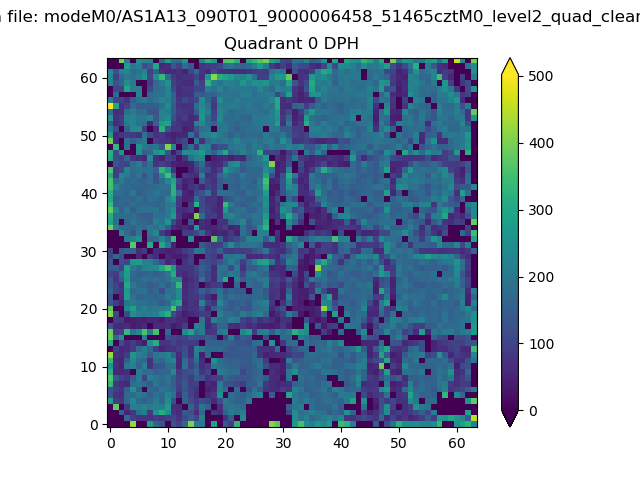 |
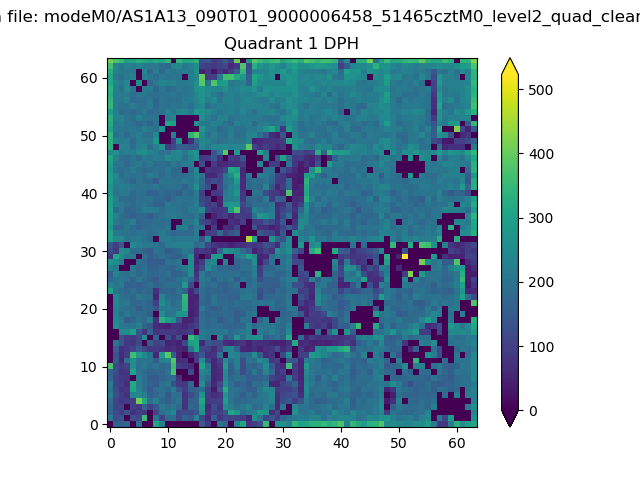 |
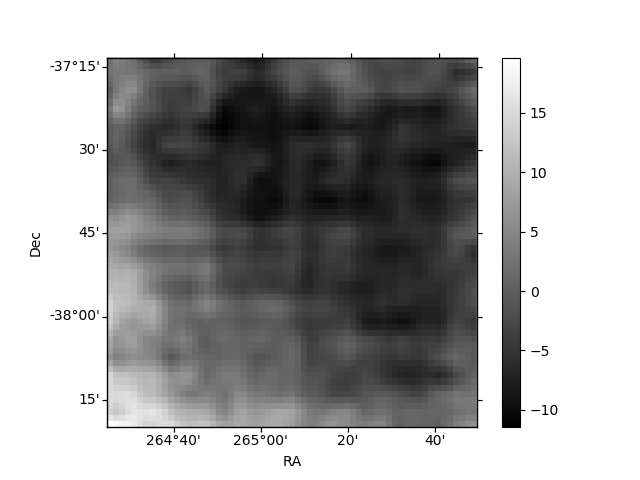
Quadrant B |
|---|---|---|---|
| Quadrant D | 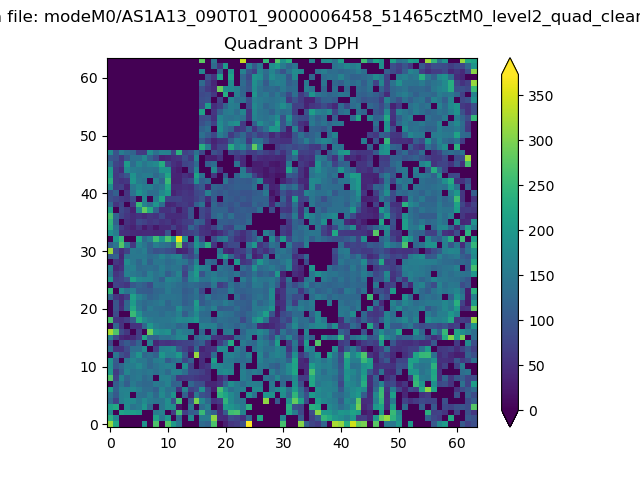 |
 |
Quadrant C |
| Plot type | Count rate plots | Images |
|---|---|---|
| Comparison with Poisson distribution Blue bars denote a histogram of data divided into 1 sec bins. Red curve is a Poisson curve with rate = median count rate of data. |
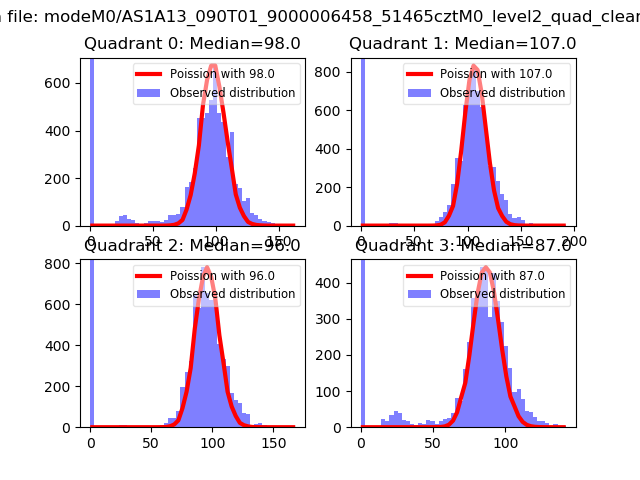 |
 |
| Quadrant-wise count rates Data is divided into 100 sec bins |
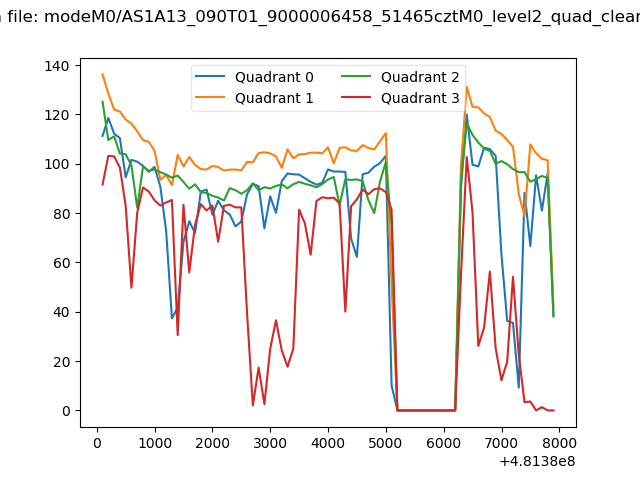 |
|
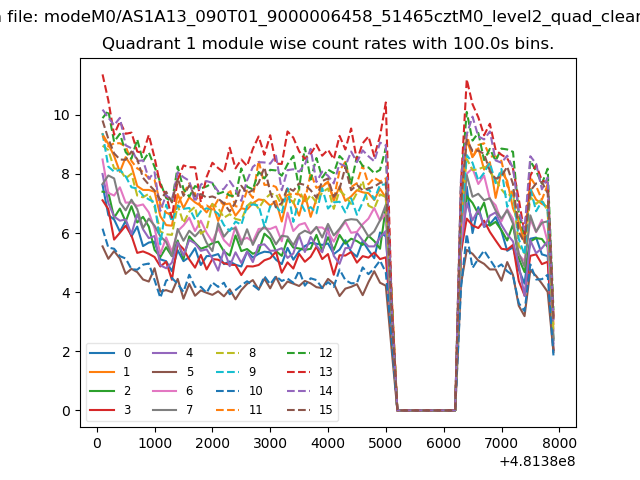
| Module-wise count rates for Quadrant A Data is divided into 100 sec bins |
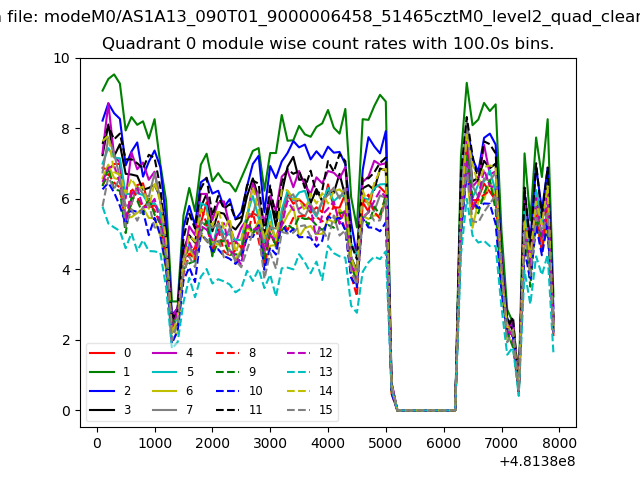 |
 |
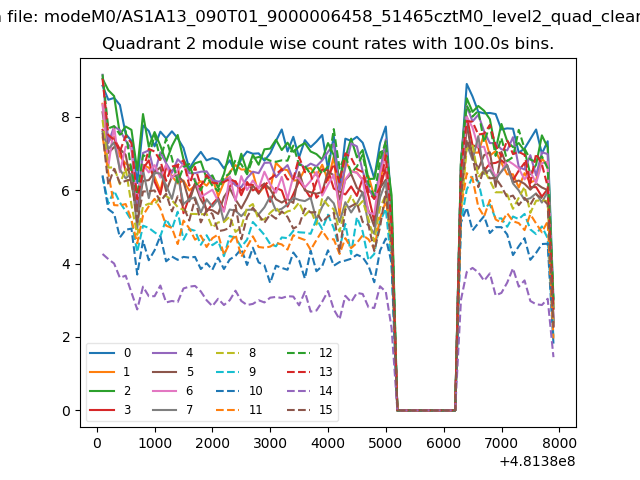
| Module-wise count rates for Quadrant B Data is divided into 100 sec bins |
 |
 |
| Module-wise count rates for Quadrant C Data is divided into 100 sec bins |
 |
 |
| Module-wise count rates for Quadrant D Data is divided into 100 sec bins |
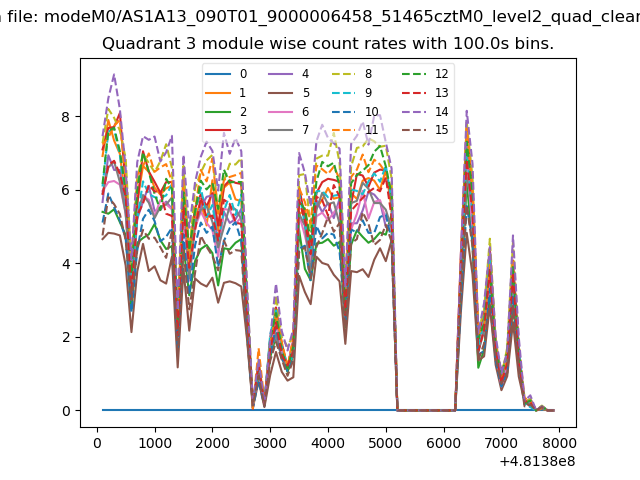 |
 |
| Parameter | Plot |
|---|---|
| CZT HV Monitor | 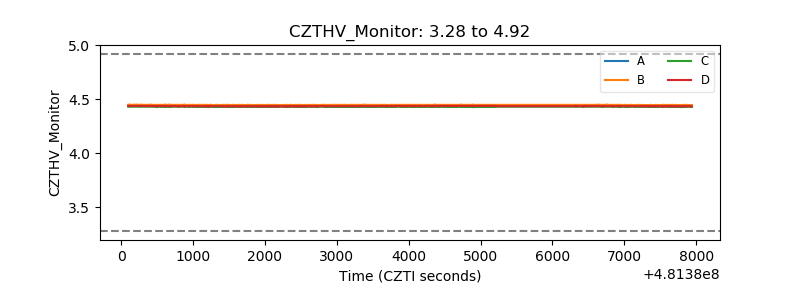 |
| D_VDD | 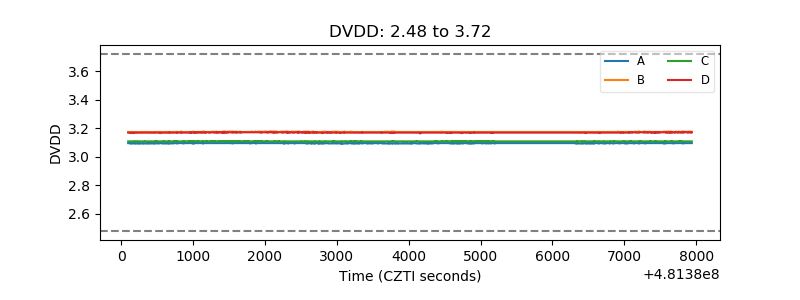 |
| Temperature 1 | 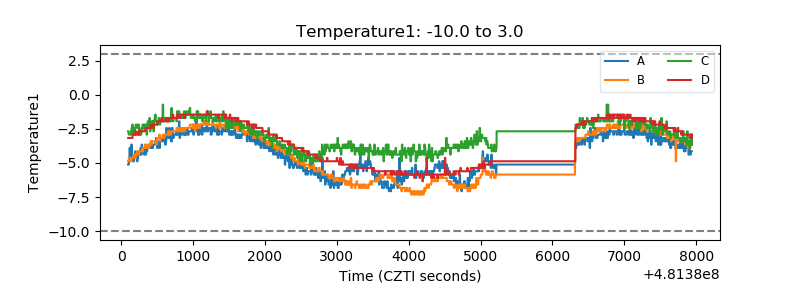 |
| Veto HV Monitor | 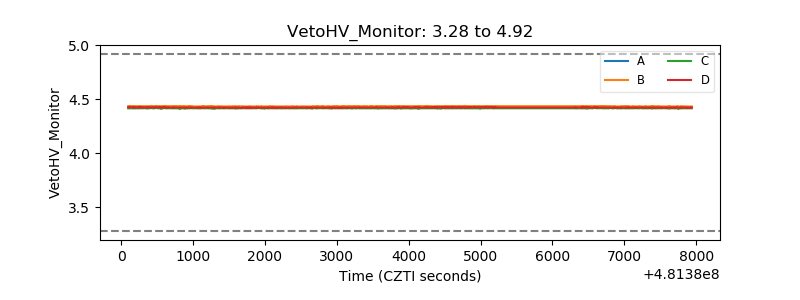 |
| Veto LLD | 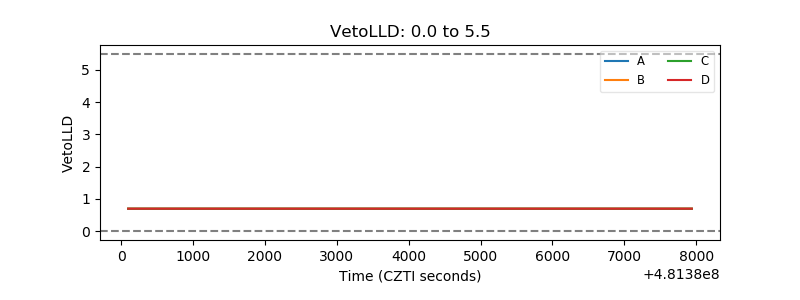 |
| Alpha Counter | 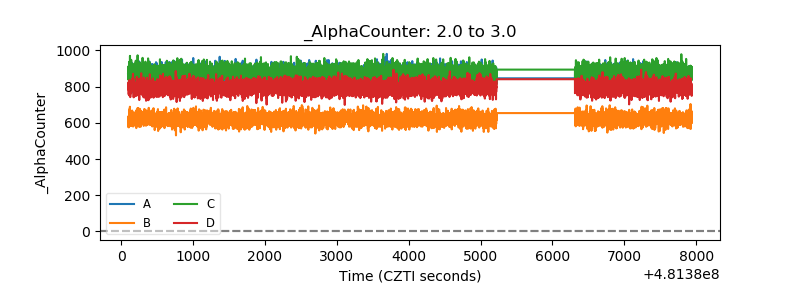 |
| _CPM_Rate | 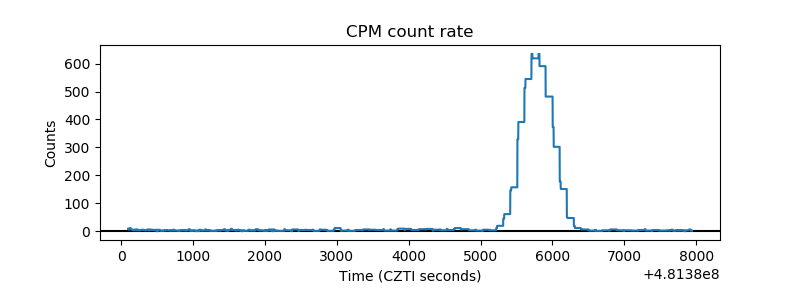 |
| CZT Counter | 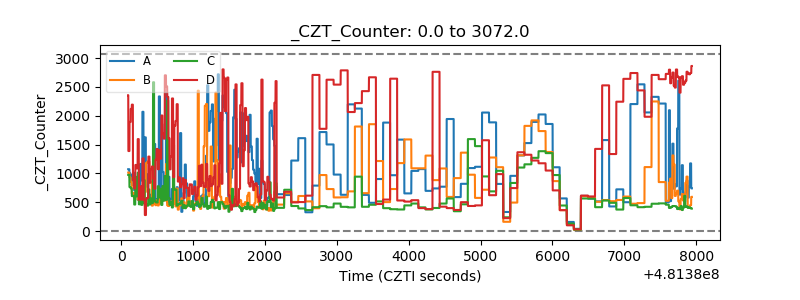 |
| +2.5 Volts monitor | 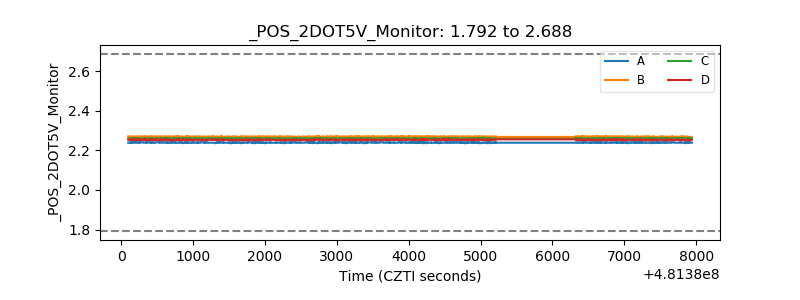 |
| +5 Volts monitor | 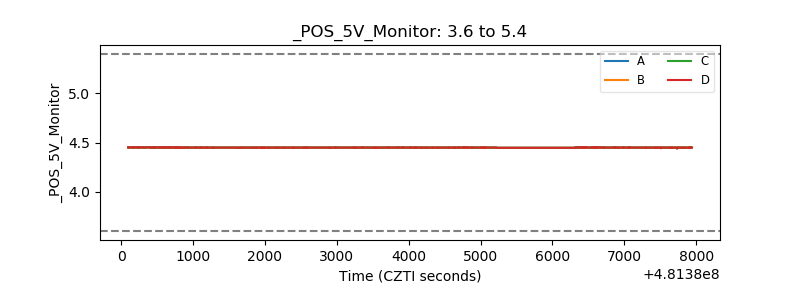 |
| _ROLL_ROT | 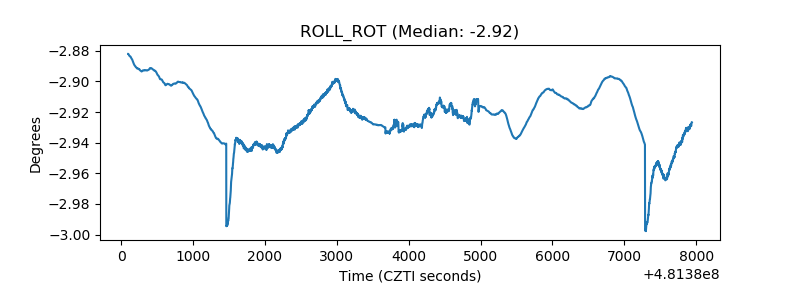 |
| _Roll_DEC | 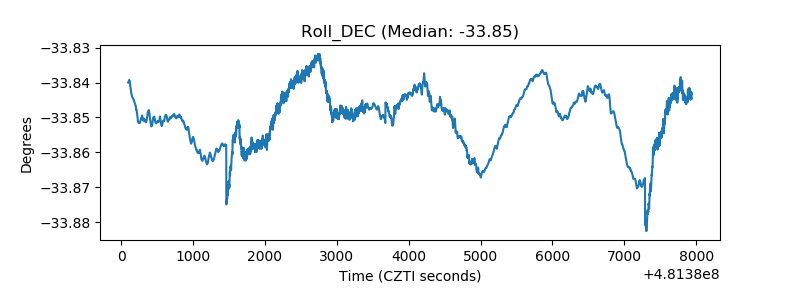 |
| _Roll_RA | 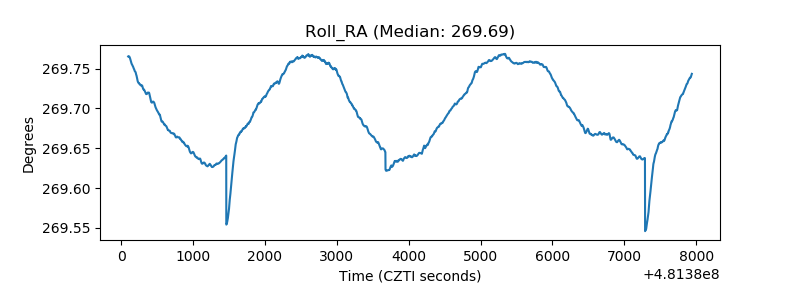 |
| Veto Counter | 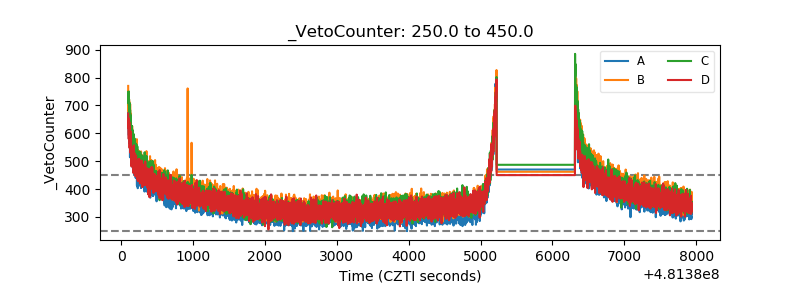 |