| Param | Original file | Final file |
|---|---|---|
| Filename | modeM0/AS1A13_090T01_9000006458_51467cztM0_level2.fits | modeM0/AS1A13_090T01_9000006458_51467cztM0_level2_quad_clean.evt |
| Size (bytes) | 854,988,480 | 80,150,400 |
| Size | 815.4 MB | 76.4 MB |
| Events in quadrant A | 5,604,448 | 602,768 |
| Events in quadrant B | 6,980,810 | 637,520 |
| Events in quadrant C | 3,737,416 | 609,957 |
| Events in quadrant D | 14,822,704 | 122,869 |
| Mode M0 | |||
|---|---|---|---|
| Quadrant | BADHDUFLAG | Total packets | Discarded packets |
| A | 0 | 21086 | 2 |
| B | 0 | 25204 | 2 |
| C | 0 | 15618 | 2 |
| D | 0 | 48553 | 4 |
| Mode M9 | |||
|---|---|---|---|
| Quadrant | BADHDUFLAG | Total packets | Discarded packets |
| A | 0 | 14 | 0 |
| B | 0 | 15 | 0 |
| C | 0 | 15 | 0 |
| D | 0 | 15 | 0 |
| Mode SS | |||
|---|---|---|---|
| Quadrant | BADHDUFLAG | Total packets | Discarded packets |
| A | 0 | 132 | 0 |
| B | 0 | 132 | 0 |
| C | 0 | 132 | 0 |
| D | 0 | 132 | 0 |
| Quadrant | Total seconds | Saturated seconds | Saturation percentage |
|---|---|---|---|
| A | 6501 | 560 | 8.614059% |
| B | 6501 | 878 | 13.505615% |
| C | 6501 | 194 | 2.984156% |
| D | 6500 | 5291 | 81.400000% |
Noise dominated data is calculated using 1-second bins in cleaned event files. If a bin has >2000 counts, and if more than 50% of those come from <1% of pixels, then it is considered to be noise-dominated and hence unusable.
| Quadrant | # 1 sec bins | Bins with >0 counts | Bins with >2000 counts | High rate bins dominated by noise | Noise dominated (total time) | Noise dominated (detector-on time) | Marked lightcurve |
|---|---|---|---|---|---|---|---|
| A | 7596 | 6502 | 435 | 435 | 5.73% | 6.69% | 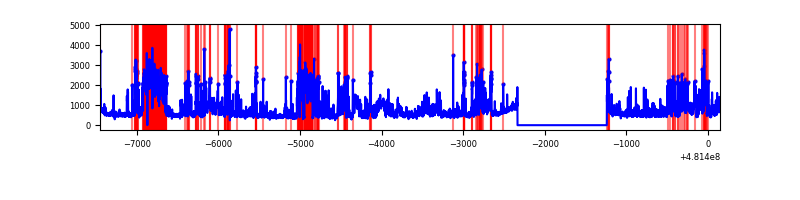 |
| B | 7596 | 6502 | 717 | 717 | 9.44% | 11.03% | 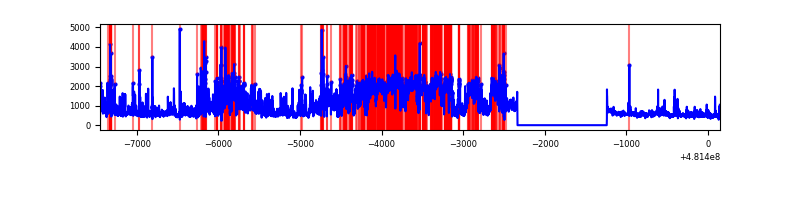 |
| C | 7596 | 6502 | 117 | 117 | 1.54% | 1.80% | 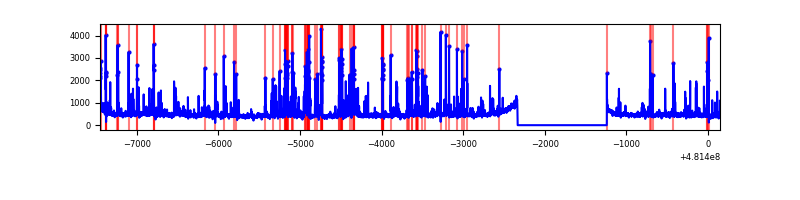 |
| D | 7595 | 6500 | 4422 | 4422 | 58.22% | 68.03% |  |
Top three noisy pixels from each quadrant. If the there are fewer than three noisy pixels in the level2.evt file, extra rows are filled as -1
| Pixel properties | Quadrant properties | ||||||
|---|---|---|---|---|---|---|---|
| Quadrant | DetID | PixID | Counts | Sigma | Mean | Median | Sigma |
| A | 8 | 249 | 682838 | 3917.9 | 713 | 697 | 174.1 |
| A | 4 | 175 | 680592 | 3905.0 | 713 | 697 | 174.1 |
| A | 12 | 3 | 603340 | 3461.3 | 713 | 697 | 174.1 |
| B | 10 | 254 | 3107876 | 20495.8 | 707 | 683 | 151.6 |
| B | 4 | 206 | 352911 | 2323.38 | 707 | 683 | 151.6 |
| B | 0 | 197 | 104870 | 687.24 | 707 | 683 | 151.6 |
| C | 13 | 3 | 288845 | 1498.44 | 702 | 698 | 192.3 |
| C | 15 | 219 | 206343 | 1069.41 | 702 | 698 | 192.3 |
| C | 10 | 19 | 90399 | 466.47 | 702 | 698 | 192.3 |
| D | 8 | 176 | 12644038 | 140142.99 | 314 | 303 | 90.2 |
| D | 6 | 42 | 390408 | 4323.92 | 314 | 303 | 90.2 |
| D | 3 | 12 | 179209 | 1982.99 | 314 | 303 | 90.2 |
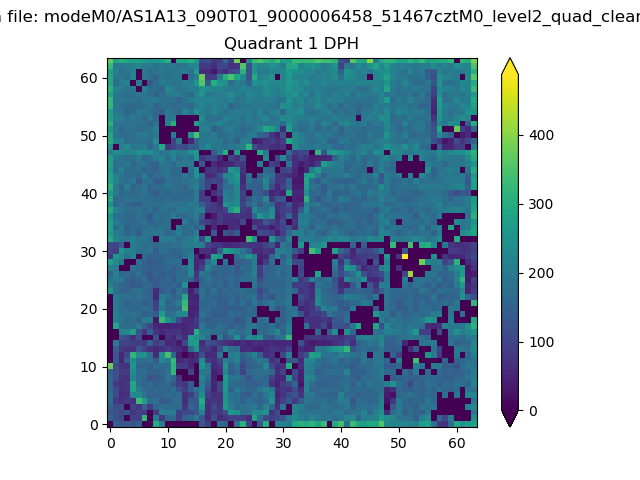
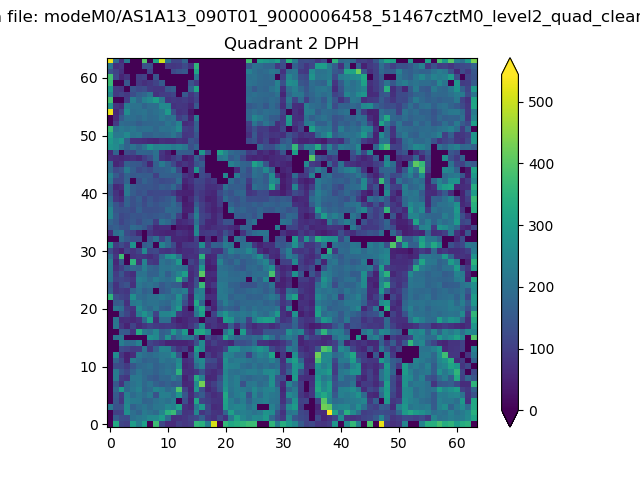
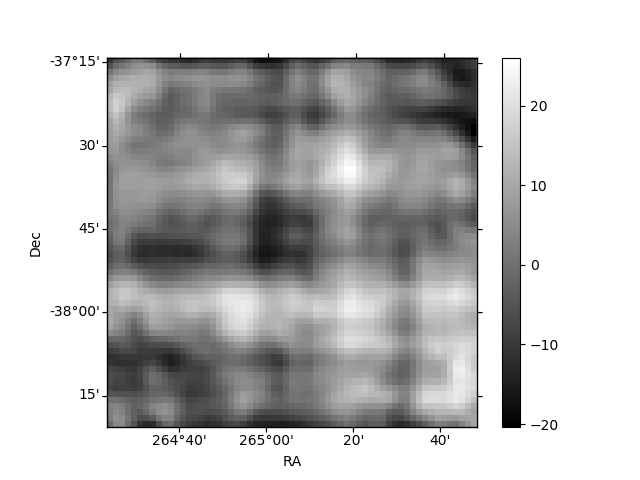
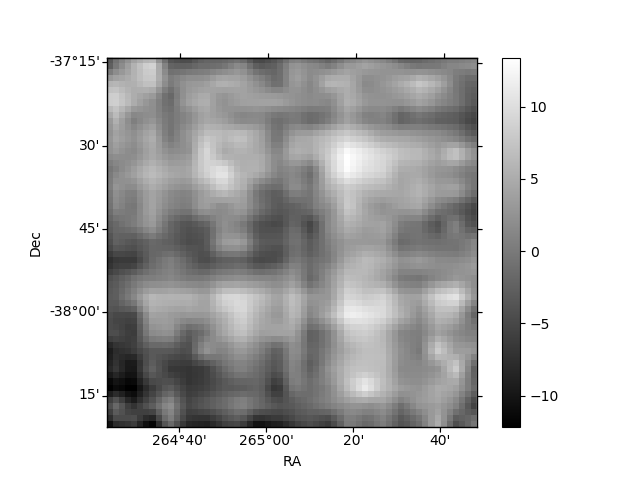
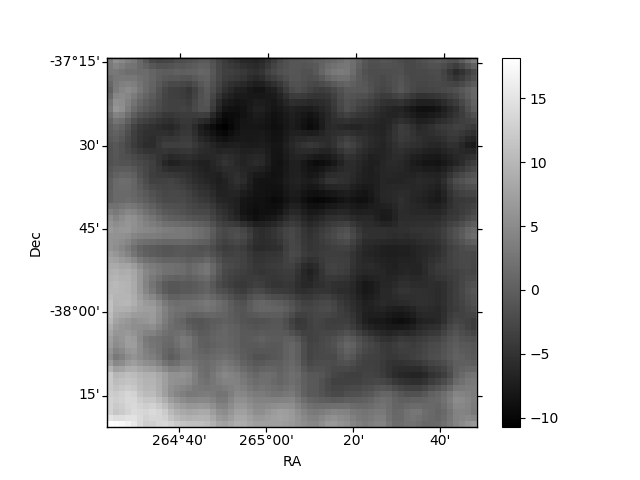
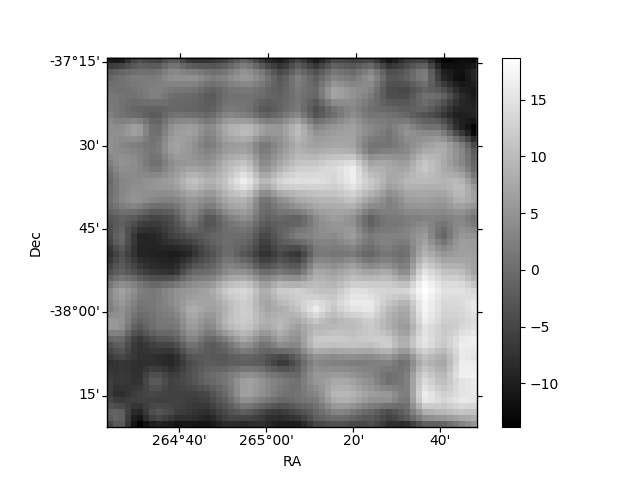
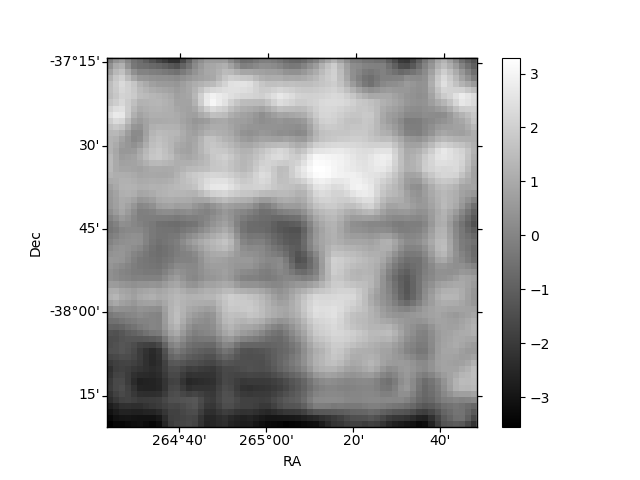
Histogram calculated using DETX and DETY for each event in the final _common_clean file
| Quadrant A | 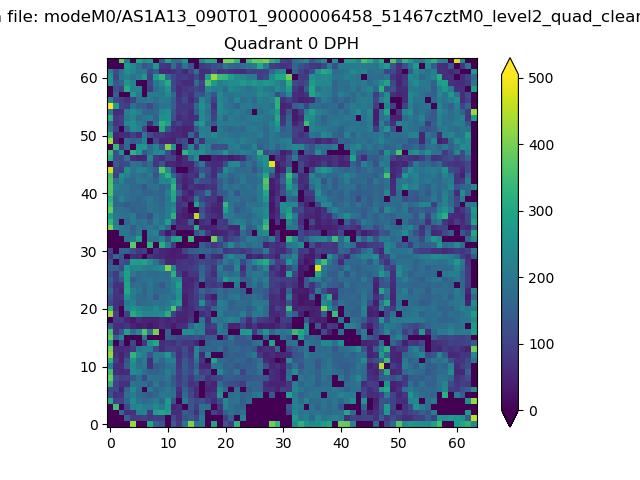 |
 |
Quadrant B |
|---|---|---|---|
| Quadrant D | 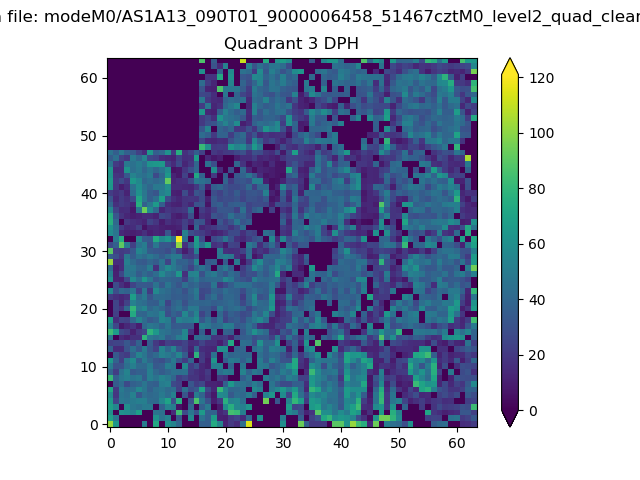 |
 |
Quadrant C |
| Plot type | Count rate plots | Images |
|---|---|---|
| Comparison with Poisson distribution Blue bars denote a histogram of data divided into 1 sec bins. Red curve is a Poisson curve with rate = median count rate of data. |
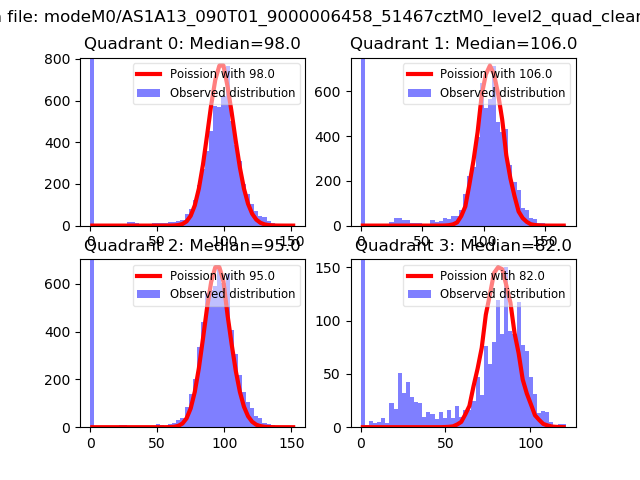 |
 |
| Quadrant-wise count rates Data is divided into 100 sec bins |
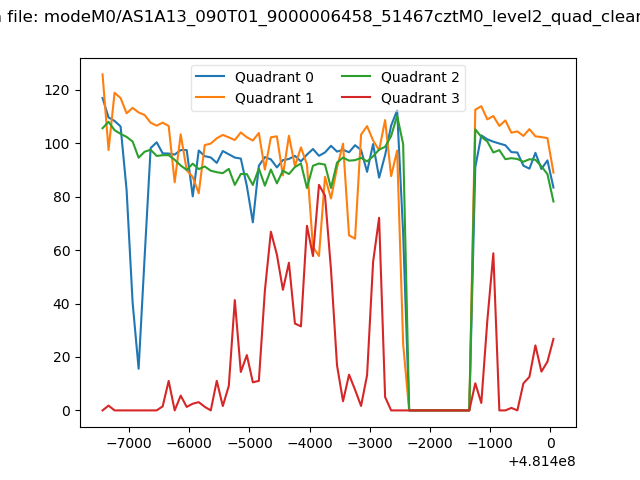 |
|
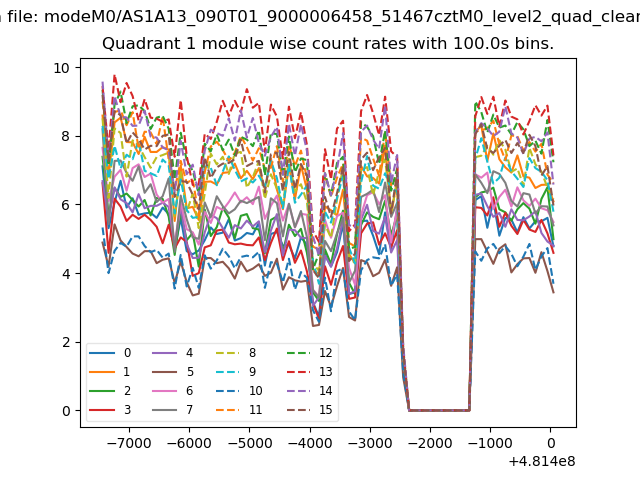
| Module-wise count rates for Quadrant A Data is divided into 100 sec bins |
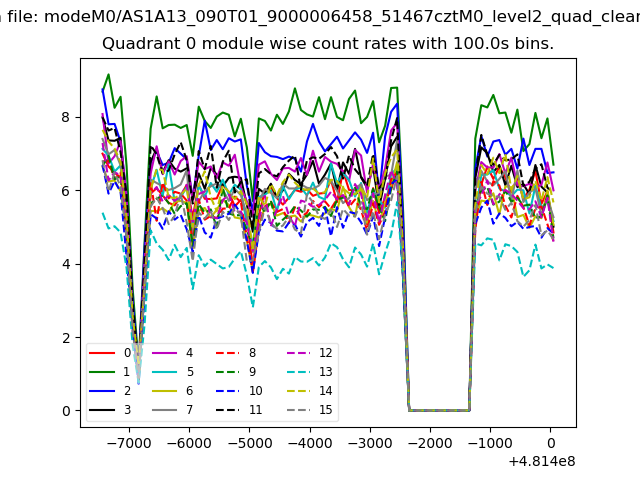 |
 |
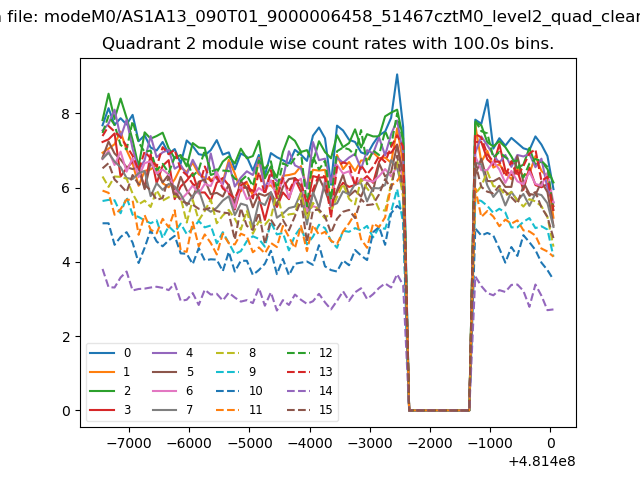
| Module-wise count rates for Quadrant B Data is divided into 100 sec bins |
 |
 |
| Module-wise count rates for Quadrant C Data is divided into 100 sec bins |
 |
 |
| Module-wise count rates for Quadrant D Data is divided into 100 sec bins |
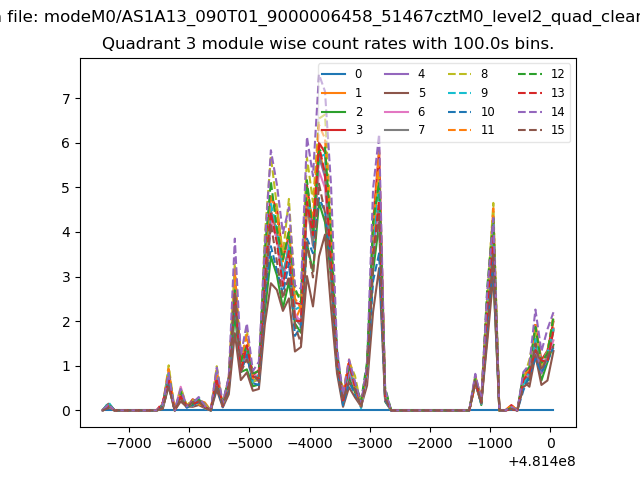 |
 |
| Parameter | Plot |
|---|---|
| CZT HV Monitor | 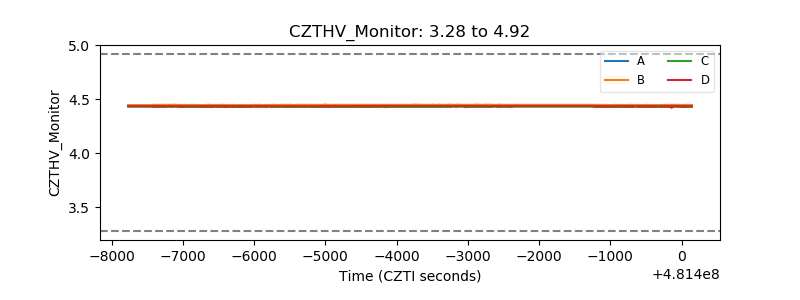 |
| D_VDD | 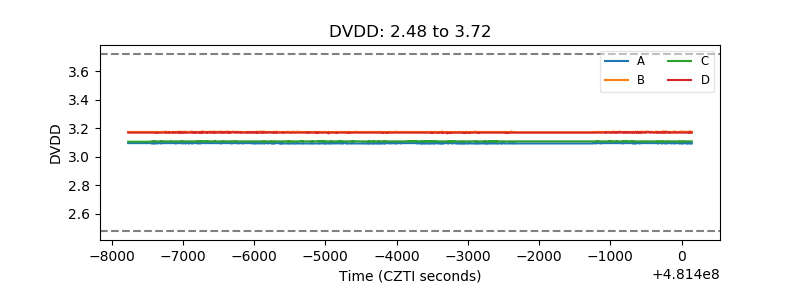 |
| Temperature 1 | 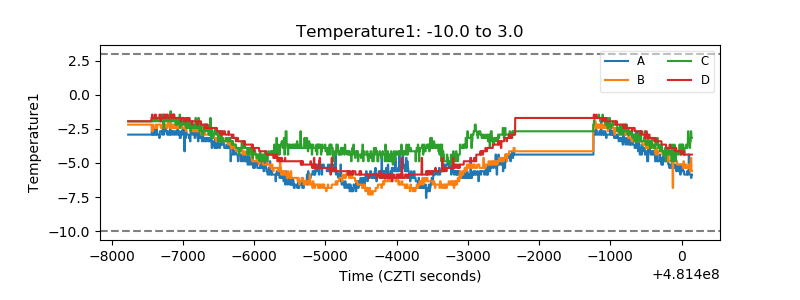 |
| Veto HV Monitor | 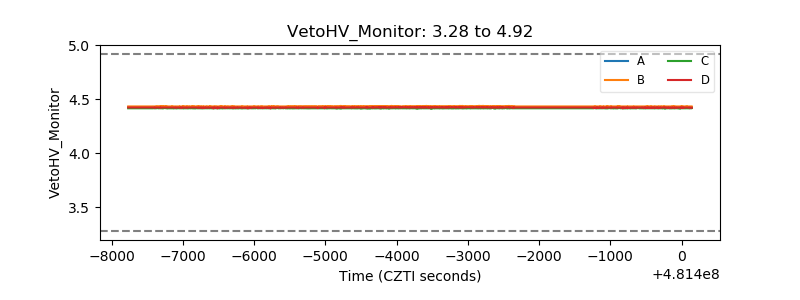 |
| Veto LLD | 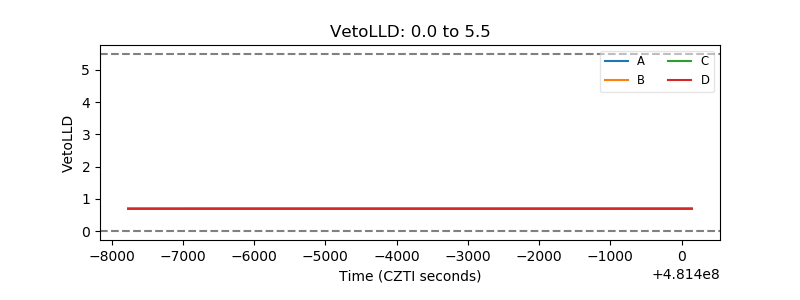 |
| Alpha Counter | 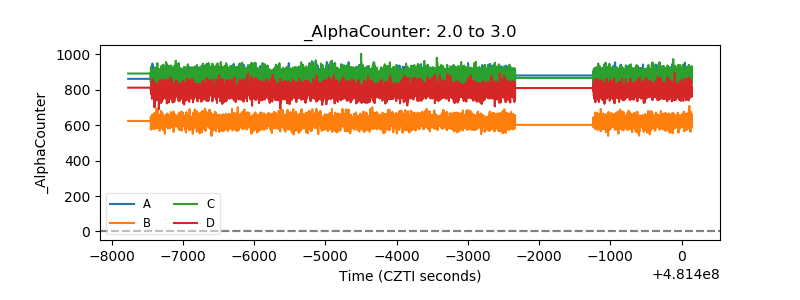 |
| _CPM_Rate | 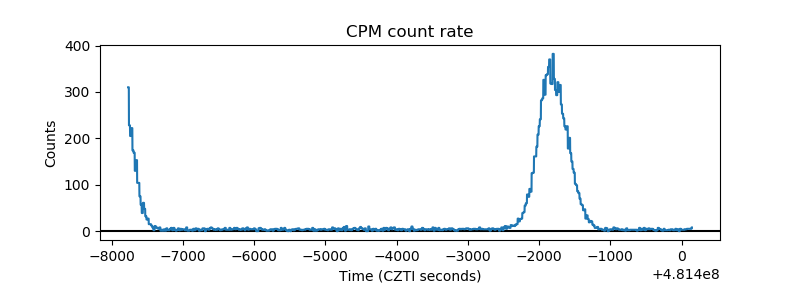 |
| CZT Counter | 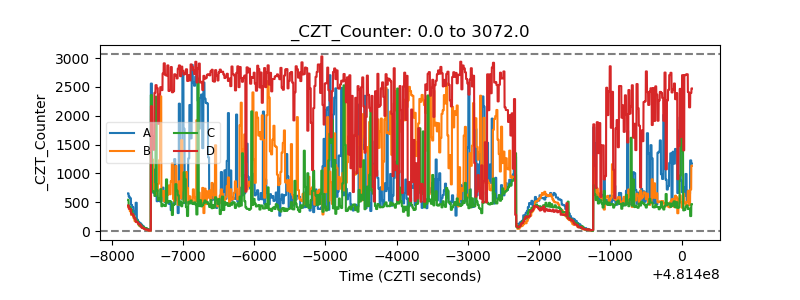 |
| +2.5 Volts monitor | 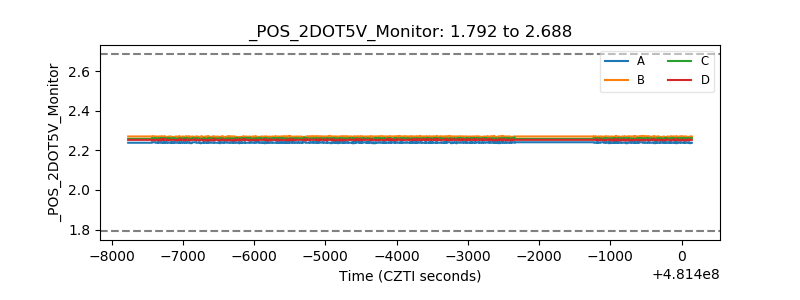 |
| +5 Volts monitor | 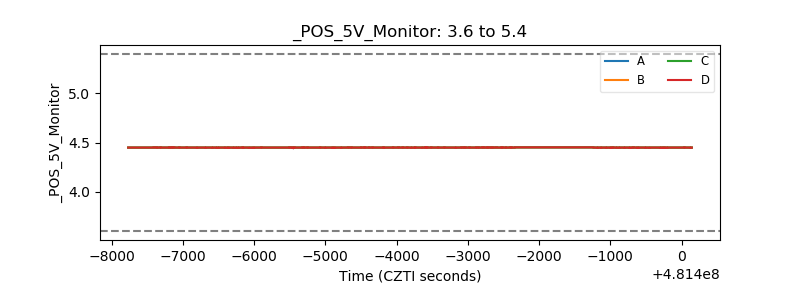 |
| _ROLL_ROT | 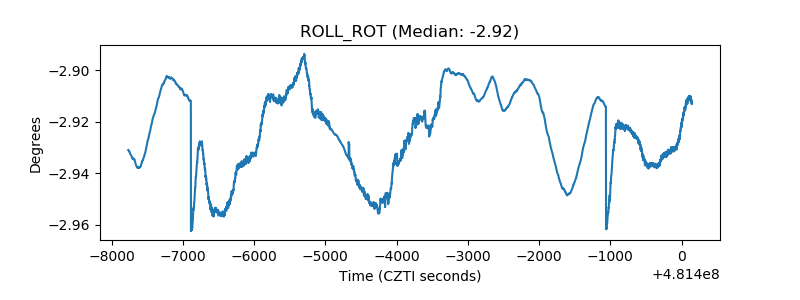 |
| _Roll_DEC | 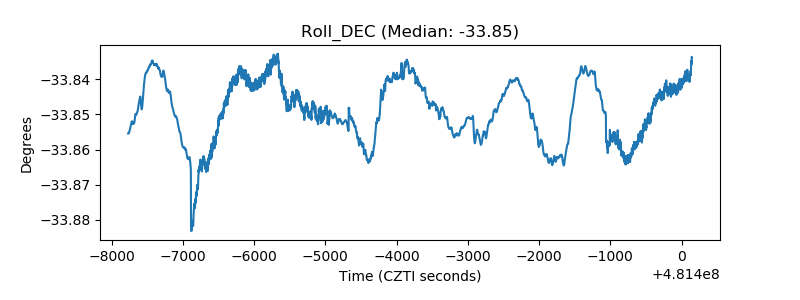 |
| _Roll_RA | 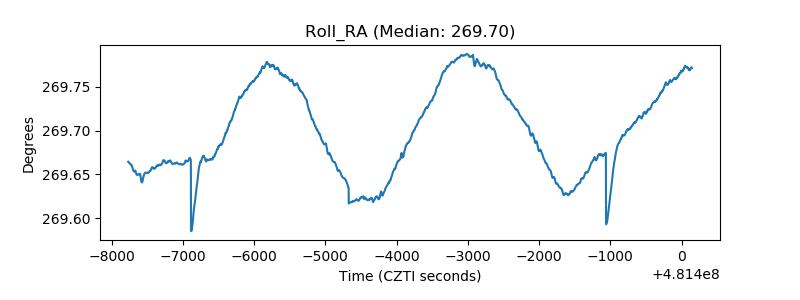 |
| Veto Counter | 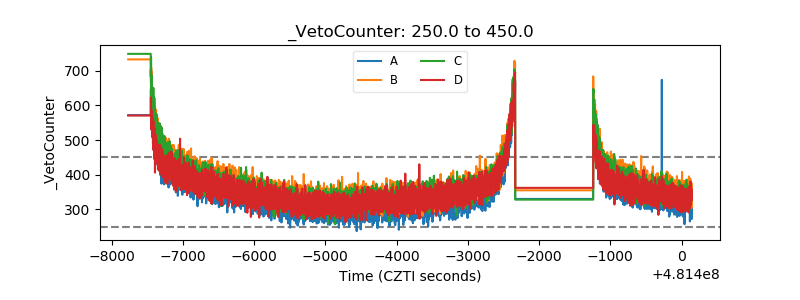 |