| Param | Original file | Final file |
|---|---|---|
| Filename | modeM0/AS1A13_090T01_9000006458_51468cztM0_level2.fits | modeM0/AS1A13_090T01_9000006458_51468cztM0_level2_quad_clean.evt |
| Size (bytes) | 656,879,040 | 89,637,120 |
| Size | 626.4 MB | 85.5 MB |
| Events in quadrant A | 5,685,753 | 613,374 |
| Events in quadrant B | 5,201,668 | 651,179 |
| Events in quadrant C | 3,208,826 | 606,345 |
| Events in quadrant D | 9,711,248 | 385,440 |
| Mode M0 | |||
|---|---|---|---|
| Quadrant | BADHDUFLAG | Total packets | Discarded packets |
| A | 0 | 21449 | 1 |
| B | 0 | 19873 | 1 |
| C | 0 | 14337 | 1 |
| D | 0 | 33419 | 1 |
| Mode M9 | |||
|---|---|---|---|
| Quadrant | BADHDUFLAG | Total packets | Discarded packets |
| A | 0 | 10 | 0 |
| B | 0 | 10 | 0 |
| C | 0 | 10 | 0 |
| D | 0 | 10 | 0 |
| Mode SS | |||
|---|---|---|---|
| Quadrant | BADHDUFLAG | Total packets | Discarded packets |
| A | 0 | 134 | 0 |
| B | 0 | 134 | 0 |
| C | 0 | 134 | 0 |
| D | 0 | 134 | 0 |
| Quadrant | Total seconds | Saturated seconds | Saturation percentage |
|---|---|---|---|
| A | 6558 | 353 | 5.382739% |
| B | 6559 | 457 | 6.967526% |
| C | 6559 | 58 | 0.884281% |
| D | 6559 | 2361 | 35.996341% |
Noise dominated data is calculated using 1-second bins in cleaned event files. If a bin has >2000 counts, and if more than 50% of those come from <1% of pixels, then it is considered to be noise-dominated and hence unusable.
| Quadrant | # 1 sec bins | Bins with >0 counts | Bins with >2000 counts | High rate bins dominated by noise | Noise dominated (total time) | Noise dominated (detector-on time) | Marked lightcurve |
|---|---|---|---|---|---|---|---|
| A | 7508 | 6559 | 190 | 190 | 2.53% | 2.90% | 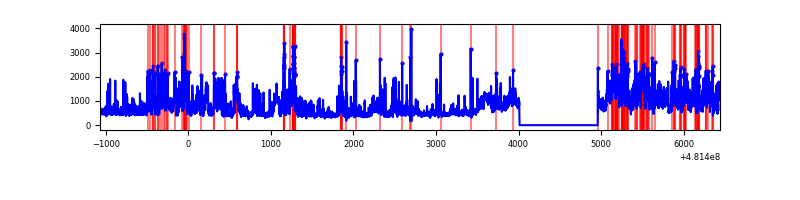 |
| B | 7509 | 6560 | 284 | 284 | 3.78% | 4.33% | 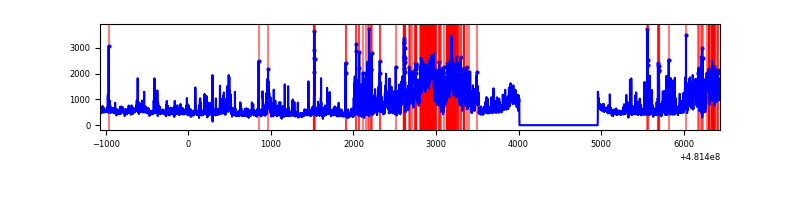 |
| C | 7509 | 6560 | 39 | 39 | 0.52% | 0.59% | 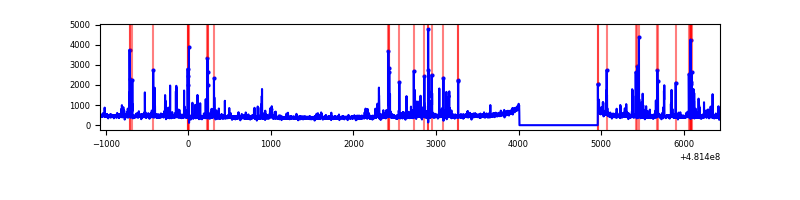 |
| D | 7508 | 6559 | 1869 | 1869 | 24.89% | 28.50% | 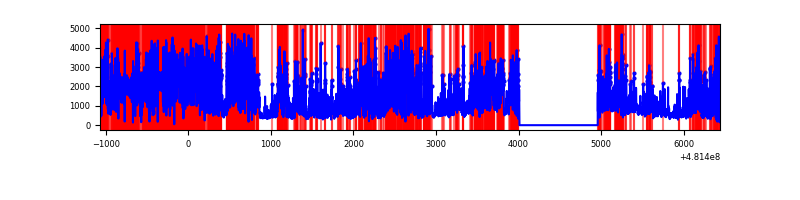 |
Top three noisy pixels from each quadrant. If the there are fewer than three noisy pixels in the level2.evt file, extra rows are filled as -1
| Pixel properties | Quadrant properties | ||||||
|---|---|---|---|---|---|---|---|
| Quadrant | DetID | PixID | Counts | Sigma | Mean | Median | Sigma |
| A | 12 | 3 | 1690522 | 9664.3 | 706 | 688 | 174.9 |
| A | 12 | 250 | 253045 | 1443.25 | 706 | 688 | 174.9 |
| A | 12 | 194 | 199865 | 1139.11 | 706 | 688 | 174.9 |
| B | 10 | 254 | 1570892 | 10429.62 | 701 | 677 | 150.6 |
| B | 0 | 213 | 200285 | 1325.83 | 701 | 677 | 150.6 |
| B | 4 | 206 | 125293 | 827.72 | 701 | 677 | 150.6 |
| C | 13 | 3 | 198224 | 1026.93 | 695 | 691 | 192.4 |
| C | 10 | 19 | 67707 | 348.4 | 695 | 691 | 192.4 |
| C | 12 | 252 | 61536 | 316.32 | 695 | 691 | 192.4 |
| D | 8 | 176 | 6582470 | 43326.55 | 545 | 526 | 151.9 |
| D | 13 | 170 | 234948 | 1543.11 | 545 | 526 | 151.9 |
| D | 12 | 218 | 232430 | 1526.54 | 545 | 526 | 151.9 |
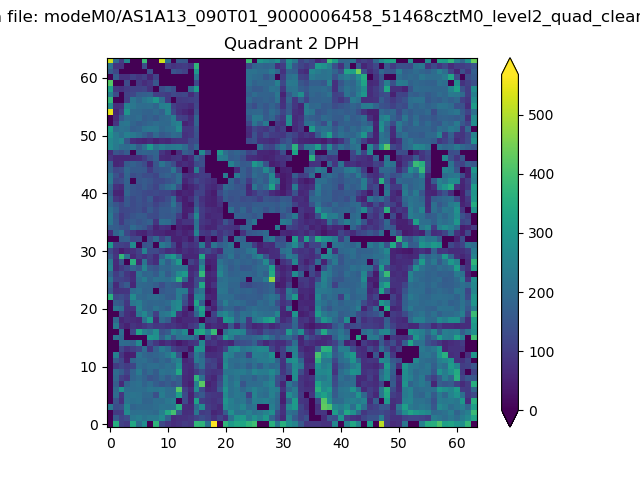
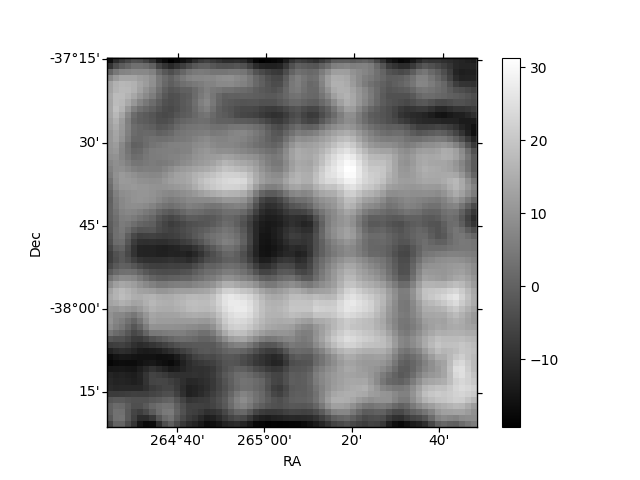
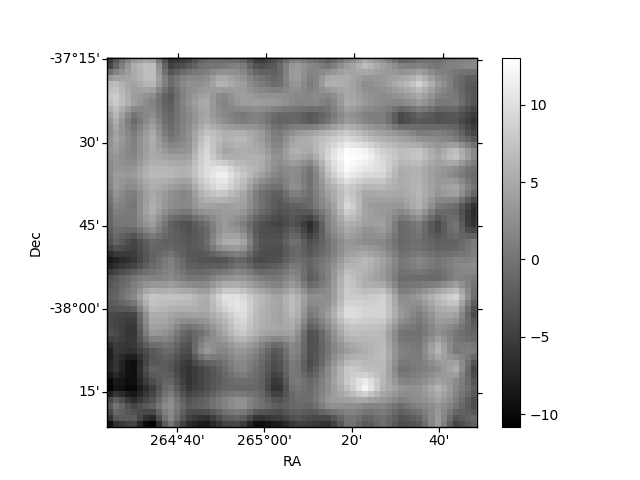
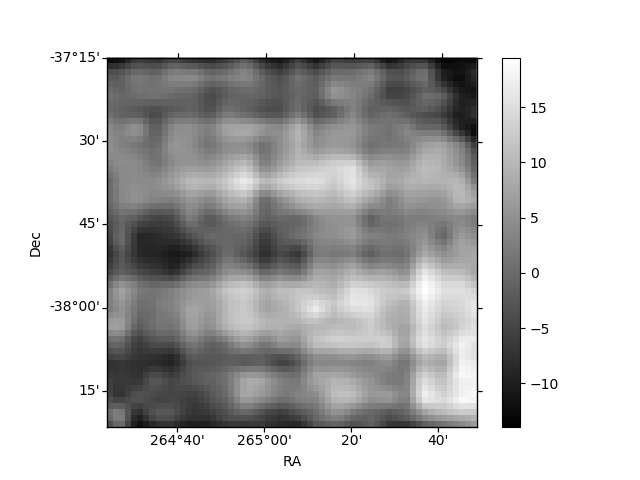
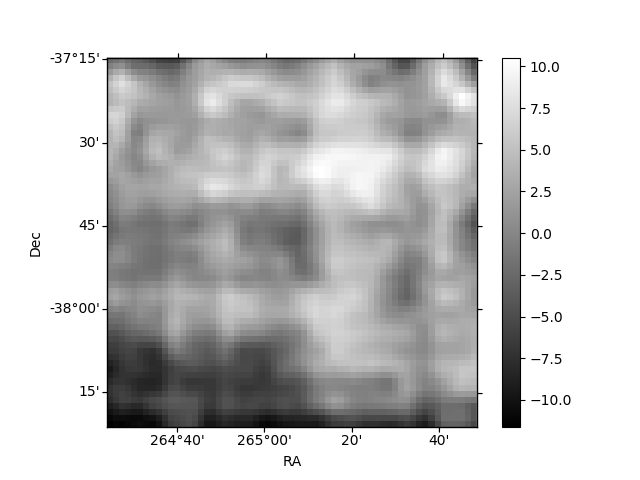
Histogram calculated using DETX and DETY for each event in the final _common_clean file
| Quadrant A | 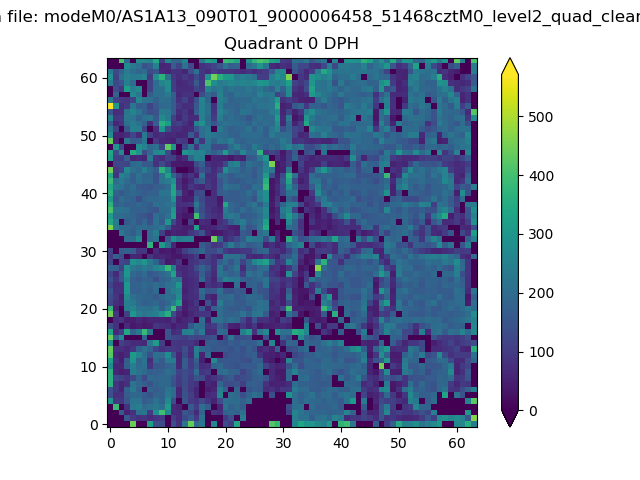 |
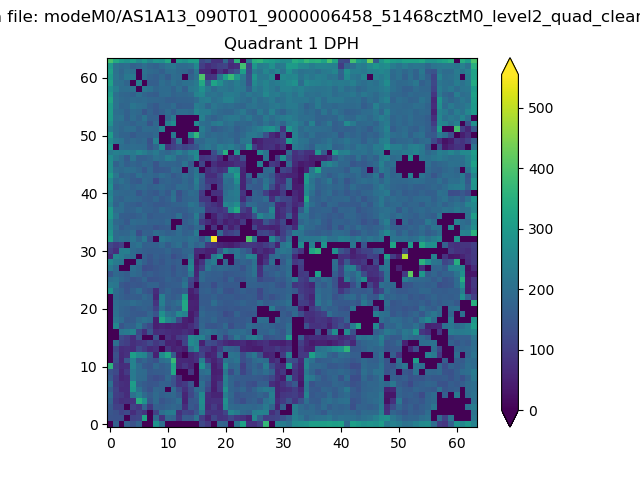 |
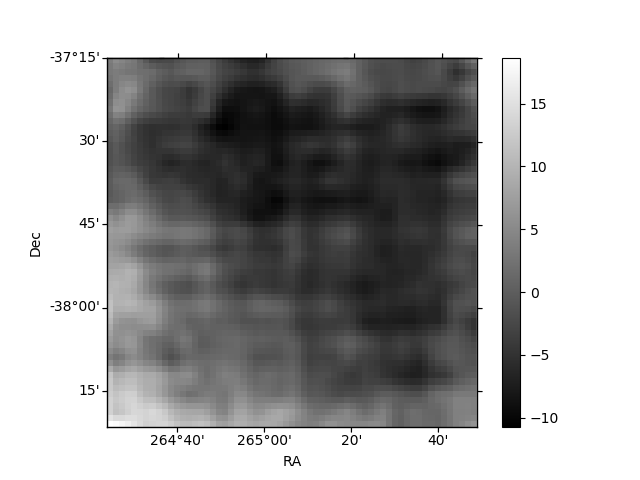
Quadrant B |
|---|---|---|---|
| Quadrant D | 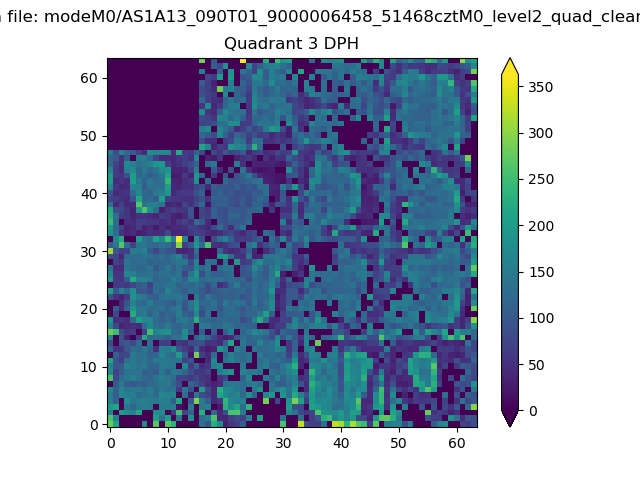 |
 |
Quadrant C |
| Plot type | Count rate plots | Images |
|---|---|---|
| Comparison with Poisson distribution Blue bars denote a histogram of data divided into 1 sec bins. Red curve is a Poisson curve with rate = median count rate of data. |
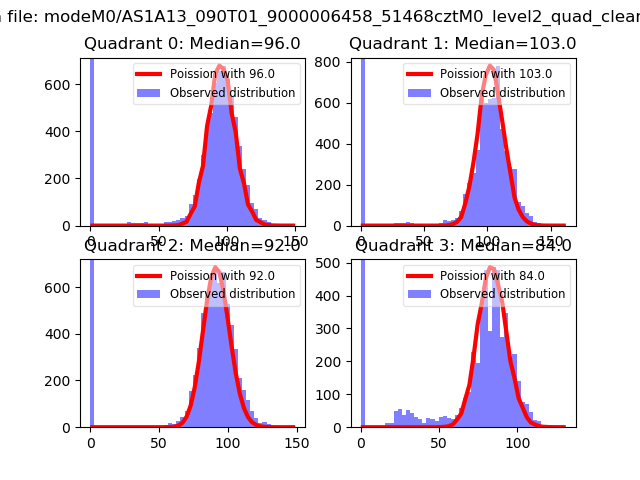 |
 |
| Quadrant-wise count rates Data is divided into 100 sec bins |
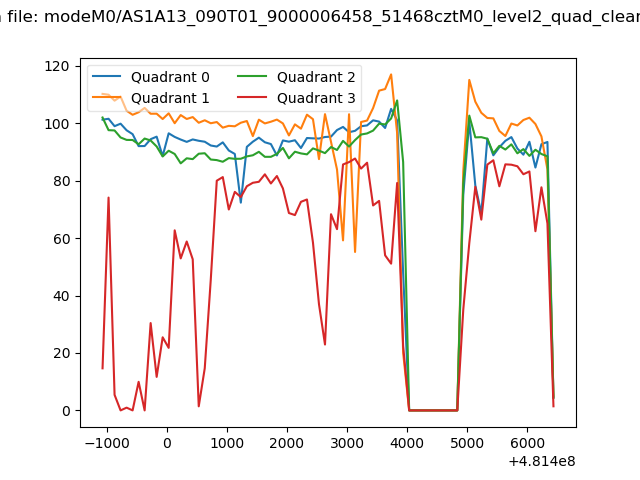 |
|
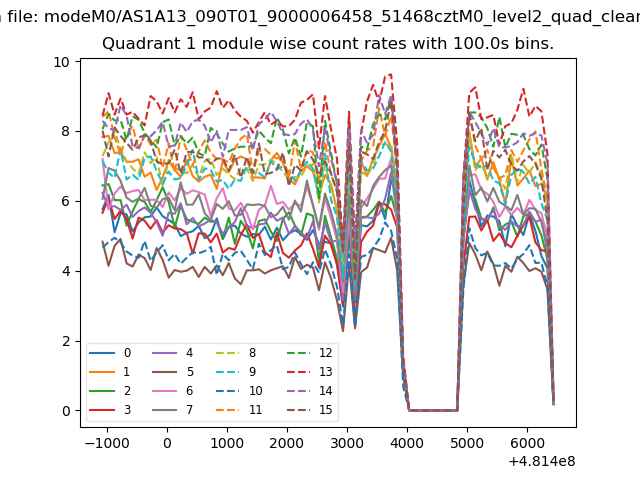
| Module-wise count rates for Quadrant A Data is divided into 100 sec bins |
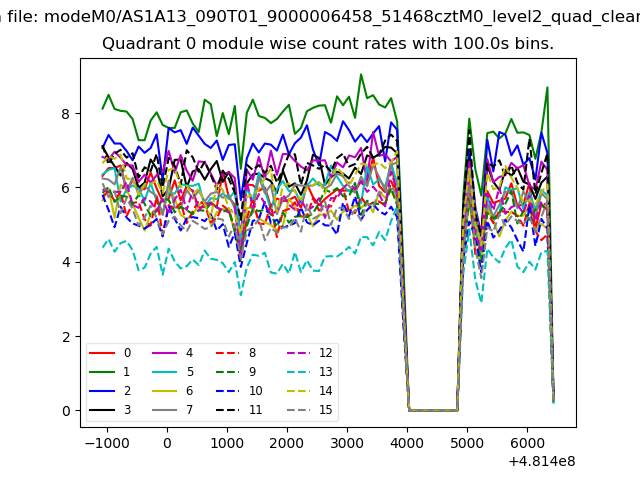 |
 |
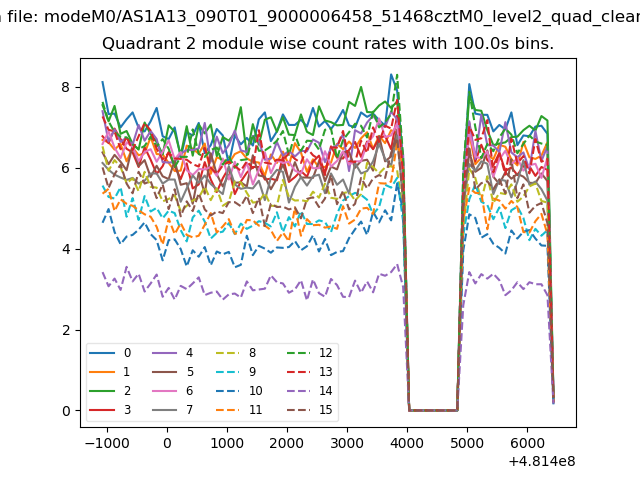
| Module-wise count rates for Quadrant B Data is divided into 100 sec bins |
 |
 |
| Module-wise count rates for Quadrant C Data is divided into 100 sec bins |
 |
 |
| Module-wise count rates for Quadrant D Data is divided into 100 sec bins |
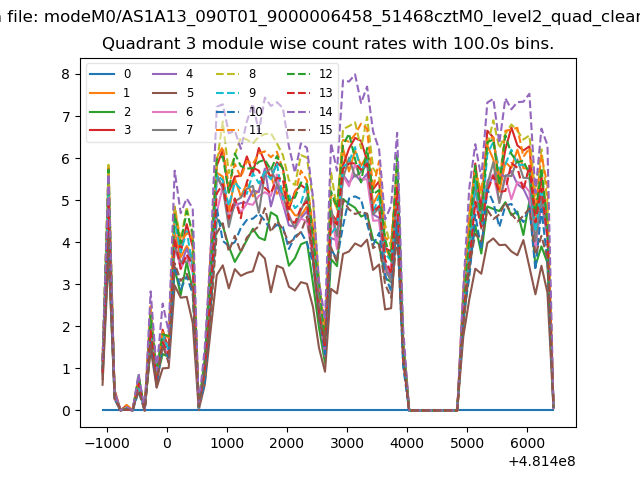 |
 |
| Parameter | Plot |
|---|---|
| CZT HV Monitor | 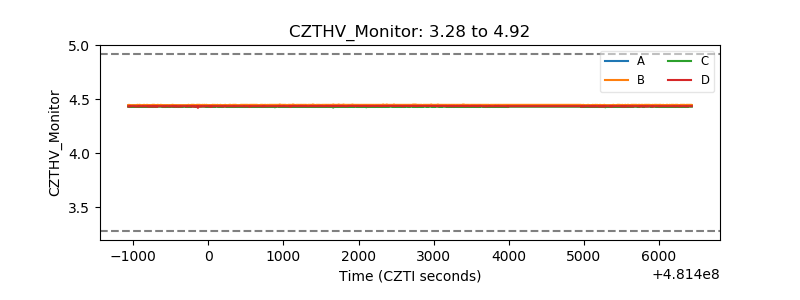 |
| D_VDD | 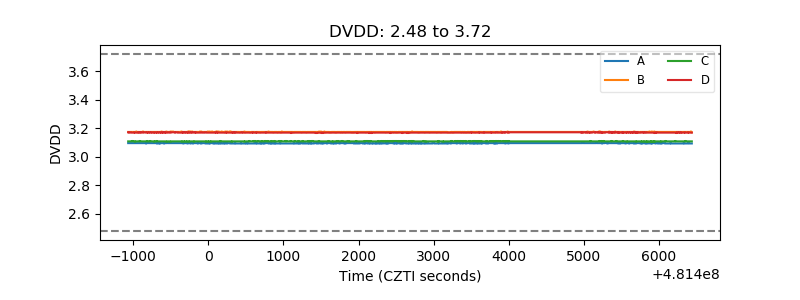 |
| Temperature 1 | 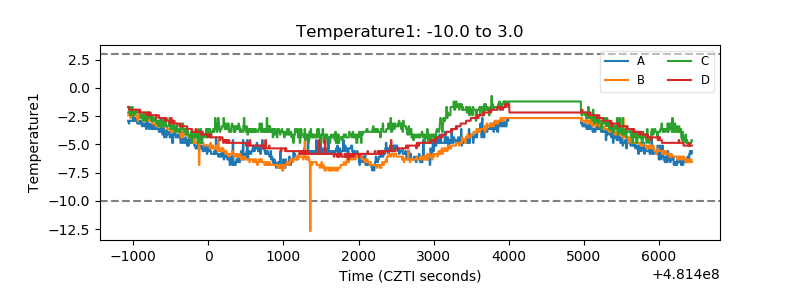 |
| Veto HV Monitor | 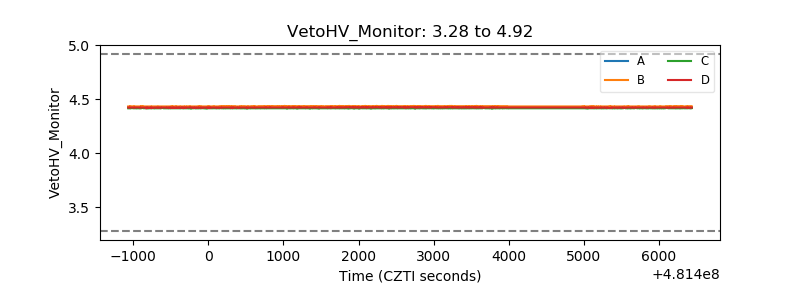 |
| Veto LLD | 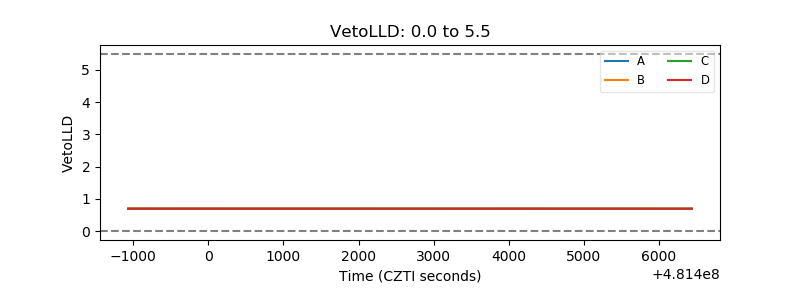 |
| Alpha Counter | 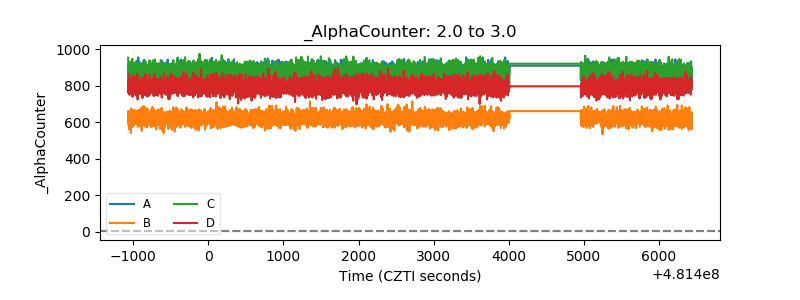 |
| _CPM_Rate | 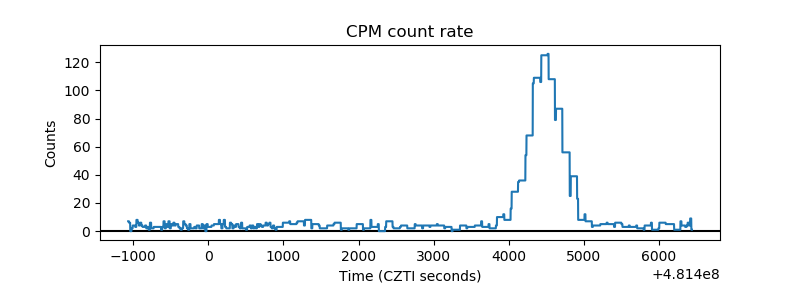 |
| CZT Counter | 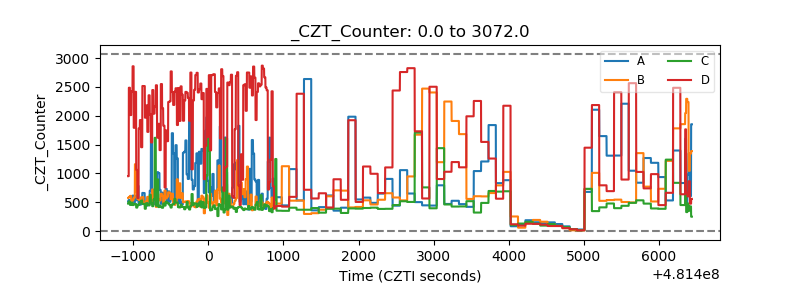 |
| +2.5 Volts monitor | 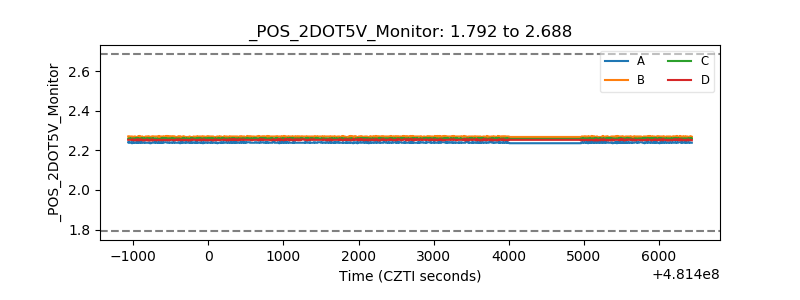 |
| +5 Volts monitor | 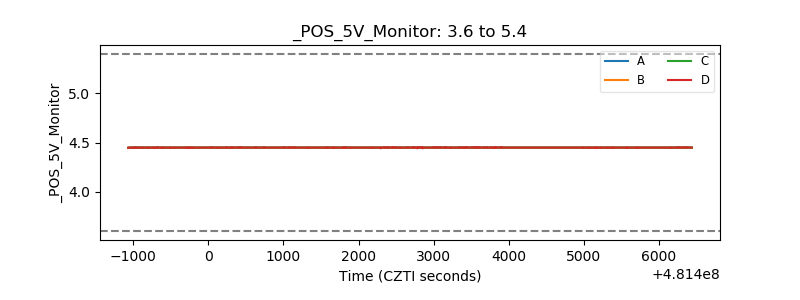 |
| _ROLL_ROT | 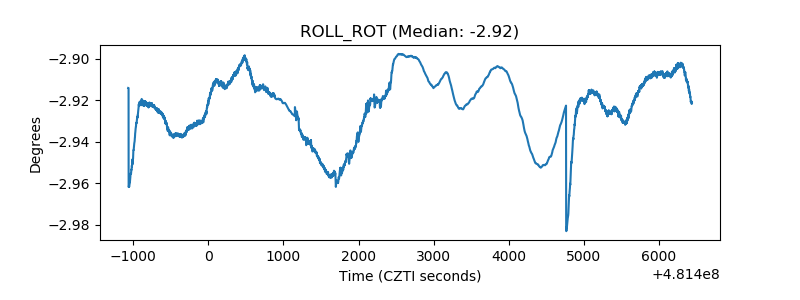 |
| _Roll_DEC | 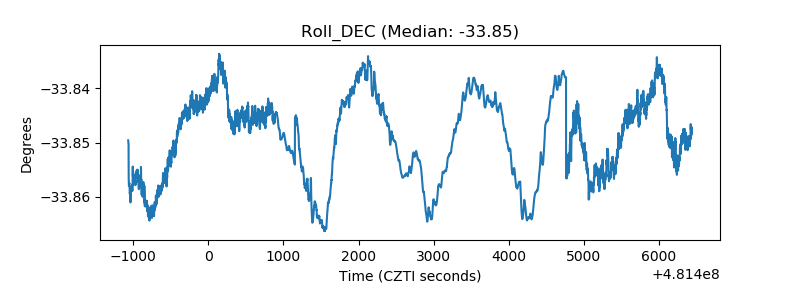 |
| _Roll_RA | 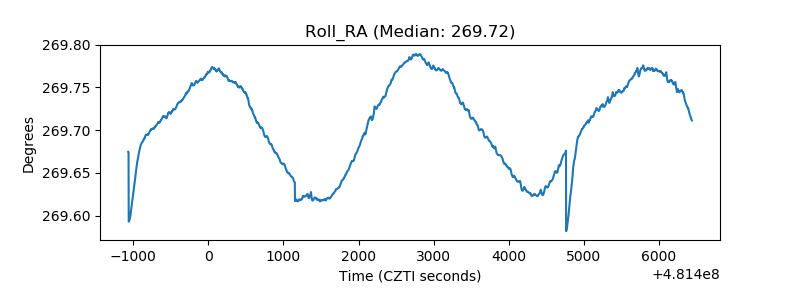 |
| Veto Counter | 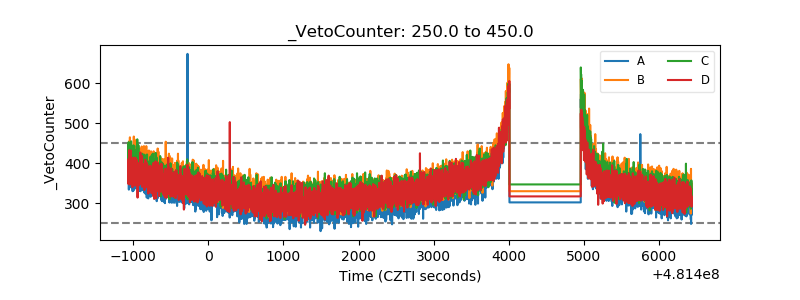 |