| Param | Original file | Final file |
|---|---|---|
| Filename | modeM0/AS1A13_090T01_9000006458_51469cztM0_level2.fits | modeM0/AS1A13_090T01_9000006458_51469cztM0_level2_quad_clean.evt |
| Size (bytes) | 665,573,760 | 99,912,960 |
| Size | 634.7 MB | 95.3 MB |
| Events in quadrant A | 7,506,665 | 639,960 |
| Events in quadrant B | 5,707,815 | 724,070 |
| Events in quadrant C | 3,611,805 | 651,162 |
| Events in quadrant D | 7,256,159 | 510,519 |
| Mode M0 | |||
|---|---|---|---|
| Quadrant | BADHDUFLAG | Total packets | Discarded packets |
| A | 0 | 27326 | 2 |
| B | 0 | 21825 | 2 |
| C | 0 | 16134 | 2 |
| D | 0 | 26615 | 2 |
| Mode M9 | |||
|---|---|---|---|
| Quadrant | BADHDUFLAG | Total packets | Discarded packets |
| A | 0 | 9 | 0 |
| B | 0 | 10 | 0 |
| C | 0 | 10 | 0 |
| D | 0 | 10 | 0 |
| Mode SS | |||
|---|---|---|---|
| Quadrant | BADHDUFLAG | Total packets | Discarded packets |
| A | 0 | 146 | 0 |
| B | 0 | 146 | 0 |
| C | 0 | 146 | 0 |
| D | 0 | 146 | 0 |
| Quadrant | Total seconds | Saturated seconds | Saturation percentage |
|---|---|---|---|
| A | 7170 | 699 | 9.748954% |
| B | 7170 | 331 | 4.616457% |
| C | 7169 | 115 | 1.604129% |
| D | 7169 | 1313 | 18.314967% |
Noise dominated data is calculated using 1-second bins in cleaned event files. If a bin has >2000 counts, and if more than 50% of those come from <1% of pixels, then it is considered to be noise-dominated and hence unusable.
| Quadrant | # 1 sec bins | Bins with >0 counts | Bins with >2000 counts | High rate bins dominated by noise | Noise dominated (total time) | Noise dominated (detector-on time) | Marked lightcurve |
|---|---|---|---|---|---|---|---|
| A | 7735 | 7171 | 417 | 417 | 5.39% | 5.82% | 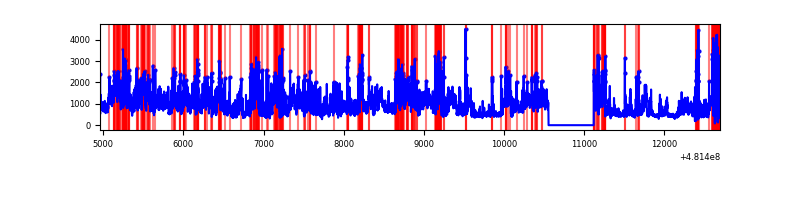 |
| B | 7735 | 7171 | 162 | 162 | 2.09% | 2.26% | 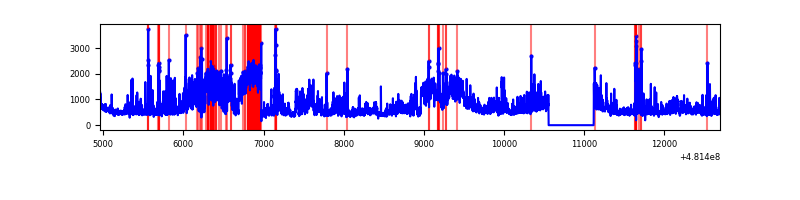 |
| C | 7734 | 7170 | 74 | 74 | 0.96% | 1.03% | 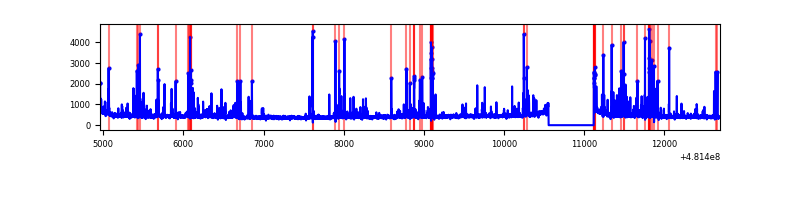 |
| D | 7734 | 7170 | 1058 | 1058 | 13.68% | 14.76% | 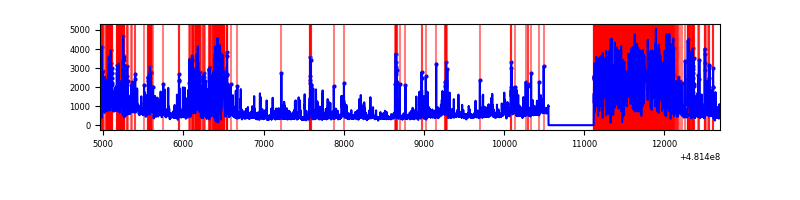 |
Top three noisy pixels from each quadrant. If the there are fewer than three noisy pixels in the level2.evt file, extra rows are filled as -1
| Pixel properties | Quadrant properties | ||||||
|---|---|---|---|---|---|---|---|
| Quadrant | DetID | PixID | Counts | Sigma | Mean | Median | Sigma |
| A | 12 | 3 | 2506734 | 13432.83 | 753 | 735 | 186.6 |
| A | 12 | 250 | 437603 | 2341.73 | 753 | 735 | 186.6 |
| A | 8 | 249 | 432879 | 2316.41 | 753 | 735 | 186.6 |
| B | 10 | 254 | 1866916 | 11434.61 | 766 | 740 | 163.2 |
| B | 4 | 206 | 220311 | 1345.38 | 766 | 740 | 163.2 |
| B | 4 | 81 | 86549 | 525.78 | 766 | 740 | 163.2 |
| C | 13 | 3 | 379778 | 1826.29 | 753 | 748 | 207.5 |
| C | 12 | 252 | 67335 | 320.84 | 753 | 748 | 207.5 |
| C | 15 | 250 | 46981 | 222.77 | 753 | 748 | 207.5 |
| D | 8 | 176 | 4058583 | 21919.97 | 657 | 635 | 185.1 |
| D | 2 | 249 | 144524 | 777.25 | 657 | 635 | 185.1 |
| D | 12 | 218 | 76063 | 407.44 | 657 | 635 | 185.1 |
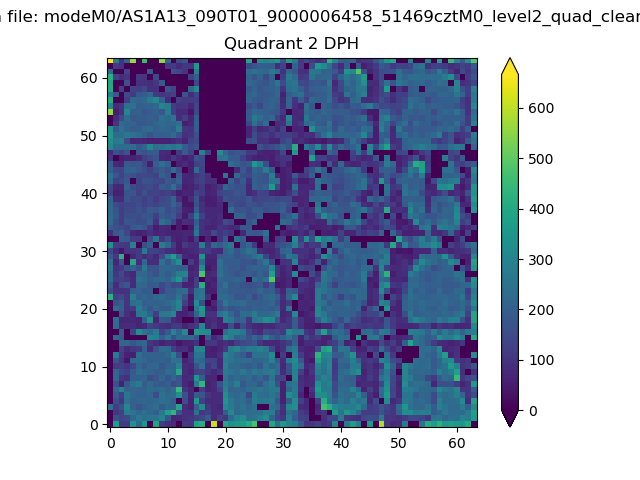
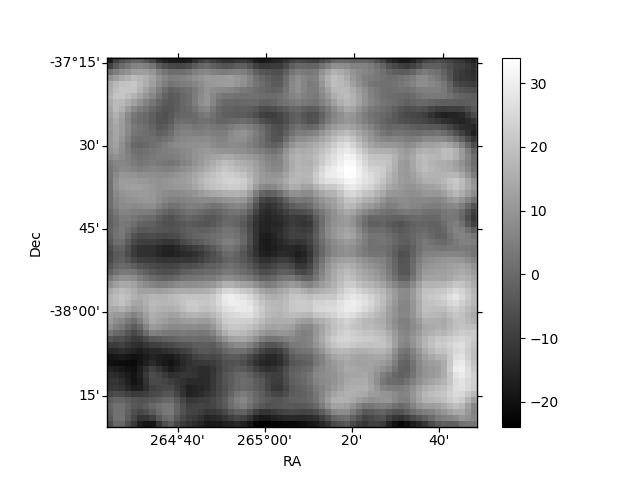
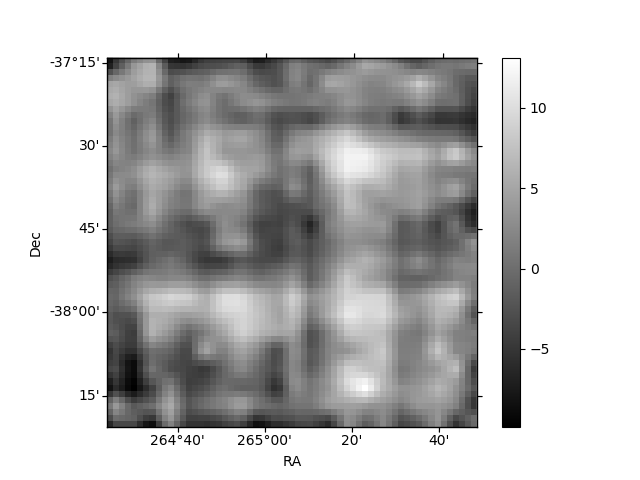
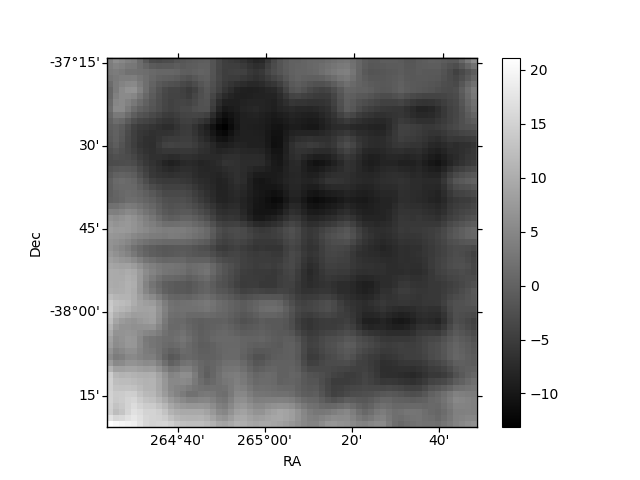
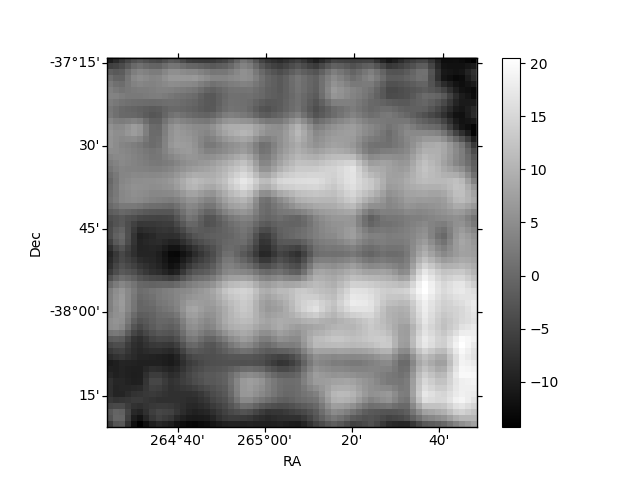
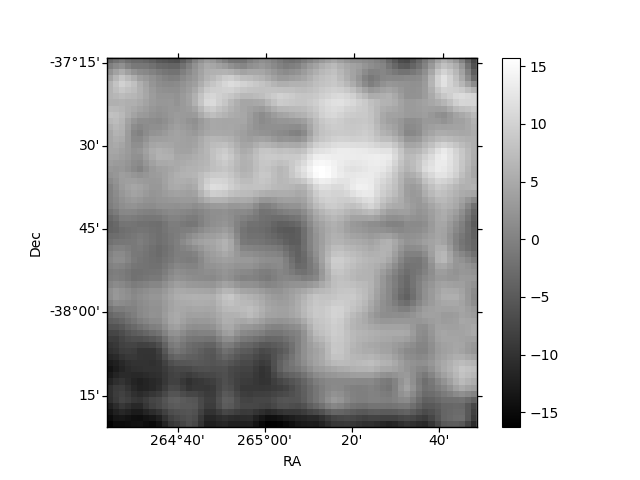
Histogram calculated using DETX and DETY for each event in the final _common_clean file
| Quadrant A | 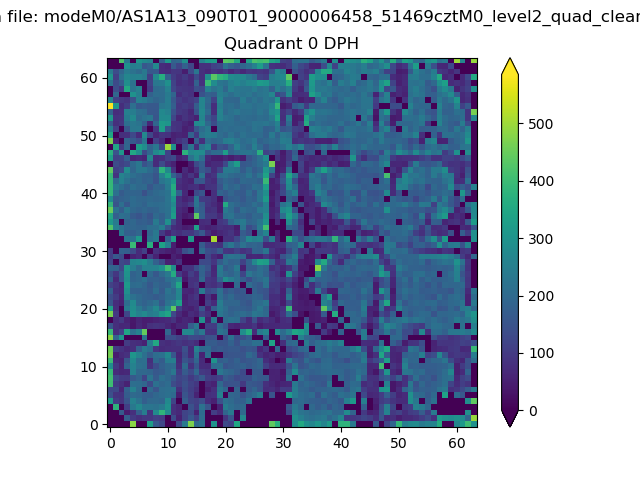 |
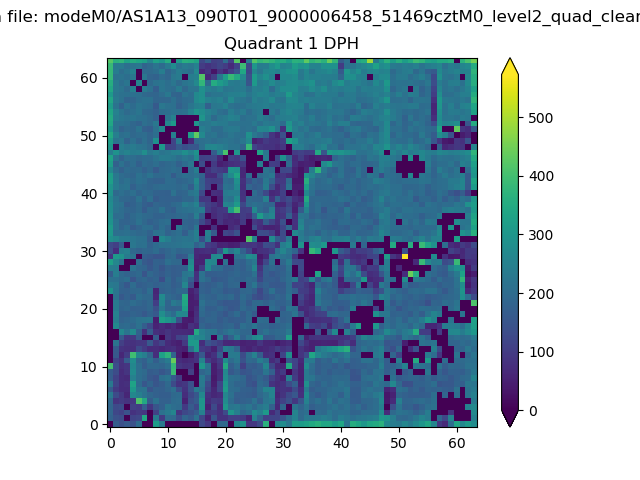 |
Quadrant B |
|---|---|---|---|
| Quadrant D | 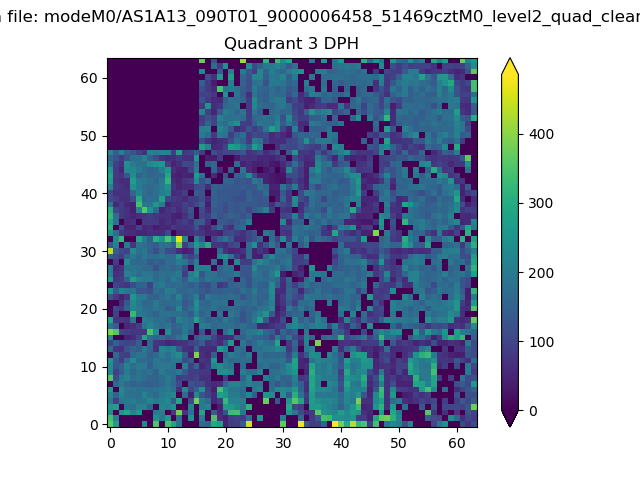 |
 |
Quadrant C |
| Plot type | Count rate plots | Images |
|---|---|---|
| Comparison with Poisson distribution Blue bars denote a histogram of data divided into 1 sec bins. Red curve is a Poisson curve with rate = median count rate of data. |
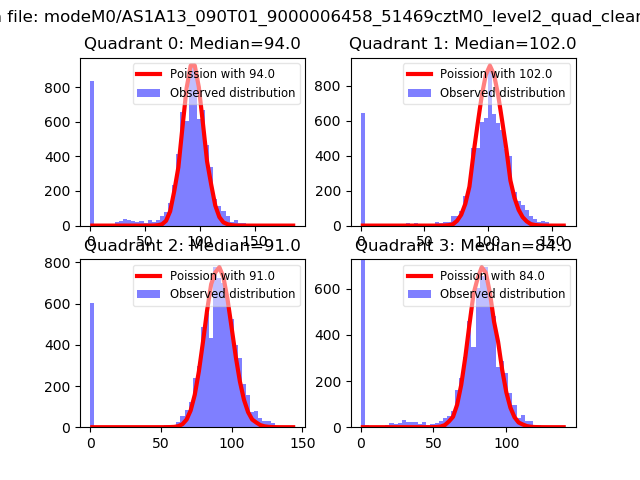 |
 |
| Quadrant-wise count rates Data is divided into 100 sec bins |
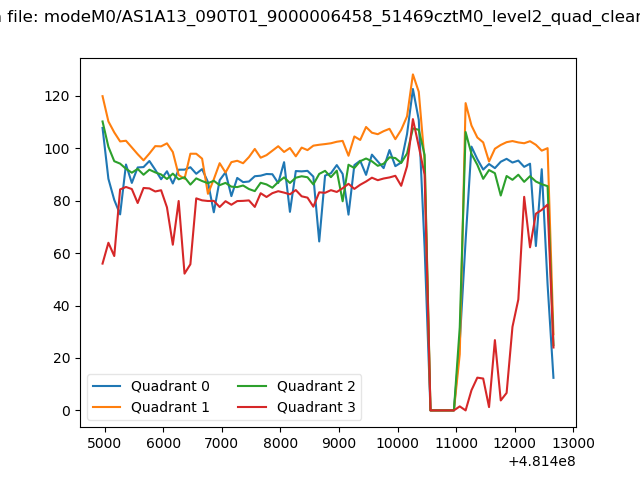 |
|
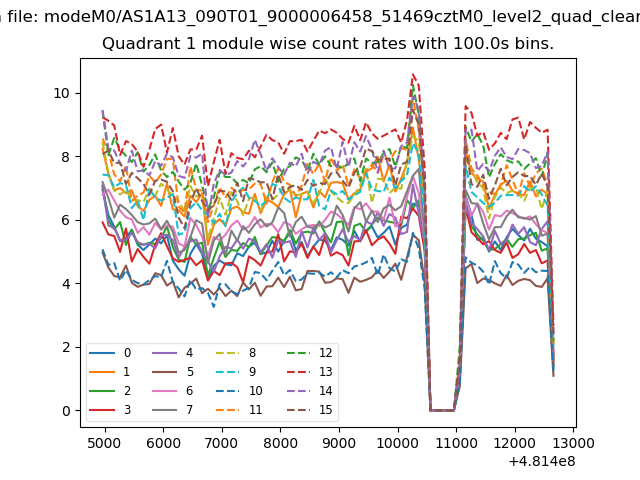
| Module-wise count rates for Quadrant A Data is divided into 100 sec bins |
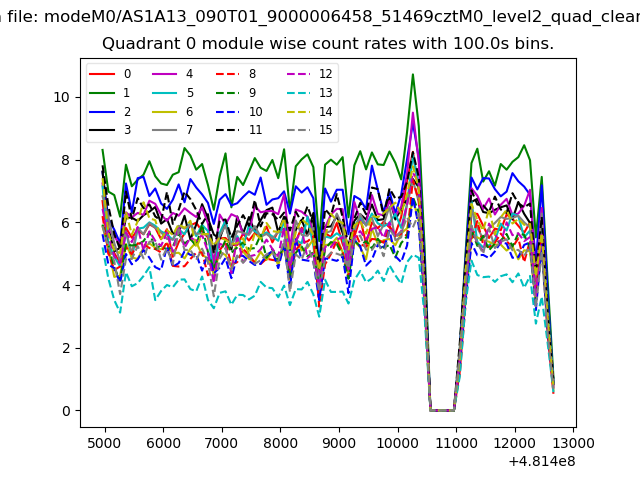 |
 |
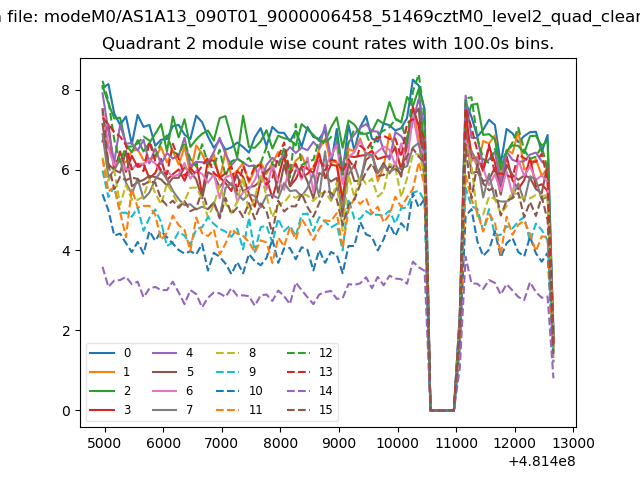
| Module-wise count rates for Quadrant B Data is divided into 100 sec bins |
 |
 |
| Module-wise count rates for Quadrant C Data is divided into 100 sec bins |
 |
 |
| Module-wise count rates for Quadrant D Data is divided into 100 sec bins |
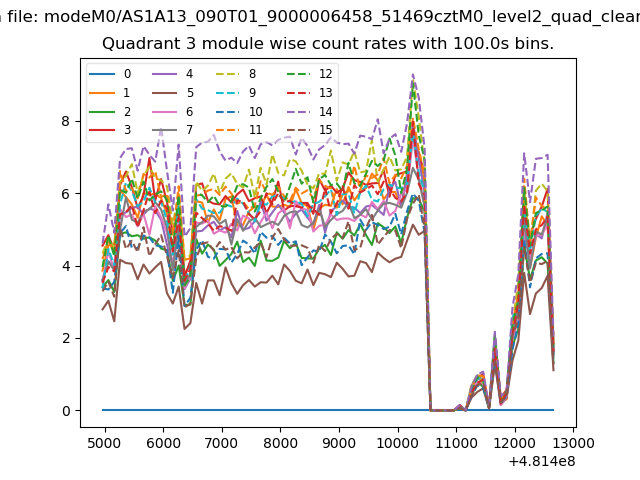 |
 |
| Parameter | Plot |
|---|---|
| CZT HV Monitor | 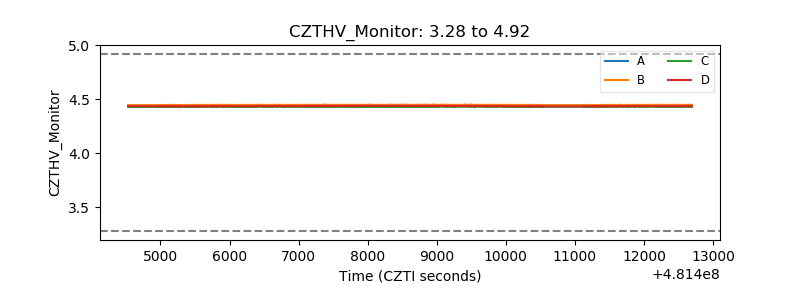 |
| D_VDD | 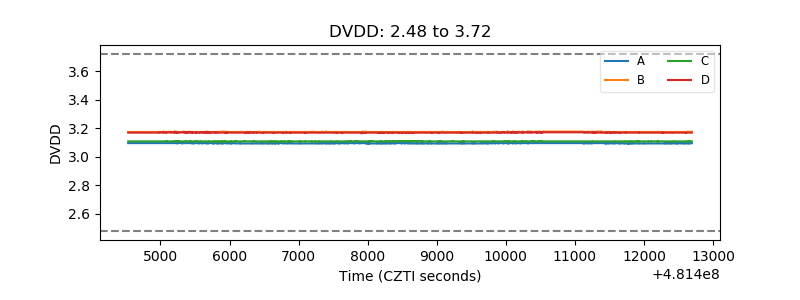 |
| Temperature 1 | 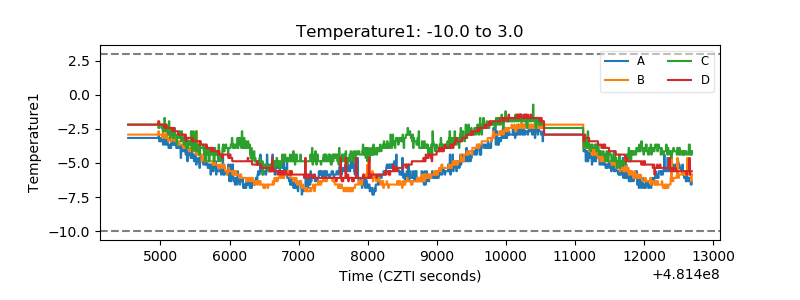 |
| Veto HV Monitor | 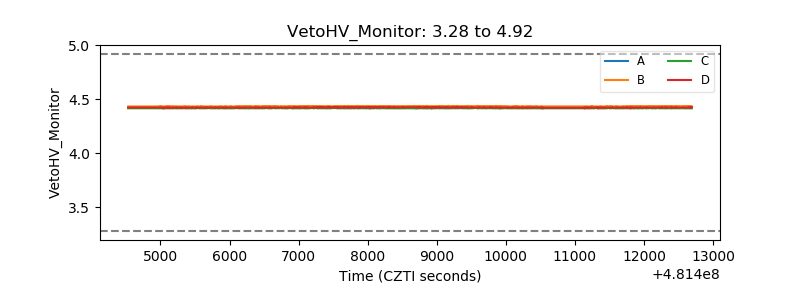 |
| Veto LLD | 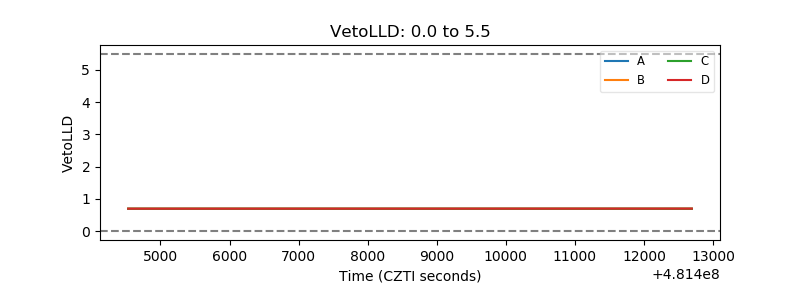 |
| Alpha Counter | 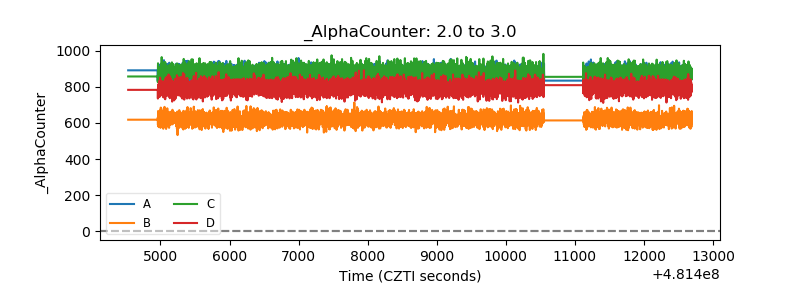 |
| _CPM_Rate | 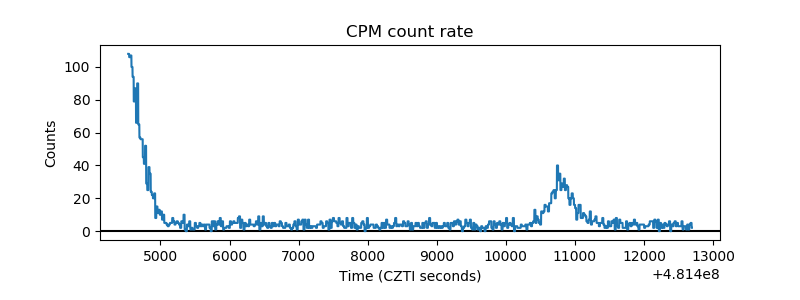 |
| CZT Counter | 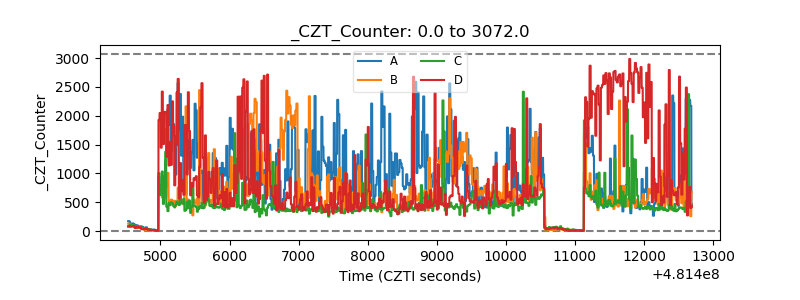 |
| +2.5 Volts monitor | 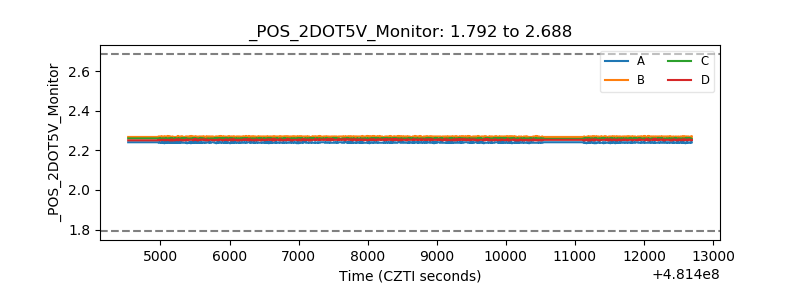 |
| +5 Volts monitor | 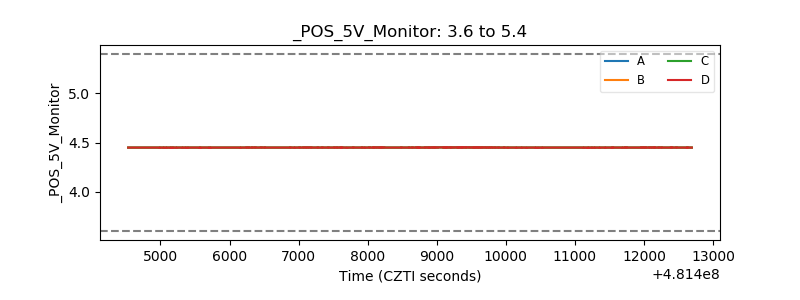 |
| _ROLL_ROT | 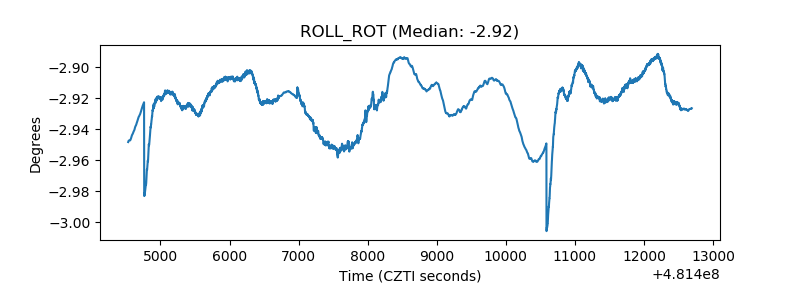 |
| _Roll_DEC | 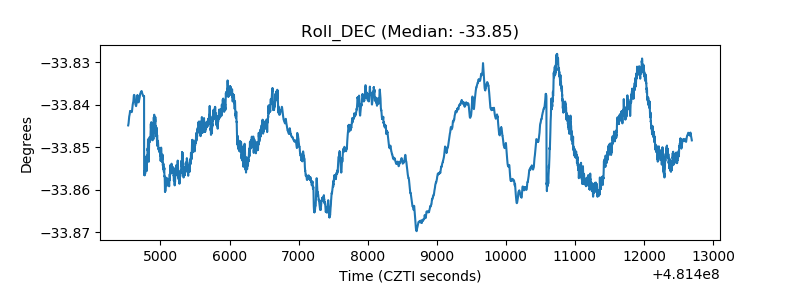 |
| _Roll_RA | 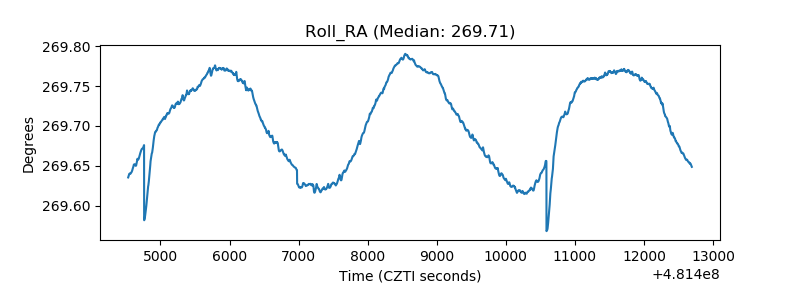 |
| Veto Counter | 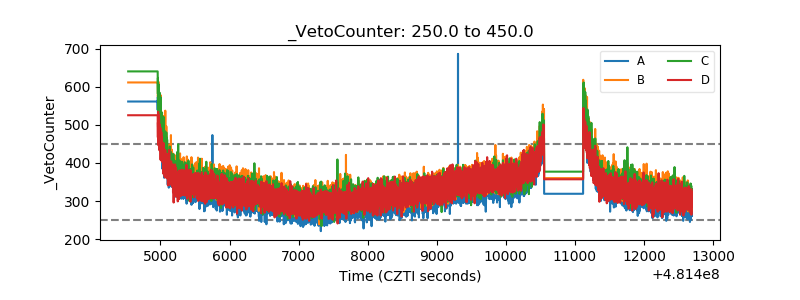 |