| Param | Original file | Final file |
|---|---|---|
| Filename | modeM0/AS1A13_090T01_9000006458_51470cztM0_level2.fits | modeM0/AS1A13_090T01_9000006458_51470cztM0_level2_quad_clean.evt |
| Size (bytes) | 782,176,320 | 102,545,280 |
| Size | 745.9 MB | 97.8 MB |
| Events in quadrant A | 6,570,665 | 691,384 |
| Events in quadrant B | 5,448,466 | 732,687 |
| Events in quadrant C | 4,053,553 | 719,706 |
| Events in quadrant D | 12,265,633 | 409,186 |
| Mode M0 | |||
|---|---|---|---|
| Quadrant | BADHDUFLAG | Total packets | Discarded packets |
| A | 0 | 25129 | 1 |
| B | 0 | 21658 | 1 |
| C | 0 | 17972 | 2 |
| D | 0 | 41922 | 1 |
| Mode M9 | |||
|---|---|---|---|
| Quadrant | BADHDUFLAG | Total packets | Discarded packets |
| A | 0 | 5 | 0 |
| B | 0 | 5 | 0 |
| C | 0 | 5 | 0 |
| D | 0 | 5 | 0 |
| Mode SS | |||
|---|---|---|---|
| Quadrant | BADHDUFLAG | Total packets | Discarded packets |
| A | 0 | 162 | 0 |
| B | 0 | 162 | 0 |
| C | 0 | 162 | 0 |
| D | 0 | 162 | 0 |
| Quadrant | Total seconds | Saturated seconds | Saturation percentage |
|---|---|---|---|
| A | 7931 | 873 | 11.007439% |
| B | 7932 | 841 | 10.602622% |
| C | 7931 | 108 | 1.361745% |
| D | 7931 | 3353 | 42.277140% |
Noise dominated data is calculated using 1-second bins in cleaned event files. If a bin has >2000 counts, and if more than 50% of those come from <1% of pixels, then it is considered to be noise-dominated and hence unusable.
| Quadrant | # 1 sec bins | Bins with >0 counts | Bins with >2000 counts | High rate bins dominated by noise | Noise dominated (total time) | Noise dominated (detector-on time) | Marked lightcurve |
|---|---|---|---|---|---|---|---|
| A | 8496 | 7932 | 432 | 432 | 5.08% | 5.45% | 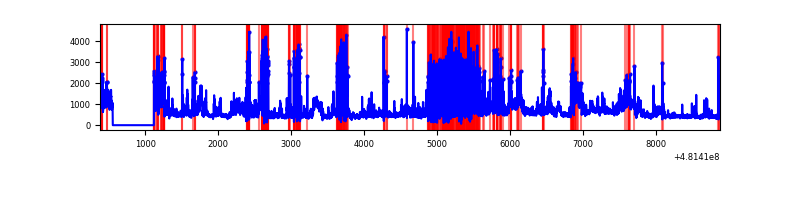 |
| B | 8497 | 7933 | 242 | 242 | 2.85% | 3.05% | 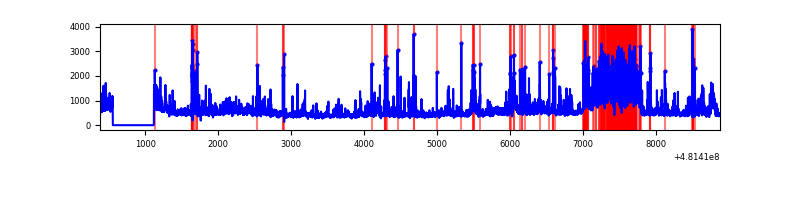 |
| C | 8496 | 7932 | 66 | 66 | 0.78% | 0.83% | 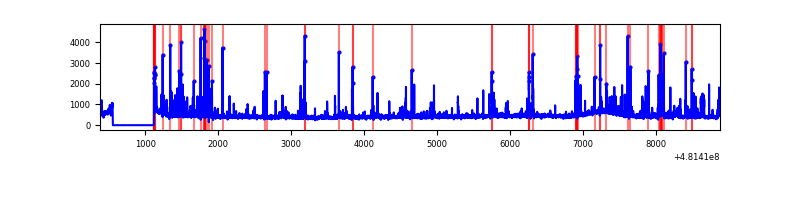 |
| D | 8496 | 7932 | 2763 | 2763 | 32.52% | 34.83% | 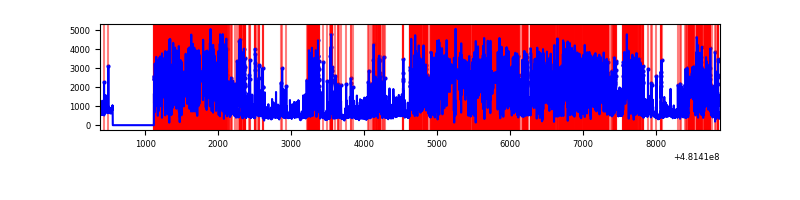 |
Top three noisy pixels from each quadrant. If the there are fewer than three noisy pixels in the level2.evt file, extra rows are filled as -1
| Pixel properties | Quadrant properties | ||||||
|---|---|---|---|---|---|---|---|
| Quadrant | DetID | PixID | Counts | Sigma | Mean | Median | Sigma |
| A | 12 | 3 | 924465 | 4541.23 | 832 | 811 | 203.4 |
| A | 8 | 63 | 420154 | 2061.74 | 832 | 811 | 203.4 |
| A | 8 | 47 | 410315 | 2013.37 | 832 | 811 | 203.4 |
| B | 12 | 32 | 967992 | 5437.87 | 825 | 796 | 177.9 |
| B | 4 | 206 | 296937 | 1665.0 | 825 | 796 | 177.9 |
| B | 10 | 254 | 215619 | 1207.8 | 825 | 796 | 177.9 |
| C | 13 | 3 | 378931 | 1613.61 | 851 | 845 | 234.3 |
| C | 15 | 219 | 50944 | 213.81 | 851 | 845 | 234.3 |
| C | 10 | 19 | 50348 | 211.27 | 851 | 845 | 234.3 |
| D | 8 | 176 | 9023487 | 51878.74 | 622 | 600 | 173.9 |
| D | 3 | 12 | 304110 | 1745.09 | 622 | 600 | 173.9 |
| D | 6 | 42 | 87795 | 501.34 | 622 | 600 | 173.9 |
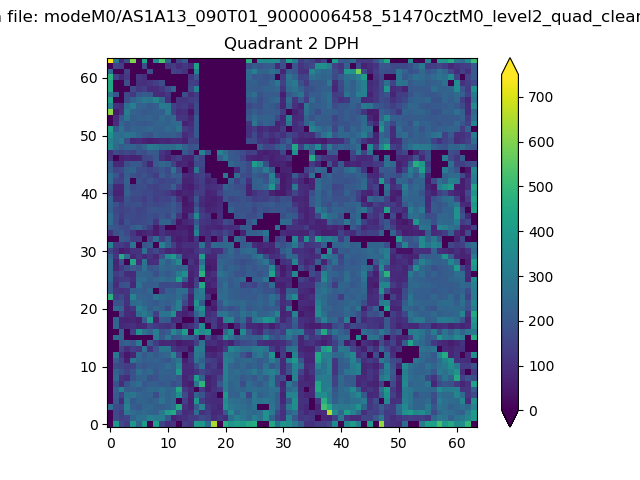
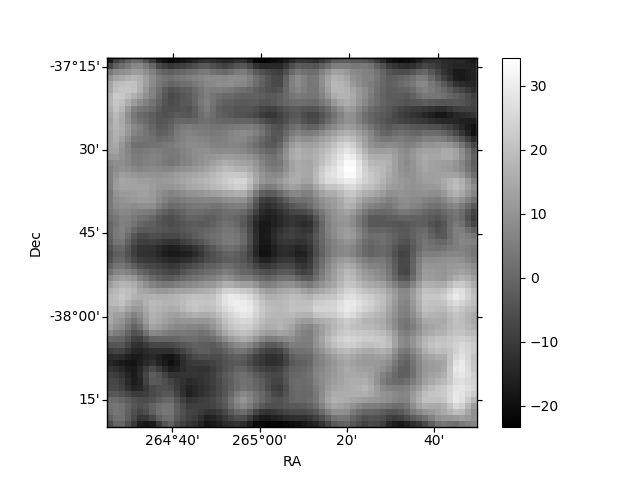
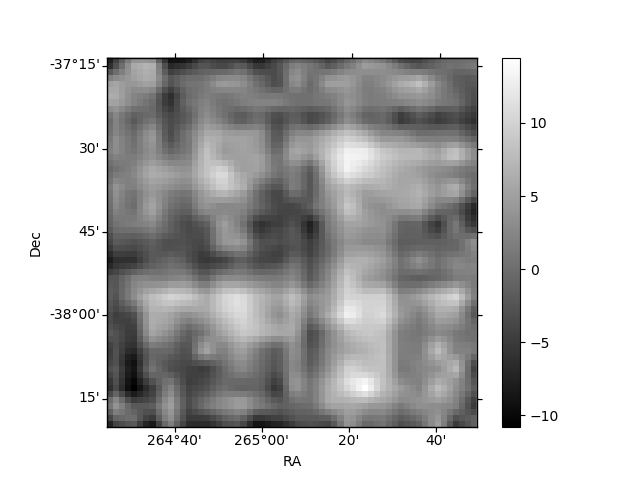
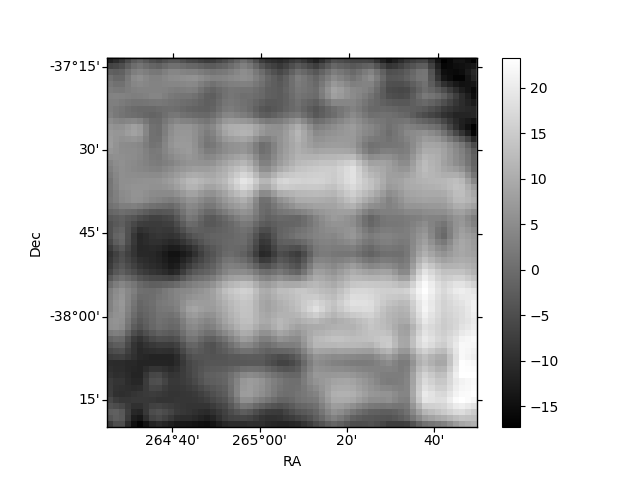
Histogram calculated using DETX and DETY for each event in the final _common_clean file
| Quadrant A | 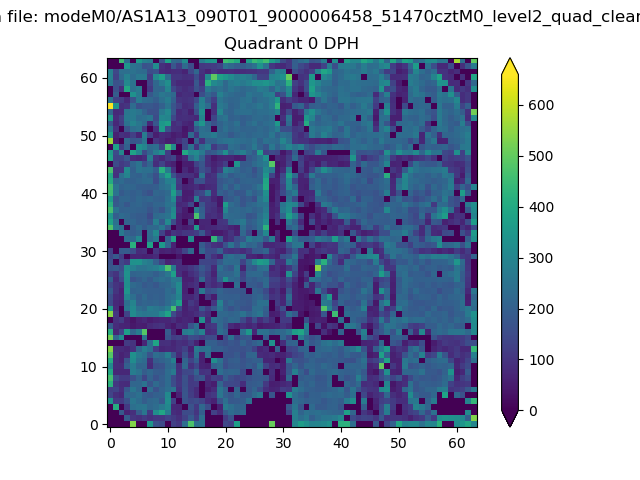 |
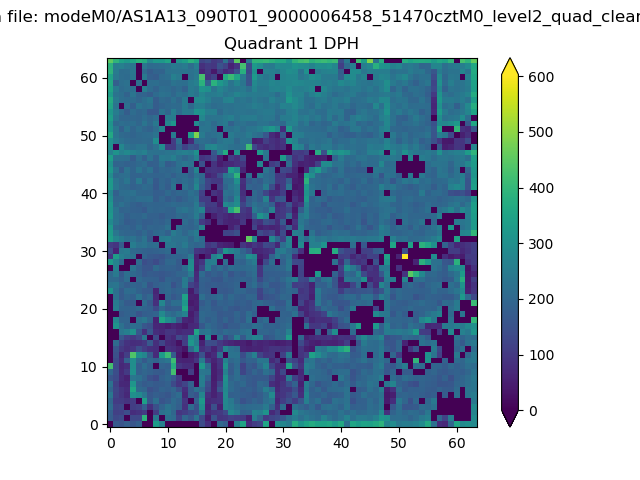 |
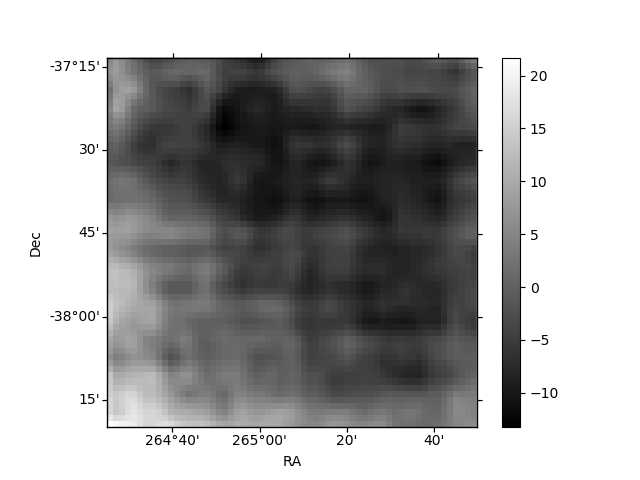
Quadrant B |
|---|---|---|---|
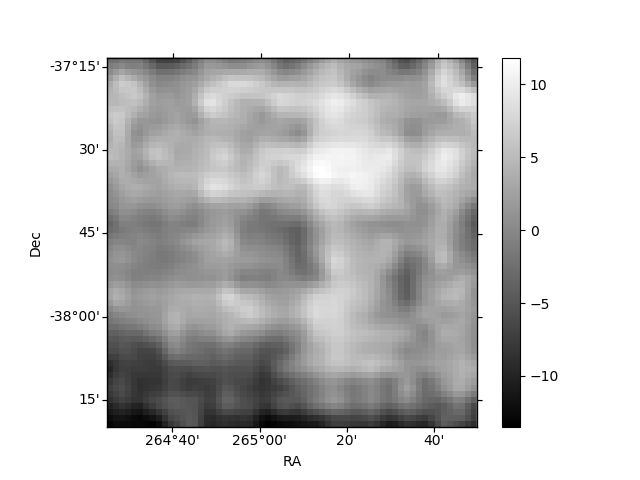
| Quadrant D | 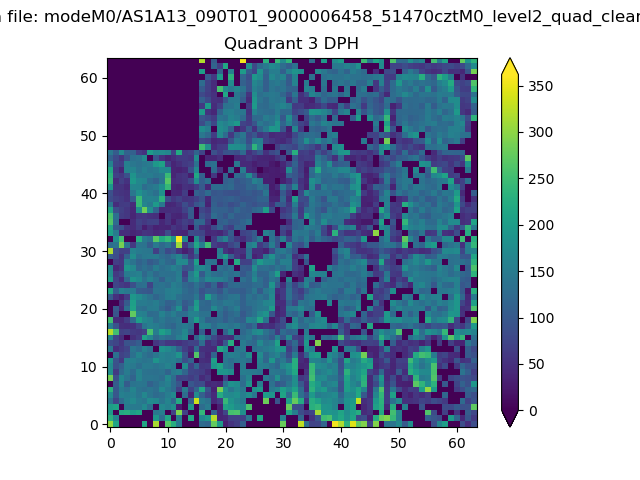 |
 |
Quadrant C |
| Plot type | Count rate plots | Images |
|---|---|---|
| Comparison with Poisson distribution Blue bars denote a histogram of data divided into 1 sec bins. Red curve is a Poisson curve with rate = median count rate of data. |
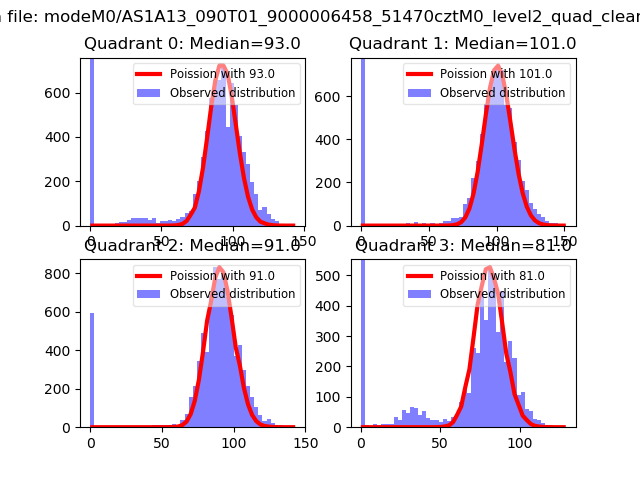 |
 |
| Quadrant-wise count rates Data is divided into 100 sec bins |
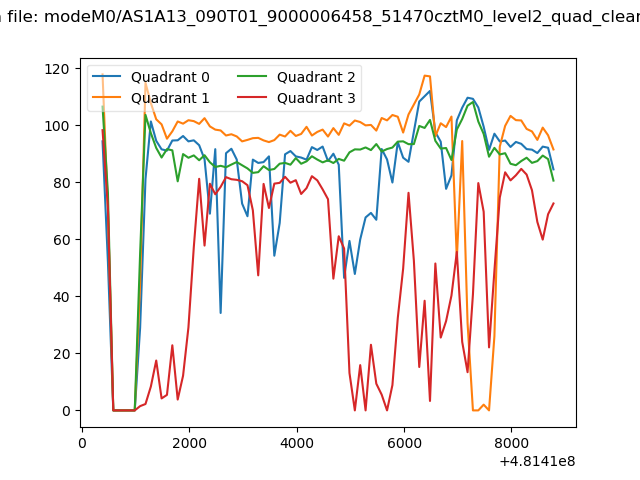 |
|
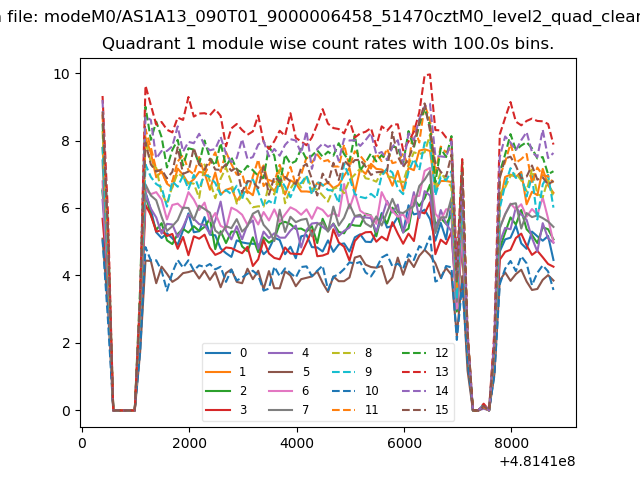
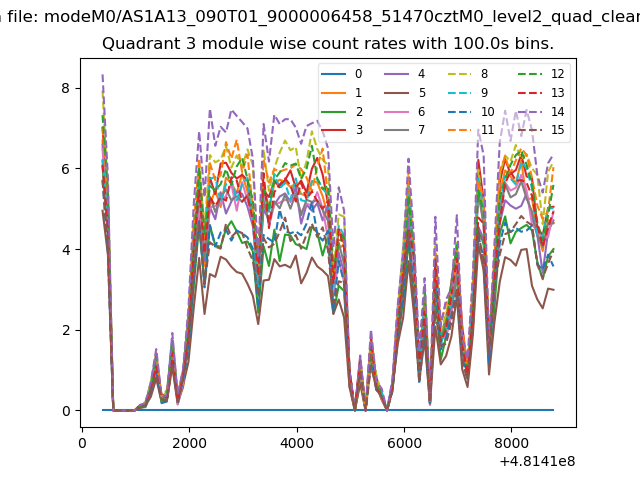
| Module-wise count rates for Quadrant A Data is divided into 100 sec bins |
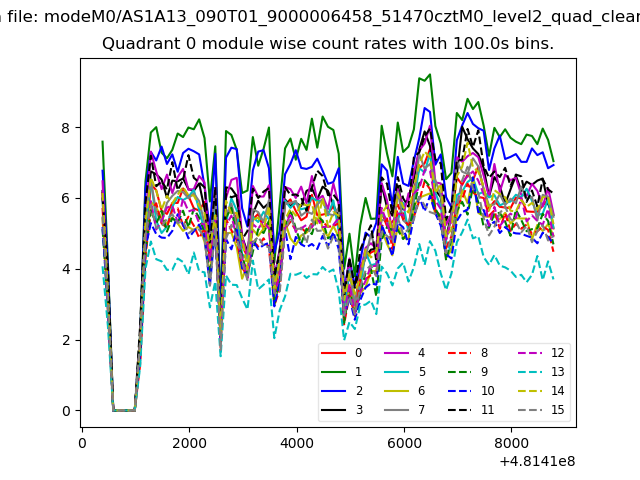 |
 |
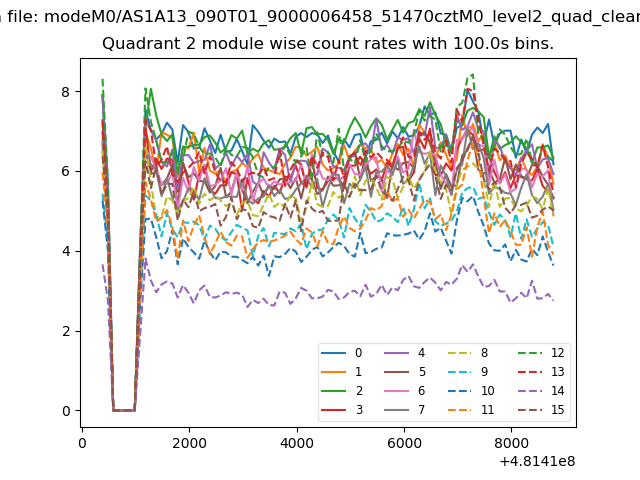
| Module-wise count rates for Quadrant B Data is divided into 100 sec bins |
 |
 |
| Module-wise count rates for Quadrant C Data is divided into 100 sec bins |
 |
 |
| Module-wise count rates for Quadrant D Data is divided into 100 sec bins |
 |
 |
| Parameter | Plot |
|---|---|
| CZT HV Monitor | 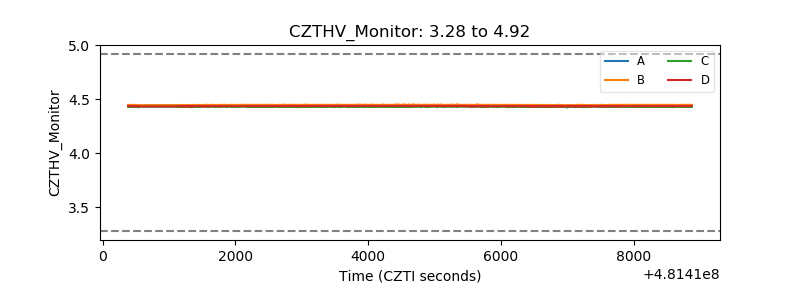 |
| D_VDD | 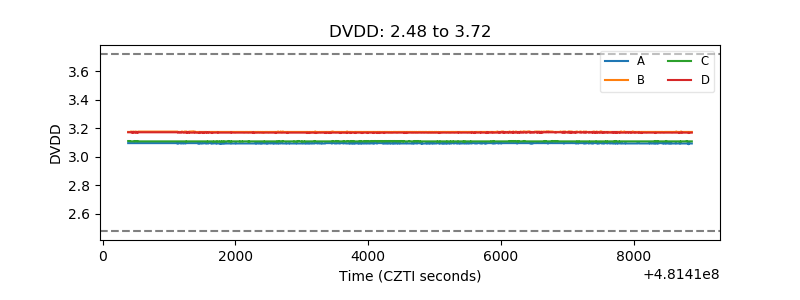 |
| Temperature 1 | 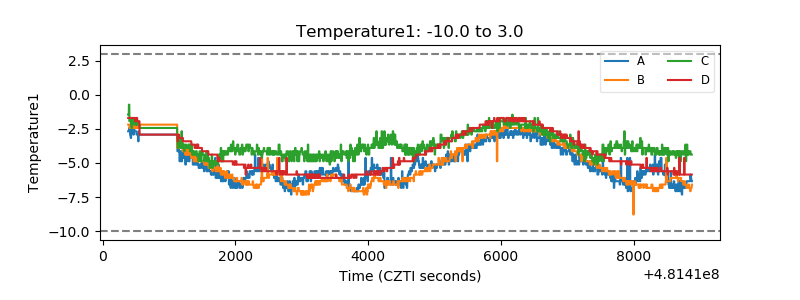 |
| Veto HV Monitor | 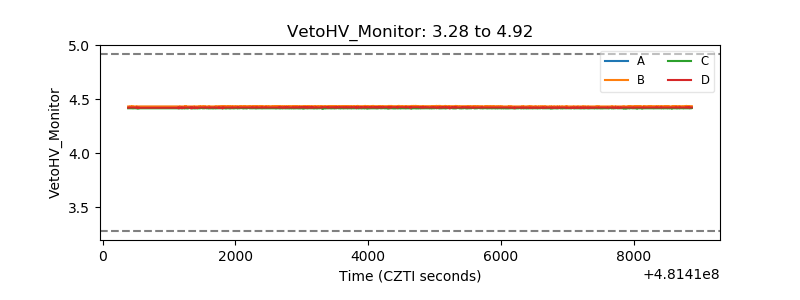 |
| Veto LLD | 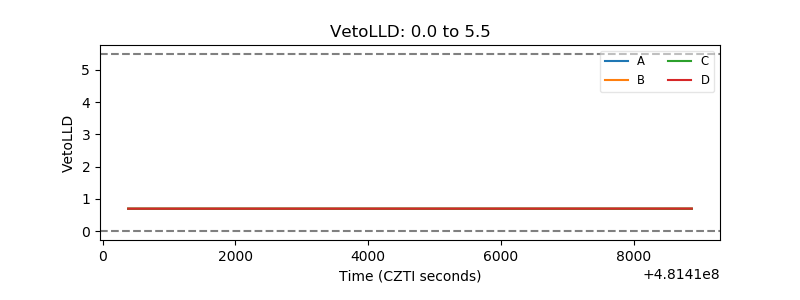 |
| Alpha Counter | 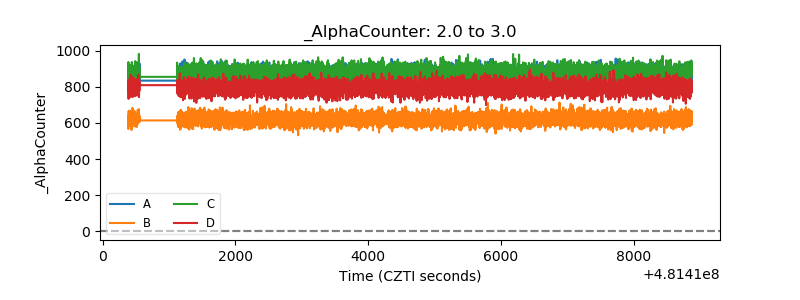 |
| _CPM_Rate | 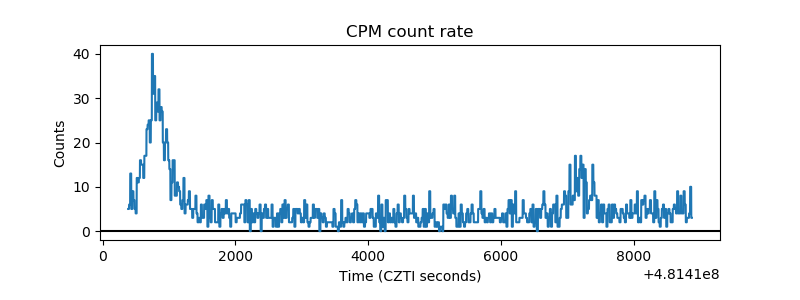 |
| CZT Counter | 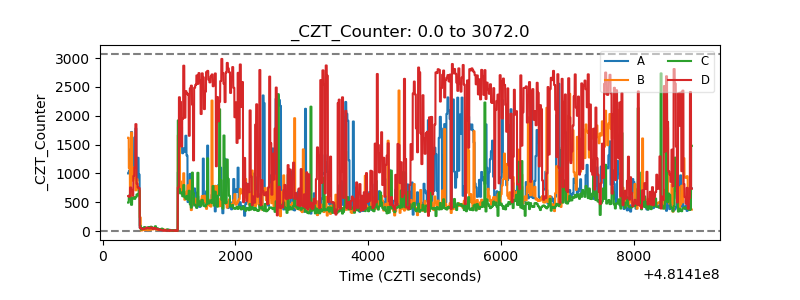 |
| +2.5 Volts monitor | 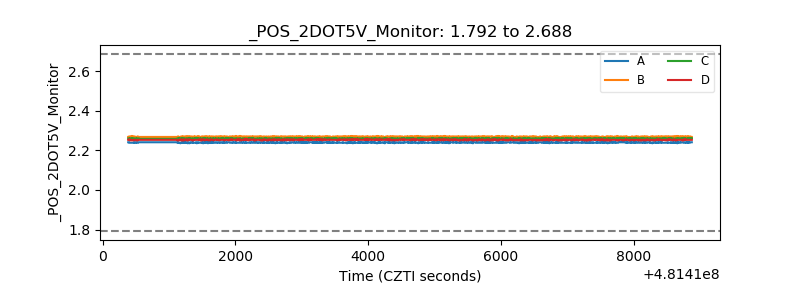 |
| +5 Volts monitor | 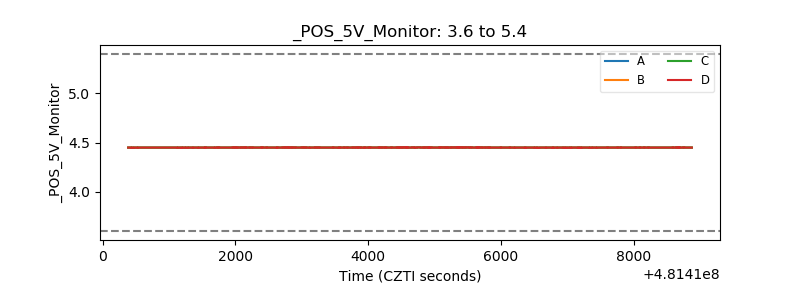 |
| _ROLL_ROT | 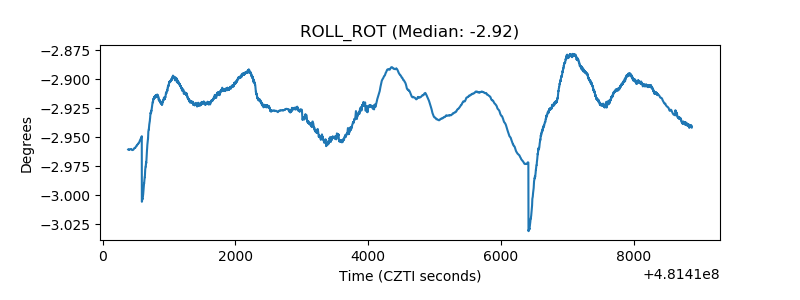 |
| _Roll_DEC | 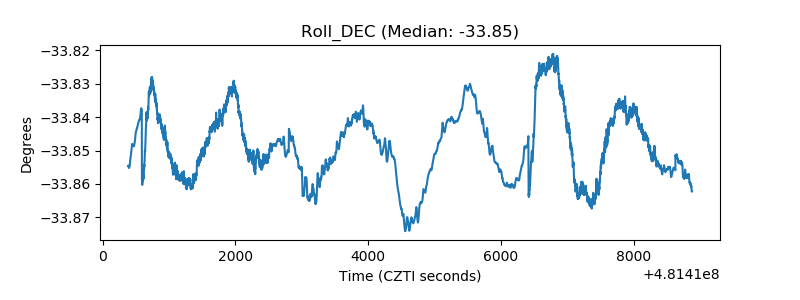 |
| _Roll_RA | 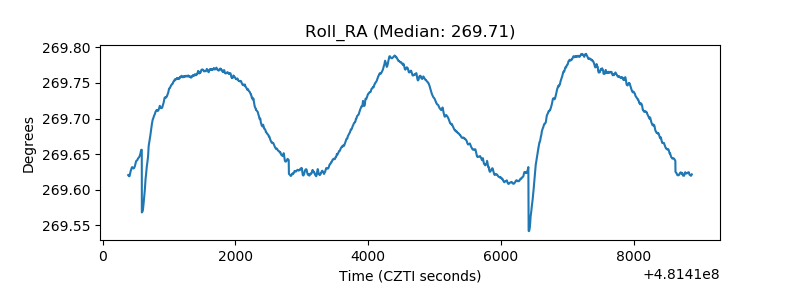 |
| Veto Counter | 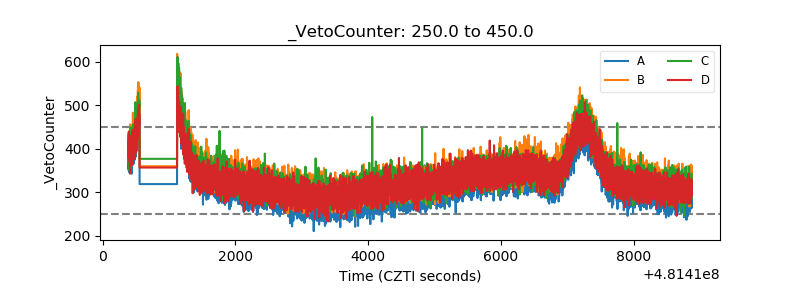 |