| Param | Original file | Final file |
|---|---|---|
| Filename | modeM0/AS1A13_090T01_9000006458_51471cztM0_level2.fits | modeM0/AS1A13_090T01_9000006458_51471cztM0_level2_quad_clean.evt |
| Size (bytes) | 800,953,920 | 108,388,800 |
| Size | 763.8 MB | 103.4 MB |
| Events in quadrant A | 6,433,586 | 728,939 |
| Events in quadrant B | 6,106,255 | 742,954 |
| Events in quadrant C | 4,407,076 | 735,034 |
| Events in quadrant D | 12,067,205 | 505,071 |
| Mode M0 | |||
|---|---|---|---|
| Quadrant | BADHDUFLAG | Total packets | Discarded packets |
| A | 0 | 24965 | 0 |
| B | 0 | 23792 | 0 |
| C | 0 | 19141 | 0 |
| D | 0 | 41554 | 0 |
| Mode SS | |||
|---|---|---|---|
| Quadrant | BADHDUFLAG | Total packets | Discarded packets |
| A | 0 | 164 | 0 |
| B | 0 | 164 | 0 |
| C | 0 | 164 | 0 |
| D | 0 | 164 | 0 |
| Quadrant | Total seconds | Saturated seconds | Saturation percentage |
|---|---|---|---|
| A | 8195 | 578 | 7.053081% |
| B | 8194 | 987 | 12.045399% |
| C | 8195 | 165 | 2.013423% |
| D | 8195 | 2611 | 31.860891% |
Noise dominated data is calculated using 1-second bins in cleaned event files. If a bin has >2000 counts, and if more than 50% of those come from <1% of pixels, then it is considered to be noise-dominated and hence unusable.
| Quadrant | # 1 sec bins | Bins with >0 counts | Bins with >2000 counts | High rate bins dominated by noise | Noise dominated (total time) | Noise dominated (detector-on time) | Marked lightcurve |
|---|---|---|---|---|---|---|---|
| A | 8195 | 8195 | 313 | 313 | 3.82% | 3.82% | 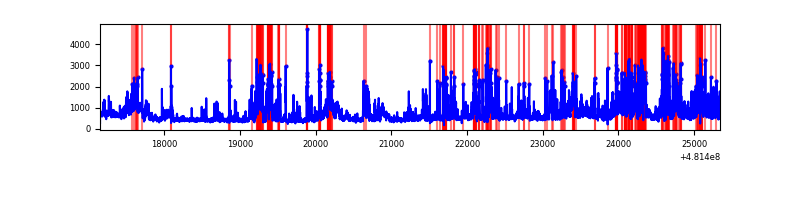 |
| B | 8194 | 8194 | 351 | 351 | 4.28% | 4.28% | 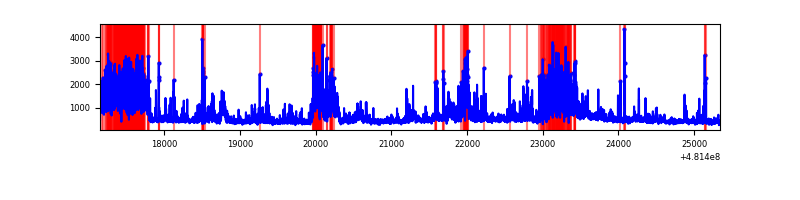 |
| C | 8195 | 8195 | 119 | 119 | 1.45% | 1.45% | 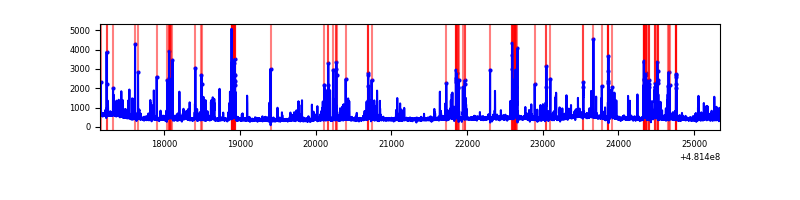 |
| D | 8195 | 8195 | 2260 | 2260 | 27.58% | 27.58% | 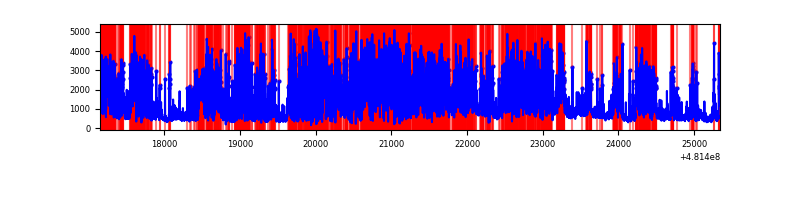 |
Top three noisy pixels from each quadrant. If the there are fewer than three noisy pixels in the level2.evt file, extra rows are filled as -1
| Pixel properties | Quadrant properties | ||||||
|---|---|---|---|---|---|---|---|
| Quadrant | DetID | PixID | Counts | Sigma | Mean | Median | Sigma |
| A | 12 | 250 | 1940452 | 9252.02 | 860 | 838 | 209.6 |
| A | 12 | 3 | 362243 | 1723.91 | 860 | 838 | 209.6 |
| A | 8 | 249 | 203727 | 967.79 | 860 | 838 | 209.6 |
| B | 12 | 32 | 1317508 | 7319.53 | 835 | 806 | 179.9 |
| B | 8 | 234 | 311847 | 1729.07 | 835 | 806 | 179.9 |
| B | 4 | 206 | 304700 | 1689.34 | 835 | 806 | 179.9 |
| C | 13 | 3 | 625509 | 2617.74 | 865 | 860 | 238.6 |
| C | 15 | 205 | 94997 | 394.5 | 865 | 860 | 238.6 |
| C | 15 | 219 | 72260 | 299.22 | 865 | 860 | 238.6 |
| D | 8 | 176 | 8016739 | 38769.19 | 736 | 712 | 206.8 |
| D | 3 | 12 | 299646 | 1445.78 | 736 | 712 | 206.8 |
| D | 2 | 249 | 136490 | 656.68 | 736 | 712 | 206.8 |
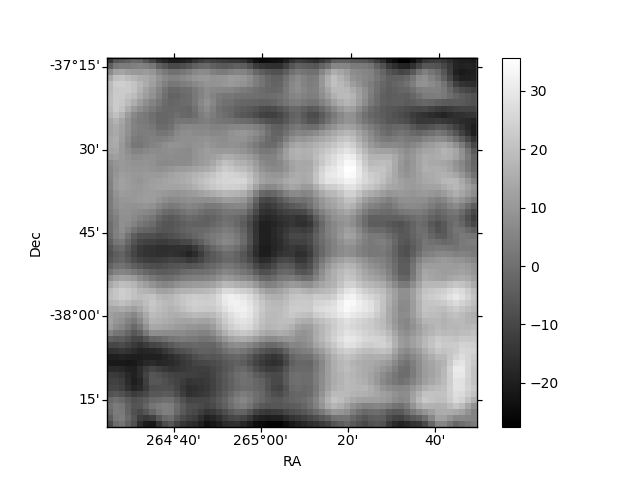
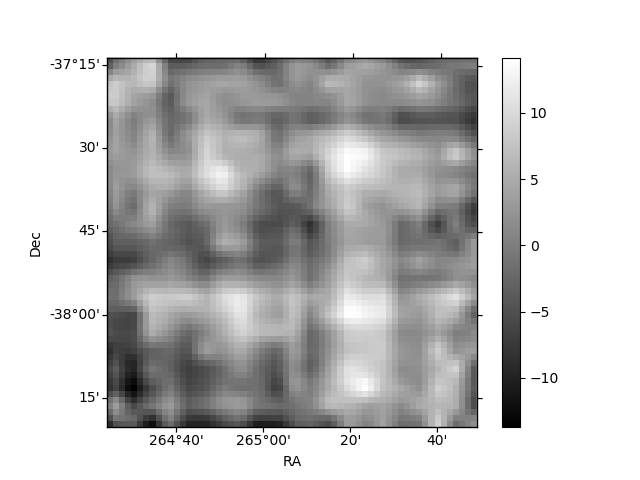
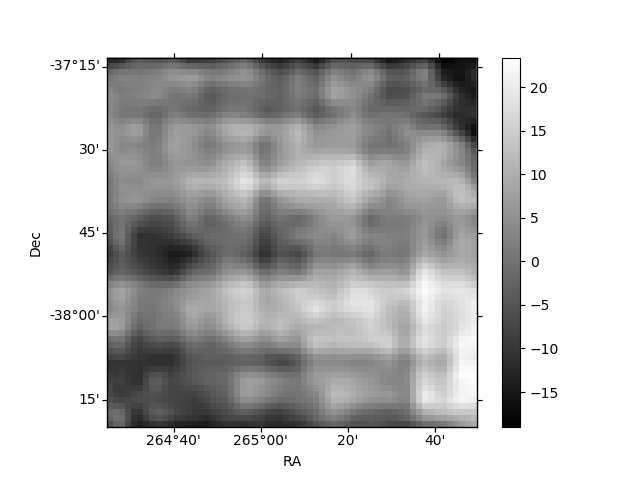
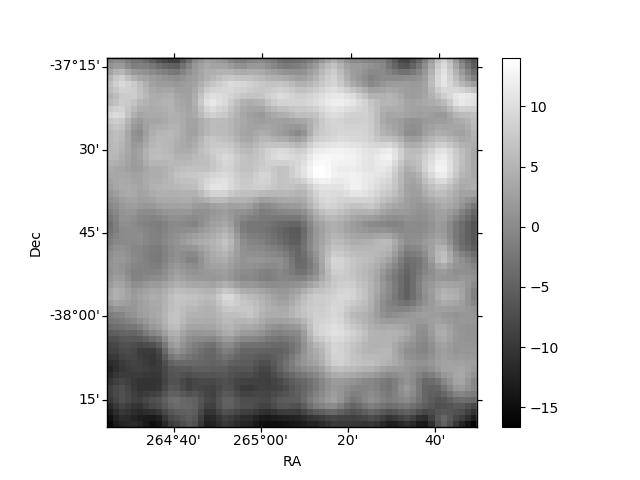
Histogram calculated using DETX and DETY for each event in the final _common_clean file
| Quadrant A | 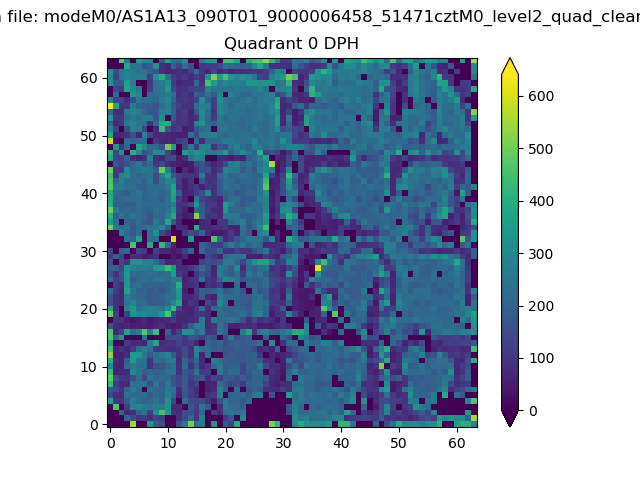 |
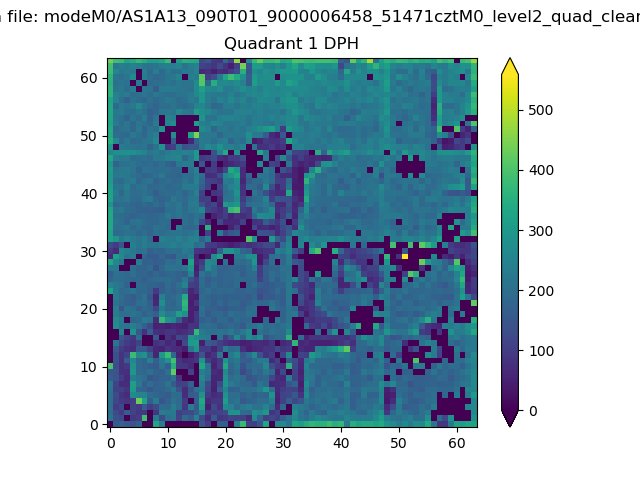 |
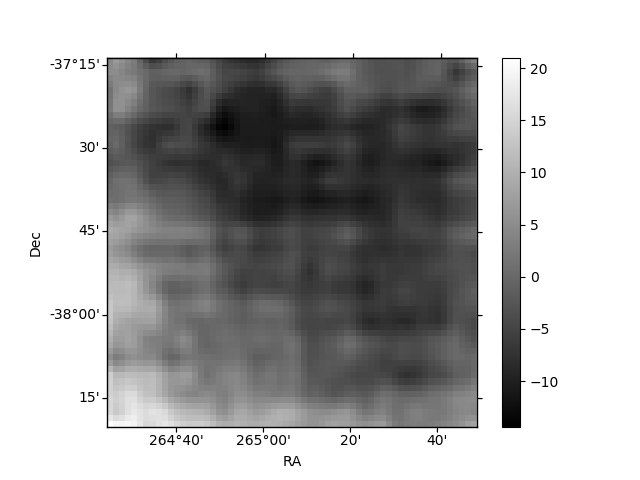
Quadrant B |
|---|---|---|---|
| Quadrant D | 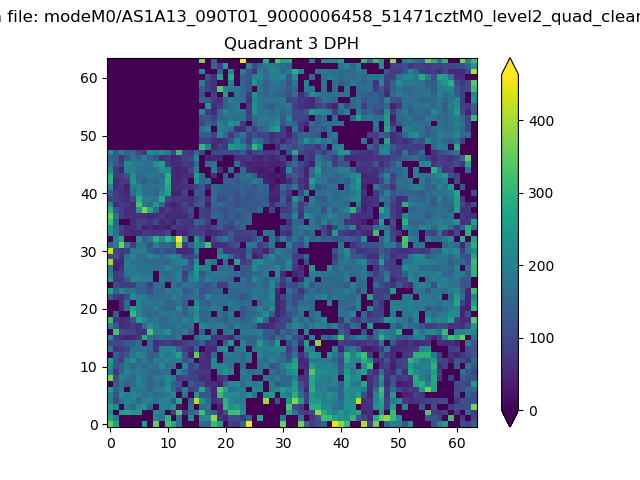 |
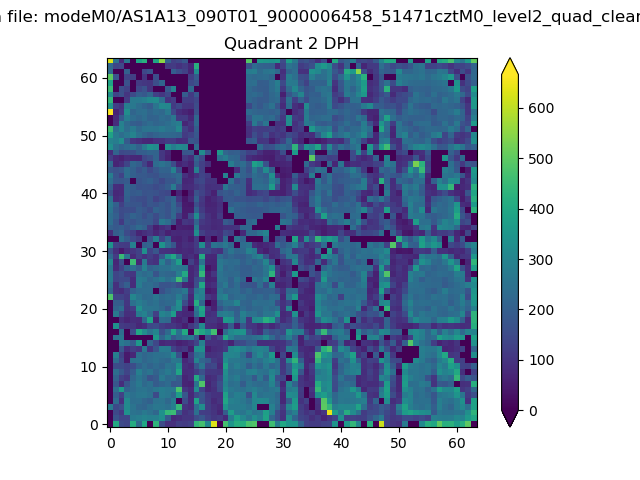 |
Quadrant C |
| Plot type | Count rate plots | Images |
|---|---|---|
| Comparison with Poisson distribution Blue bars denote a histogram of data divided into 1 sec bins. Red curve is a Poisson curve with rate = median count rate of data. |
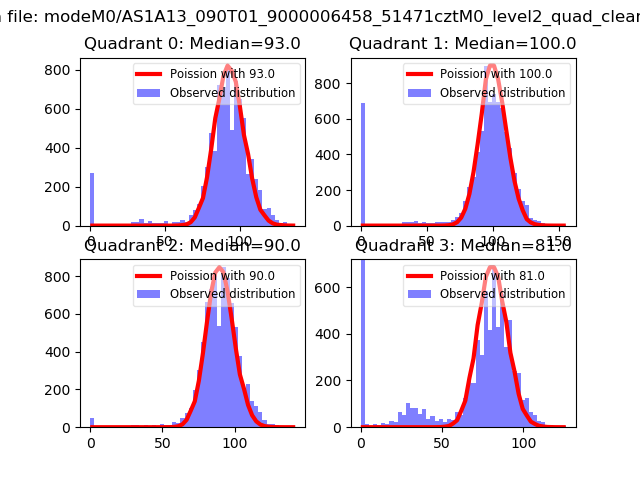 |
 |
| Quadrant-wise count rates Data is divided into 100 sec bins |
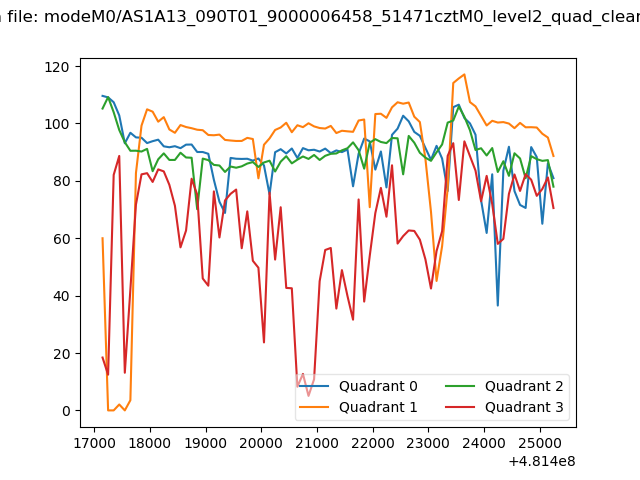 |
|
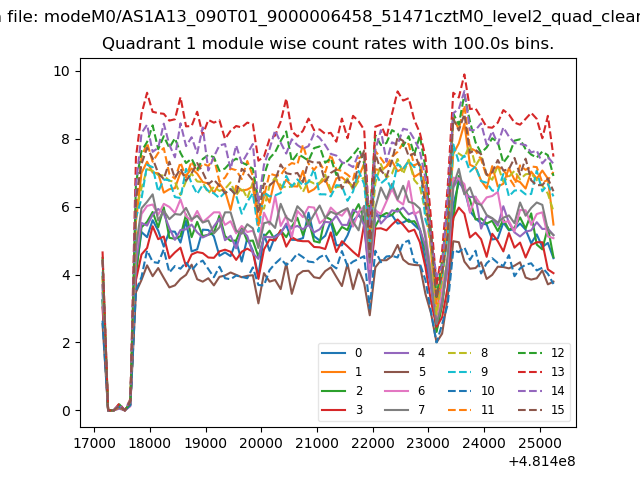
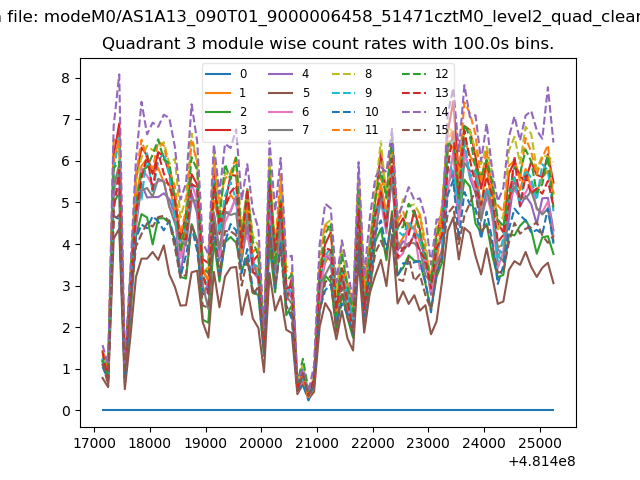
| Module-wise count rates for Quadrant A Data is divided into 100 sec bins |
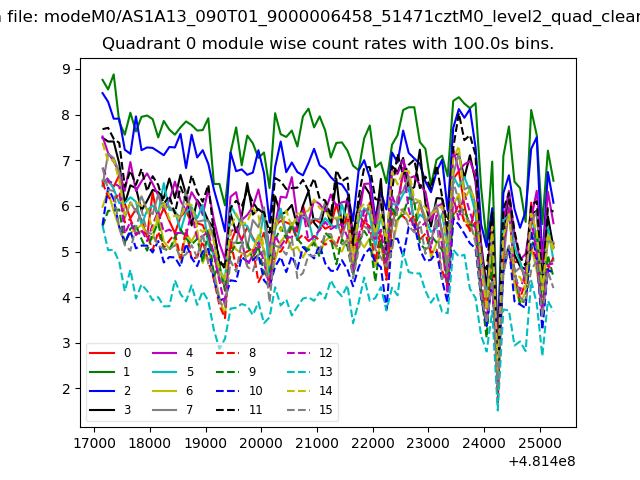 |
 |
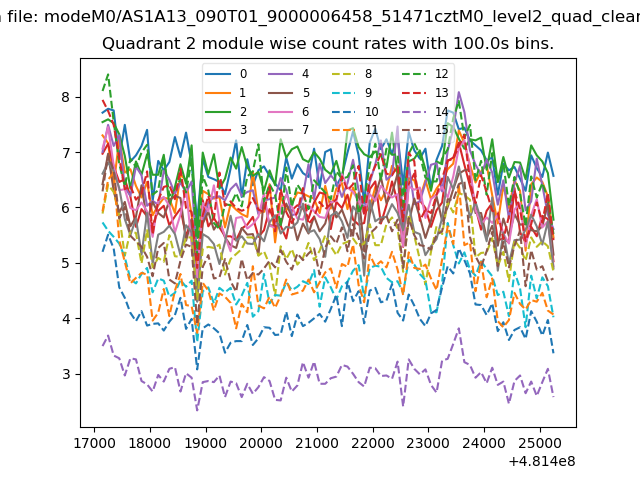
| Module-wise count rates for Quadrant B Data is divided into 100 sec bins |
 |
 |
| Module-wise count rates for Quadrant C Data is divided into 100 sec bins |
 |
 |
| Module-wise count rates for Quadrant D Data is divided into 100 sec bins |
 |
 |
| Parameter | Plot |
|---|---|
| CZT HV Monitor | 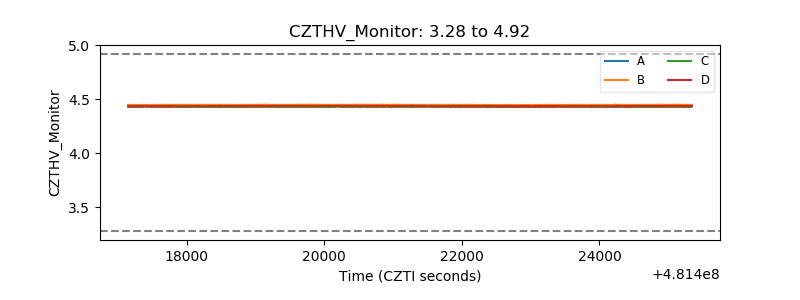 |
| D_VDD | 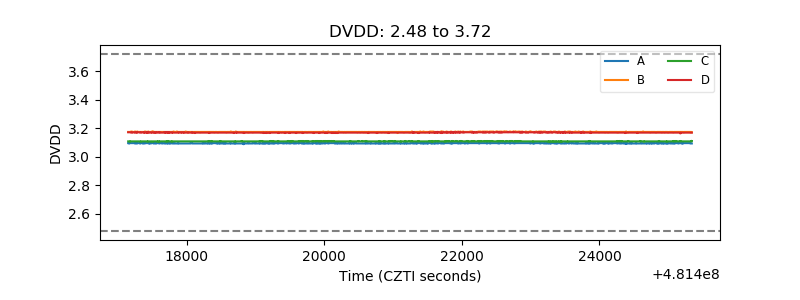 |
| Temperature 1 | 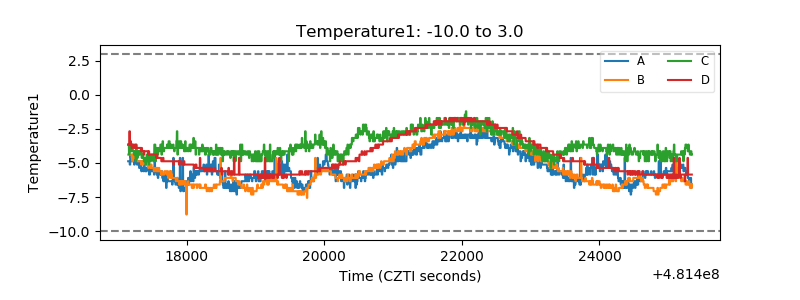 |
| Veto HV Monitor |  |
| Veto LLD | 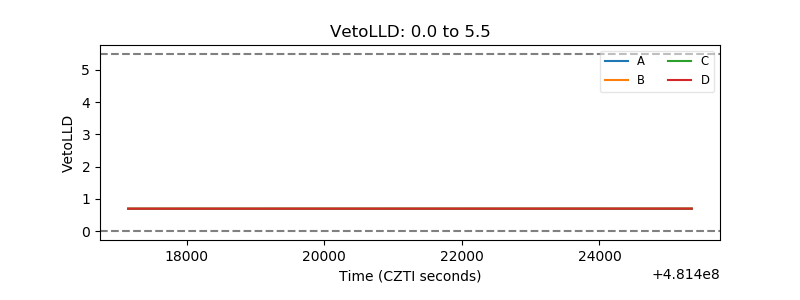 |
| Alpha Counter | 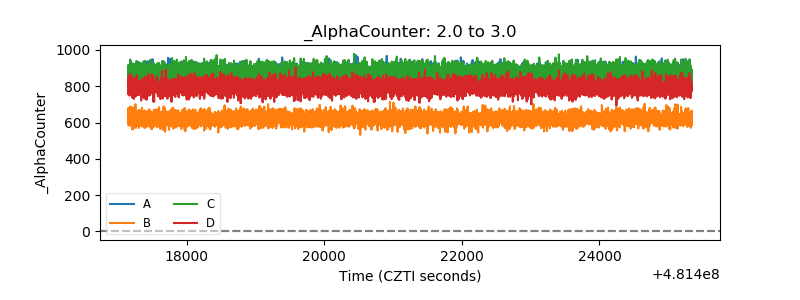 |
| _CPM_Rate | 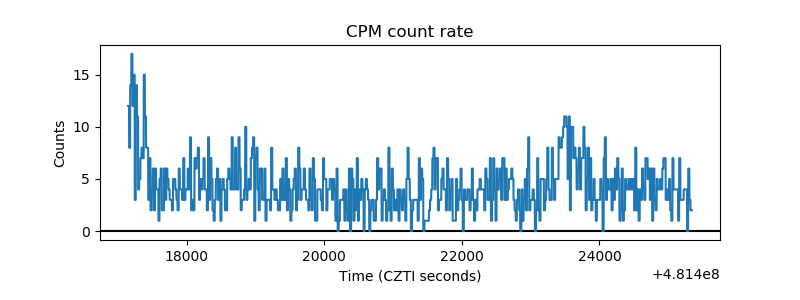 |
| CZT Counter | 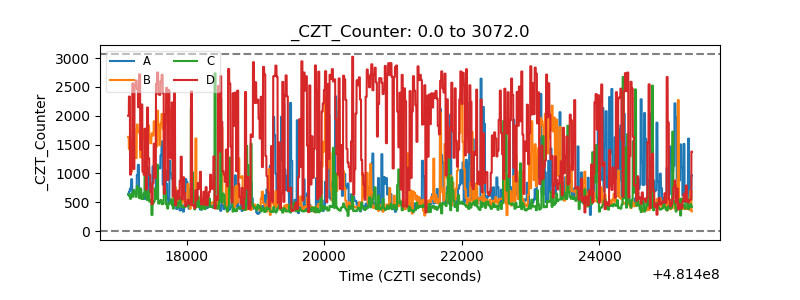 |
| +2.5 Volts monitor | 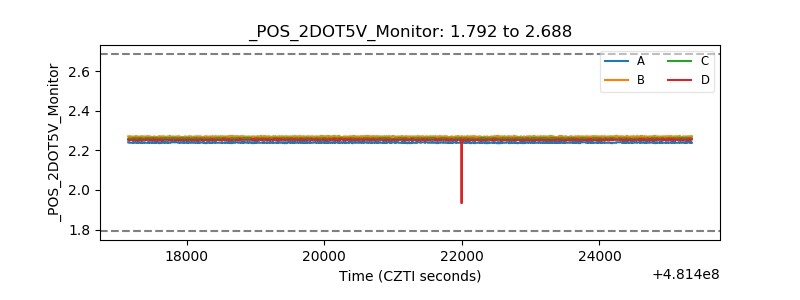 |
| +5 Volts monitor | 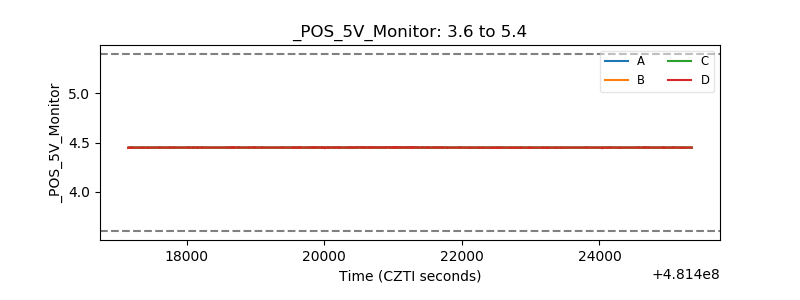 |
| _ROLL_ROT | 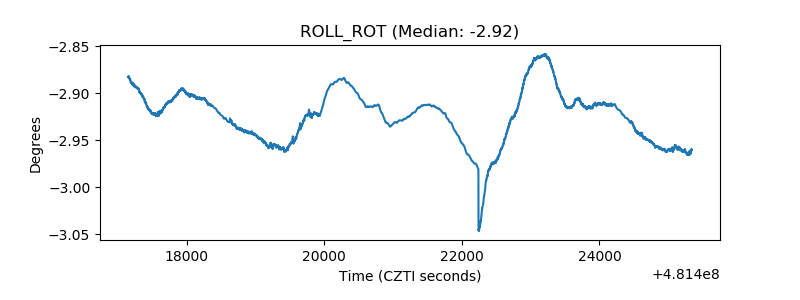 |
| _Roll_DEC | 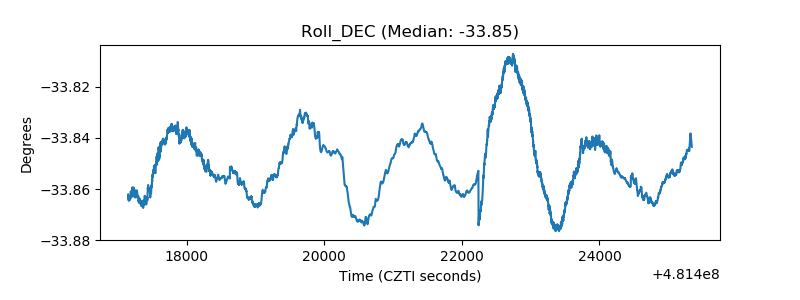 |
| _Roll_RA | 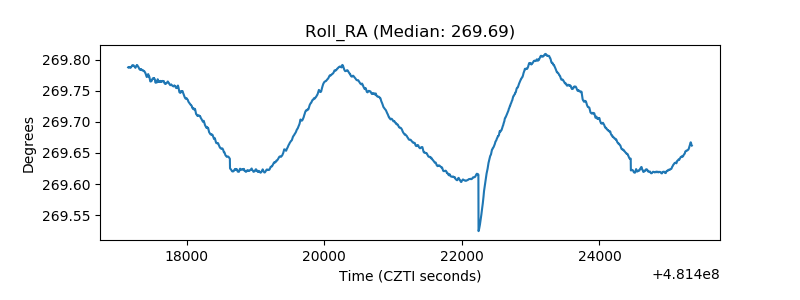 |
| Veto Counter | 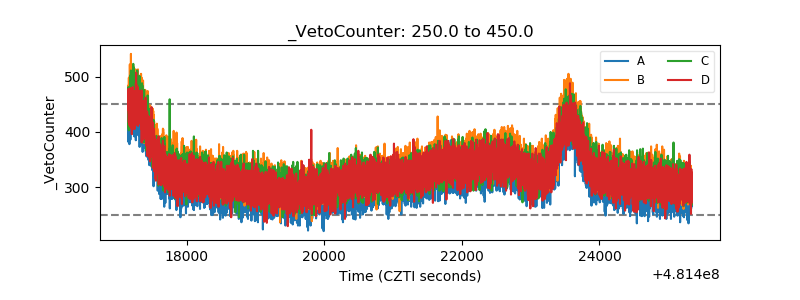 |