| Param | Original file | Final file |
|---|---|---|
| Filename | modeM0/AS1A13_090T01_9000006458_51476cztM0_level2.fits | modeM0/AS1A13_090T01_9000006458_51476cztM0_level2_quad_clean.evt |
| Size (bytes) | 2,731,504,320 | 418,282,560 |
| Size | 2.5 GB | 398.9 MB |
| Events in quadrant A | 25,870,569 | 2,624,895 |
| Events in quadrant B | 16,114,193 | 3,089,239 |
| Events in quadrant C | 20,146,068 | 2,659,525 |
| Events in quadrant D | 36,588,907 | 2,160,101 |
| Mode M0 | |||
|---|---|---|---|
| Quadrant | BADHDUFLAG | Total packets | Discarded packets |
| A | 0 | 98197 | 6 |
| B | 0 | 69725 | 5 |
| C | 0 | 81936 | 5 |
| D | 0 | 130110 | 5 |
| Mode M9 | |||
|---|---|---|---|
| Quadrant | BADHDUFLAG | Total packets | Discarded packets |
| A | 0 | 22 | 0 |
| B | 0 | 22 | 0 |
| C | 0 | 22 | 0 |
| D | 0 | 22 | 0 |
| Mode SS | |||
|---|---|---|---|
| Quadrant | BADHDUFLAG | Total packets | Discarded packets |
| A | 0 | 626 | 0 |
| B | 0 | 626 | 0 |
| C | 0 | 626 | 0 |
| D | 0 | 626 | 0 |
| Quadrant | Total seconds | Saturated seconds | Saturation percentage |
|---|---|---|---|
| A | 30993 | 3375 | 10.889556% |
| B | 30993 | 679 | 2.190817% |
| C | 30994 | 1964 | 6.336710% |
| D | 30994 | 6445 | 20.794347% |
Noise dominated data is calculated using 1-second bins in cleaned event files. If a bin has >2000 counts, and if more than 50% of those come from <1% of pixels, then it is considered to be noise-dominated and hence unusable.
| Quadrant | # 1 sec bins | Bins with >0 counts | Bins with >2000 counts | High rate bins dominated by noise | Noise dominated (total time) | Noise dominated (detector-on time) | Marked lightcurve |
|---|---|---|---|---|---|---|---|
| A | 33053 | 30996 | 1828 | 1828 | 5.53% | 5.90% | 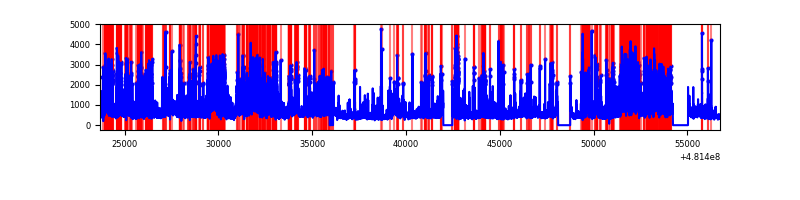 |
| B | 33053 | 30997 | 159 | 159 | 0.48% | 0.51% | 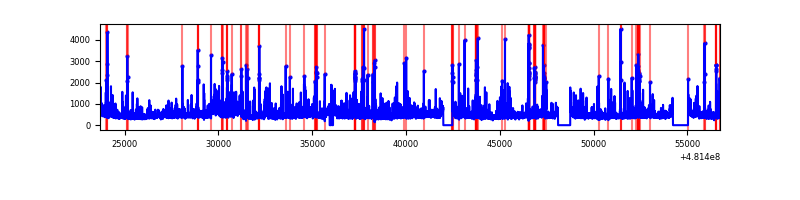 |
| C | 33054 | 30998 | 1245 | 1245 | 3.77% | 4.02% | 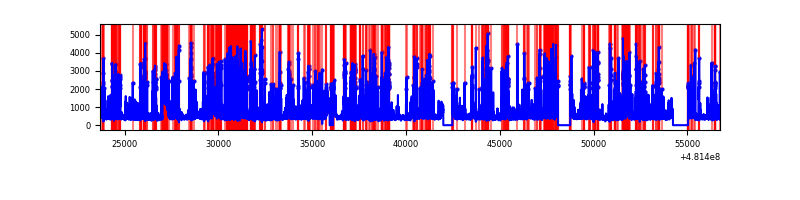 |
| D | 33054 | 30997 | 5610 | 5610 | 16.97% | 18.10% | 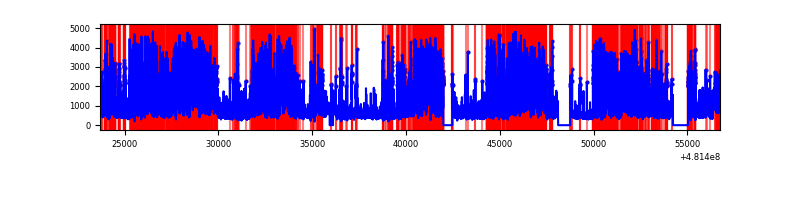 |
Top three noisy pixels from each quadrant. If the there are fewer than three noisy pixels in the level2.evt file, extra rows are filled as -1
| Pixel properties | Quadrant properties | ||||||
|---|---|---|---|---|---|---|---|
| Quadrant | DetID | PixID | Counts | Sigma | Mean | Median | Sigma |
| A | 12 | 250 | 6813138 | 8660.21 | 3221 | 3140 | 786.4 |
| A | 12 | 3 | 2001164 | 2540.87 | 3221 | 3140 | 786.4 |
| A | 5 | 240 | 589716 | 745.94 | 3221 | 3140 | 786.4 |
| B | 8 | 128 | 437900 | 611.25 | 3307 | 3180 | 711.2 |
| B | 8 | 234 | 433021 | 604.39 | 3307 | 3180 | 711.2 |
| B | 10 | 254 | 387544 | 540.45 | 3307 | 3180 | 711.2 |
| C | 15 | 215 | 2007756 | 2290.6 | 3208 | 3183 | 875.1 |
| C | 13 | 3 | 1903083 | 2170.99 | 3208 | 3183 | 875.1 |
| C | 15 | 147 | 946635 | 1078.07 | 3208 | 3183 | 875.1 |
| D | 8 | 176 | 17461384 | 20709.82 | 2994 | 2890 | 843.0 |
| D | 6 | 42 | 1609161 | 1905.41 | 2994 | 2890 | 843.0 |
| D | 7 | 60 | 1054539 | 1247.5 | 2994 | 2890 | 843.0 |
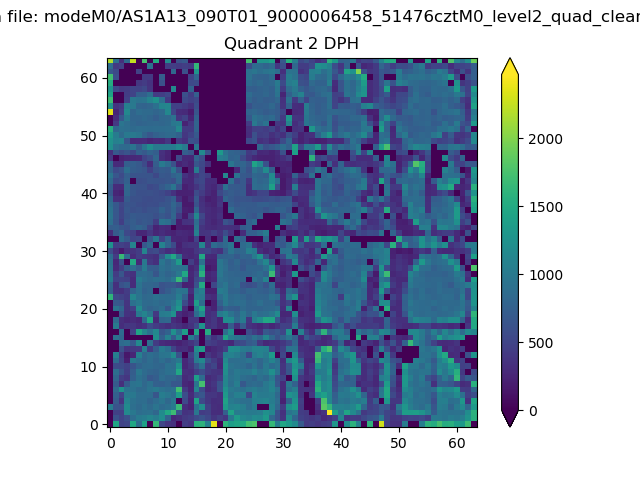
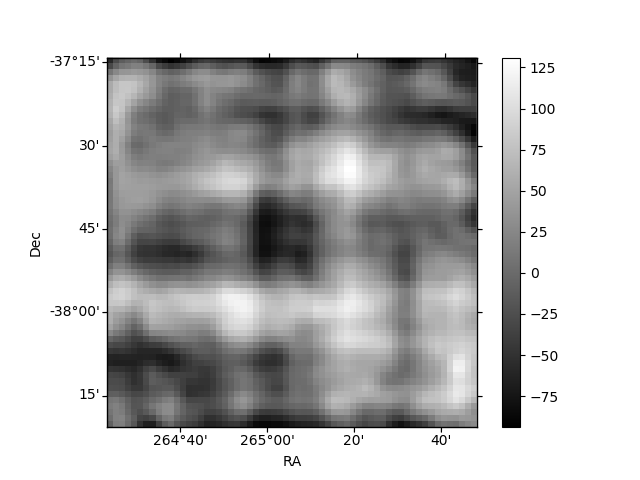
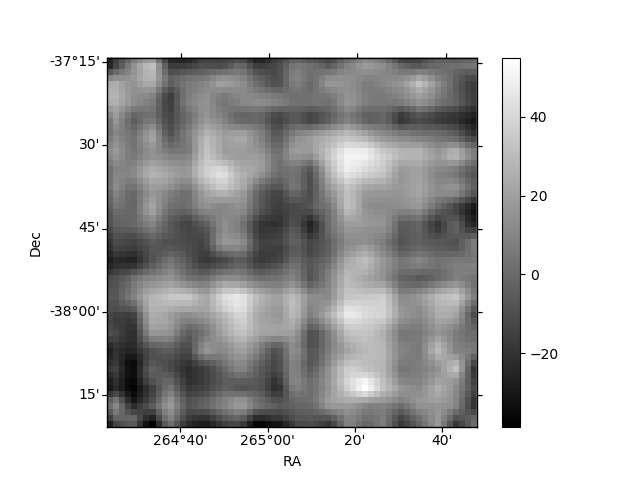
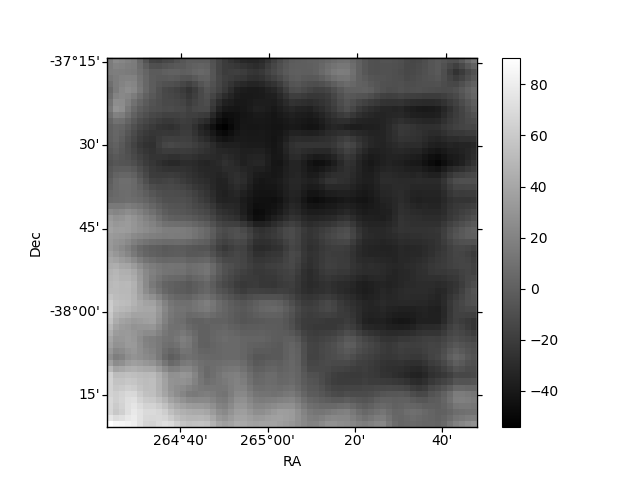
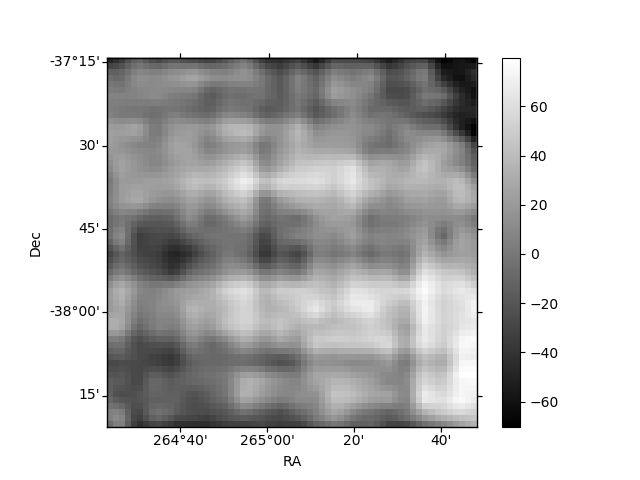
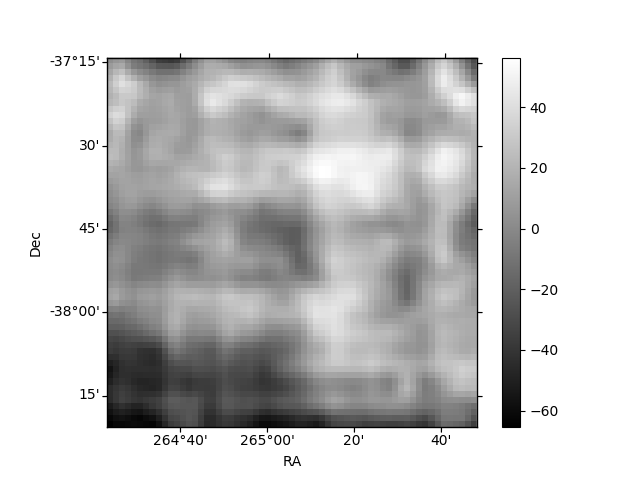
Histogram calculated using DETX and DETY for each event in the final _common_clean file
| Quadrant A | 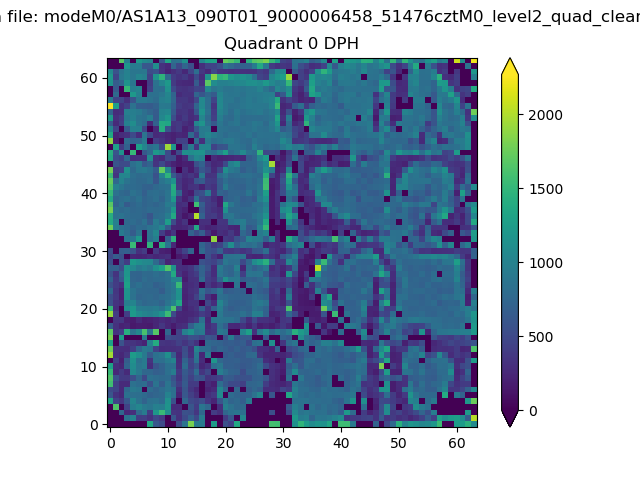 |
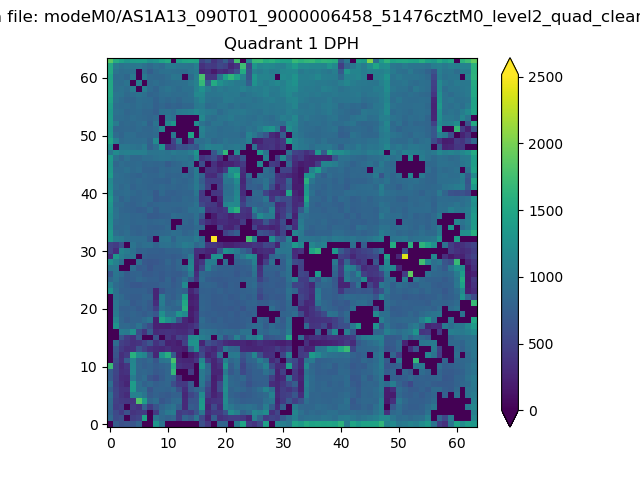 |
Quadrant B |
|---|---|---|---|
| Quadrant D | 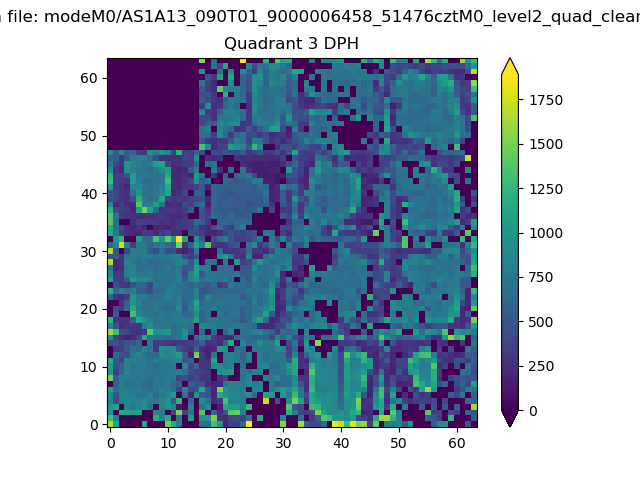 |
 |
Quadrant C |
| Plot type | Count rate plots | Images |
|---|---|---|
| Comparison with Poisson distribution Blue bars denote a histogram of data divided into 1 sec bins. Red curve is a Poisson curve with rate = median count rate of data. |
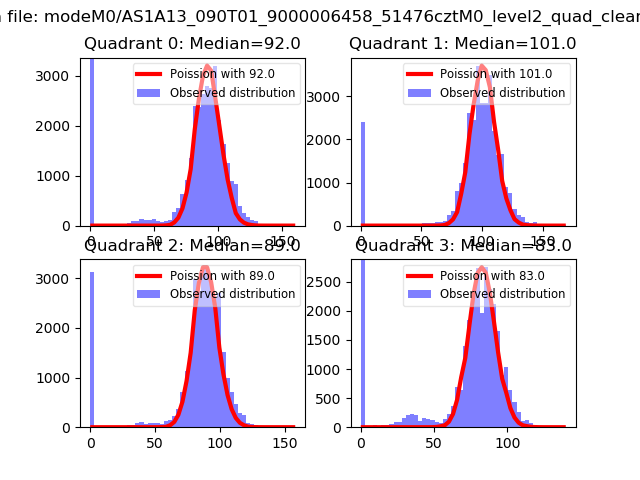 |
 |
| Quadrant-wise count rates Data is divided into 100 sec bins |
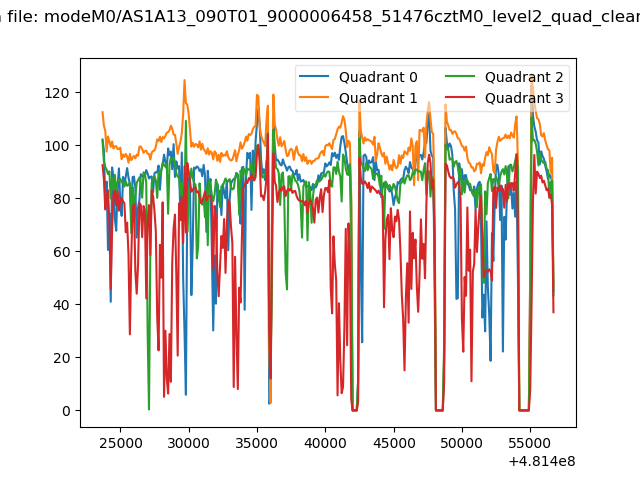 |
|
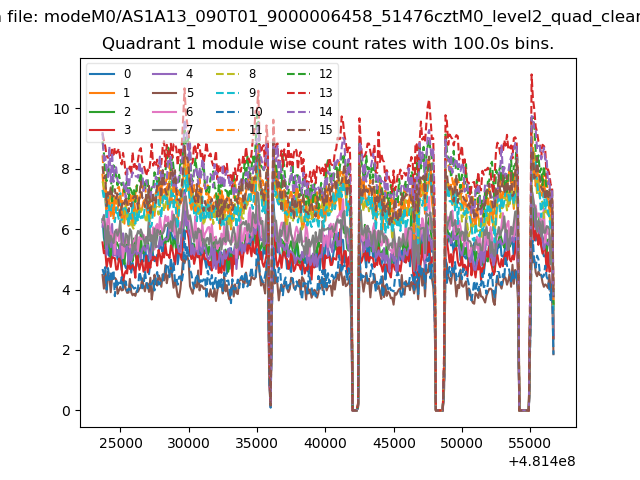
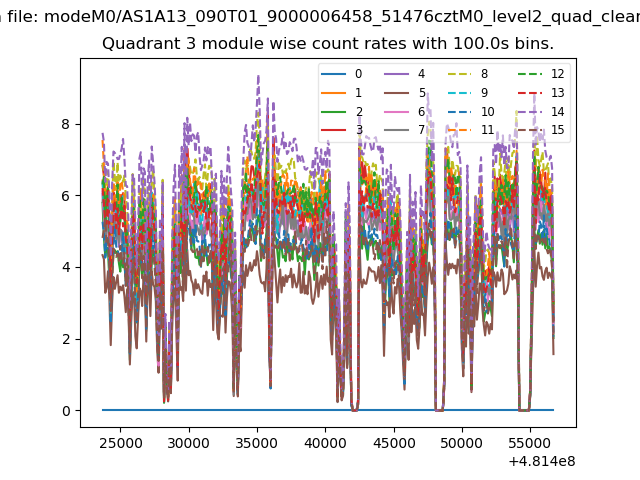
| Module-wise count rates for Quadrant A Data is divided into 100 sec bins |
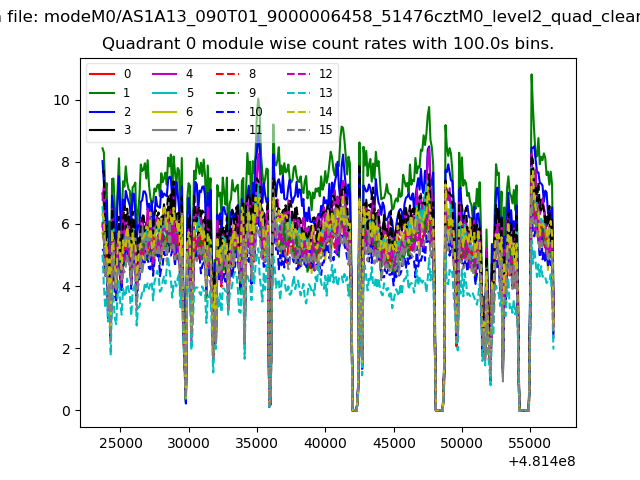 |
 |
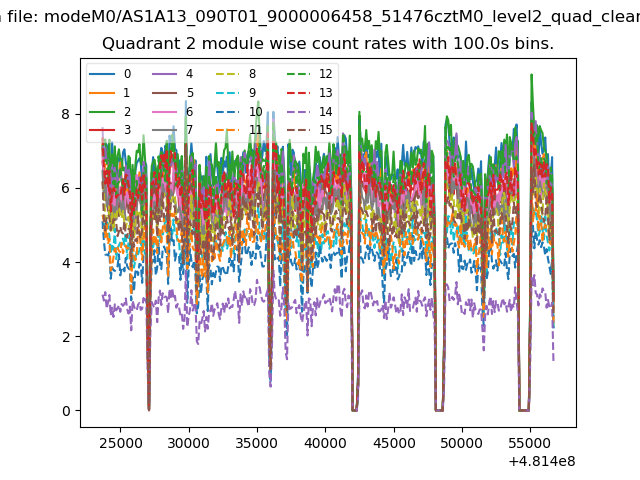
| Module-wise count rates for Quadrant B Data is divided into 100 sec bins |
 |
 |
| Module-wise count rates for Quadrant C Data is divided into 100 sec bins |
 |
 |
| Module-wise count rates for Quadrant D Data is divided into 100 sec bins |
 |
 |
| Parameter | Plot |
|---|---|
| CZT HV Monitor | 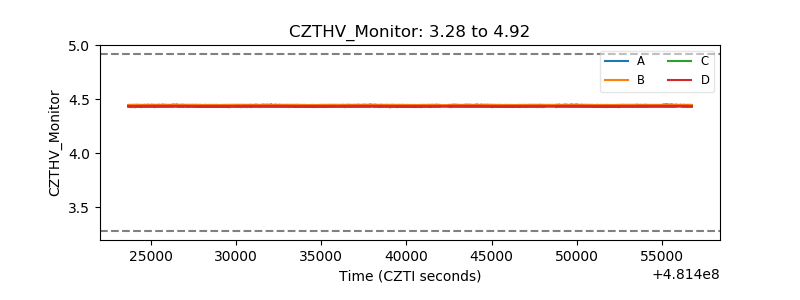 |
| D_VDD | 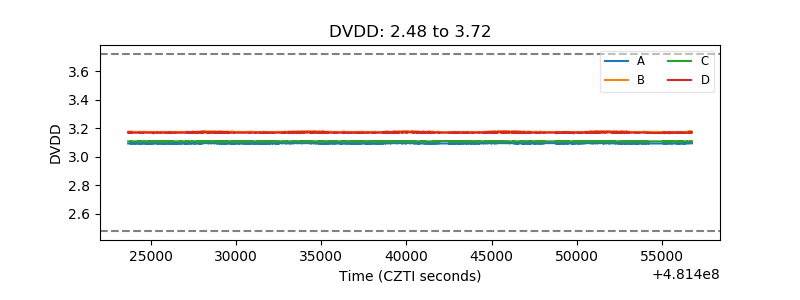 |
| Temperature 1 | 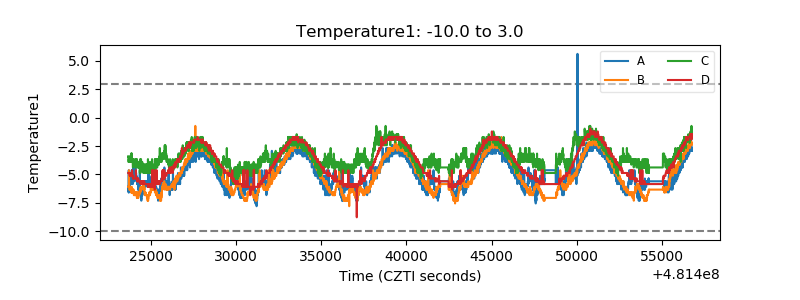 |
| Veto HV Monitor |  |
| Veto LLD | 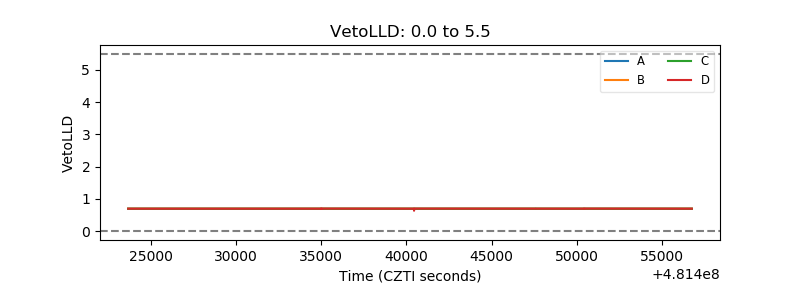 |
| Alpha Counter | 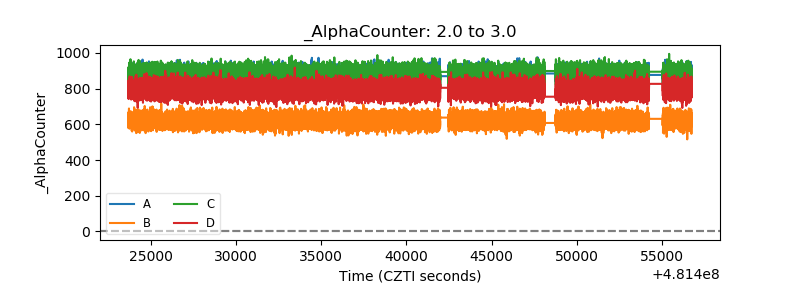 |
| _CPM_Rate | 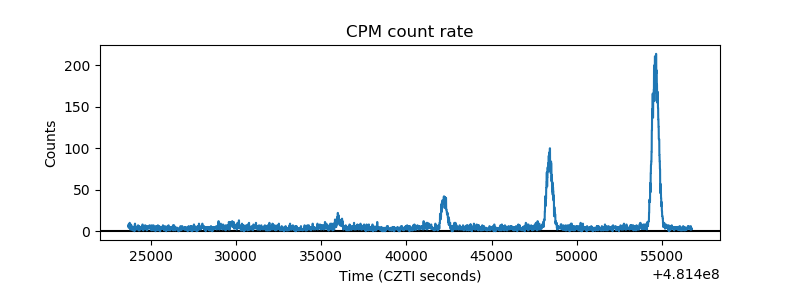 |
| CZT Counter | 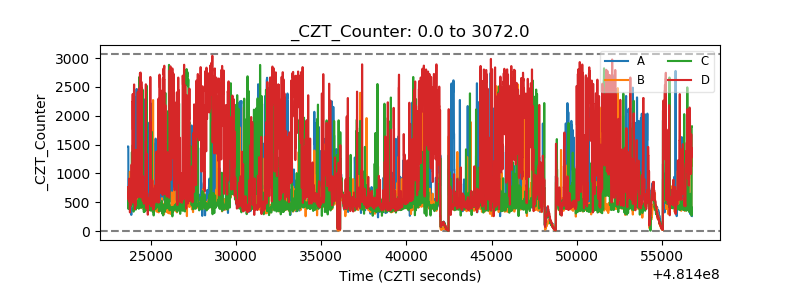 |
| +2.5 Volts monitor | 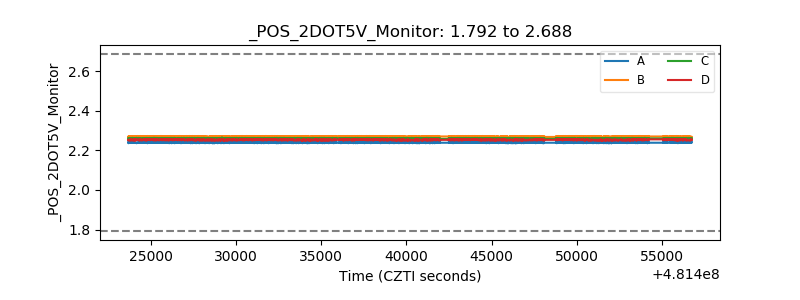 |
| +5 Volts monitor | 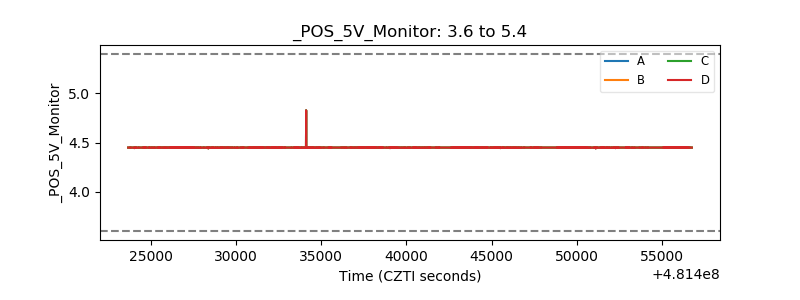 |
| _ROLL_ROT | 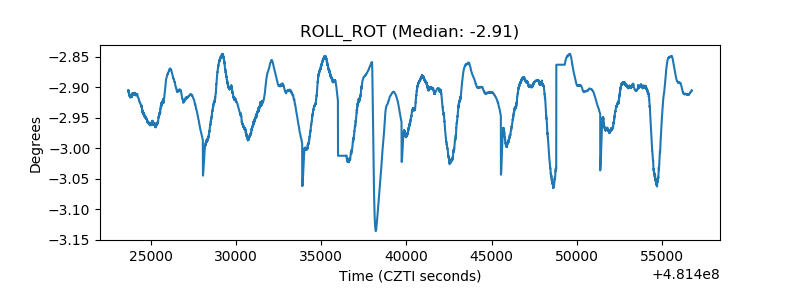 |
| _Roll_DEC | 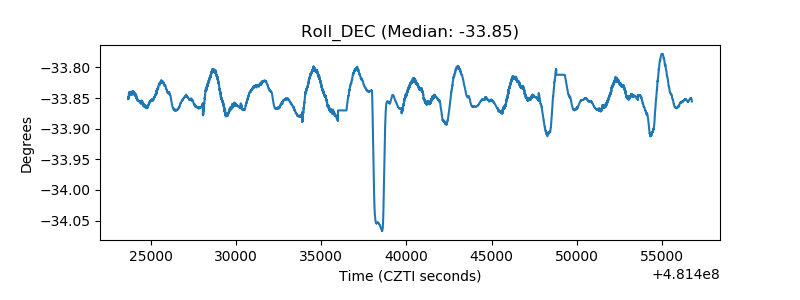 |
| _Roll_RA | 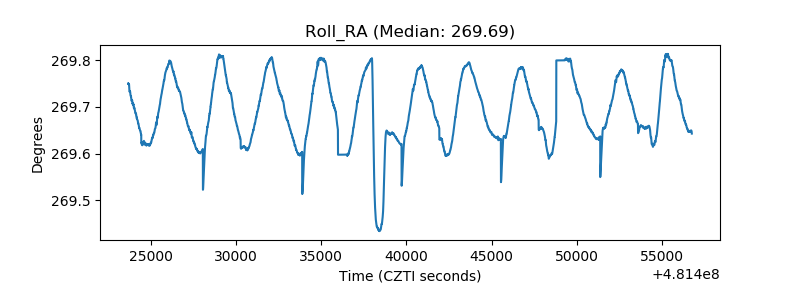 |
| Veto Counter | 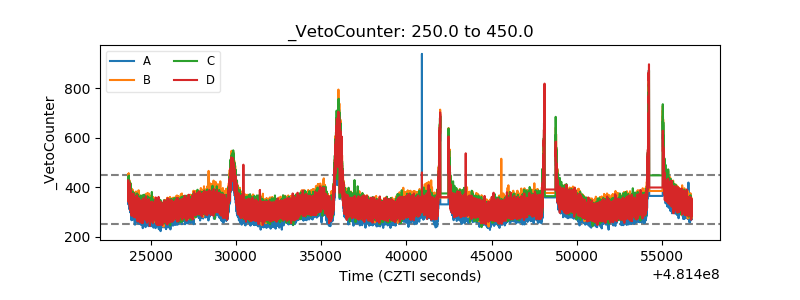 |