| Param | Original file | Final file |
|---|---|---|
| Filename | modeM0/AS1A13_090T01_9000006458_51478cztM0_level2.fits | modeM0/AS1A13_090T01_9000006458_51478cztM0_level2_quad_clean.evt |
| Size (bytes) | 633,168,000 | 94,415,040 |
| Size | 603.8 MB | 90.0 MB |
| Events in quadrant A | 5,327,810 | 626,357 |
| Events in quadrant B | 3,939,506 | 689,460 |
| Events in quadrant C | 3,867,221 | 618,991 |
| Events in quadrant D | 9,773,872 | 447,370 |
| Mode M0 | |||
|---|---|---|---|
| Quadrant | BADHDUFLAG | Total packets | Discarded packets |
| A | 0 | 20572 | 2 |
| B | 0 | 16440 | 2 |
| C | 0 | 16410 | 2 |
| D | 0 | 33746 | 2 |
| Mode M9 | |||
|---|---|---|---|
| Quadrant | BADHDUFLAG | Total packets | Discarded packets |
| A | 0 | 9 | 0 |
| B | 0 | 9 | 0 |
| C | 0 | 9 | 0 |
| D | 0 | 9 | 0 |
| Mode SS | |||
|---|---|---|---|
| Quadrant | BADHDUFLAG | Total packets | Discarded packets |
| A | 0 | 140 | 0 |
| B | 0 | 140 | 0 |
| C | 0 | 140 | 0 |
| D | 0 | 140 | 0 |
| Quadrant | Total seconds | Saturated seconds | Saturation percentage |
|---|---|---|---|
| A | 6831 | 359 | 5.255453% |
| B | 6832 | 220 | 3.220141% |
| C | 6832 | 210 | 3.073770% |
| D | 6832 | 1853 | 27.122365% |
Noise dominated data is calculated using 1-second bins in cleaned event files. If a bin has >2000 counts, and if more than 50% of those come from <1% of pixels, then it is considered to be noise-dominated and hence unusable.
| Quadrant | # 1 sec bins | Bins with >0 counts | Bins with >2000 counts | High rate bins dominated by noise | Noise dominated (total time) | Noise dominated (detector-on time) | Marked lightcurve |
|---|---|---|---|---|---|---|---|
| A | 7781 | 6832 | 188 | 188 | 2.42% | 2.75% | 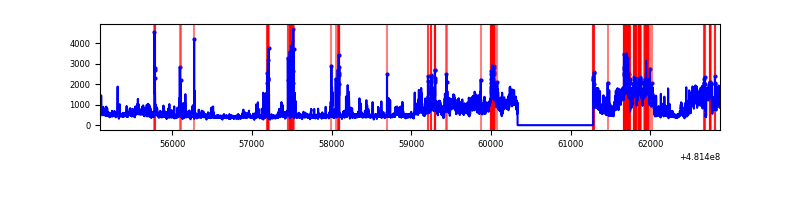 |
| B | 7782 | 6833 | 98 | 98 | 1.26% | 1.43% | 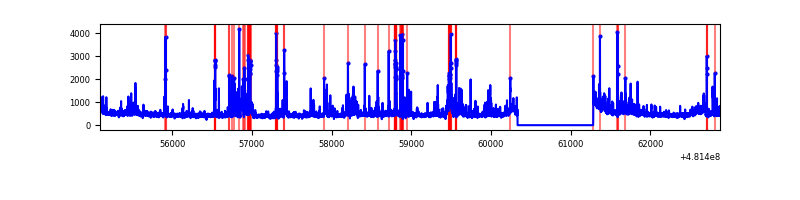 |
| C | 7782 | 6832 | 115 | 115 | 1.48% | 1.68% | 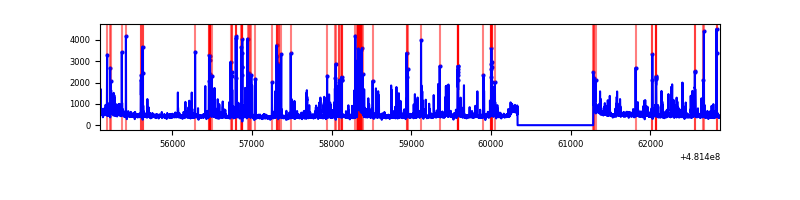 |
| D | 7782 | 6832 | 1787 | 1787 | 22.96% | 26.16% | 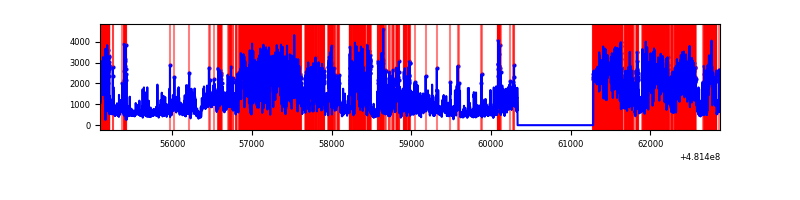 |
Top three noisy pixels from each quadrant. If the there are fewer than three noisy pixels in the level2.evt file, extra rows are filled as -1
| Pixel properties | Quadrant properties | ||||||
|---|---|---|---|---|---|---|---|
| Quadrant | DetID | PixID | Counts | Sigma | Mean | Median | Sigma |
| A | 12 | 3 | 1386579 | 7724.86 | 738 | 720 | 179.4 |
| A | 8 | 43 | 250691 | 1393.35 | 738 | 720 | 179.4 |
| A | 12 | 194 | 165111 | 916.32 | 738 | 720 | 179.4 |
| B | 4 | 81 | 218130 | 1394.48 | 730 | 706 | 155.9 |
| B | 8 | 234 | 193608 | 1237.2 | 730 | 706 | 155.9 |
| B | 7 | 252 | 150037 | 957.76 | 730 | 706 | 155.9 |
| C | 13 | 3 | 278742 | 1370.8 | 724 | 717 | 202.8 |
| C | 15 | 215 | 275916 | 1356.86 | 724 | 717 | 202.8 |
| C | 0 | 177 | 130214 | 638.48 | 724 | 717 | 202.8 |
| D | 8 | 176 | 6234776 | 34375.94 | 643 | 620 | 181.4 |
| D | 5 | 32 | 278669 | 1533.2 | 643 | 620 | 181.4 |
| D | 11 | 176 | 212428 | 1167.94 | 643 | 620 | 181.4 |
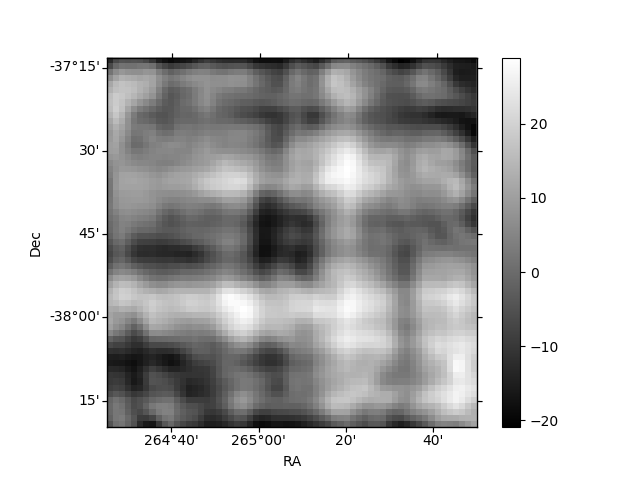
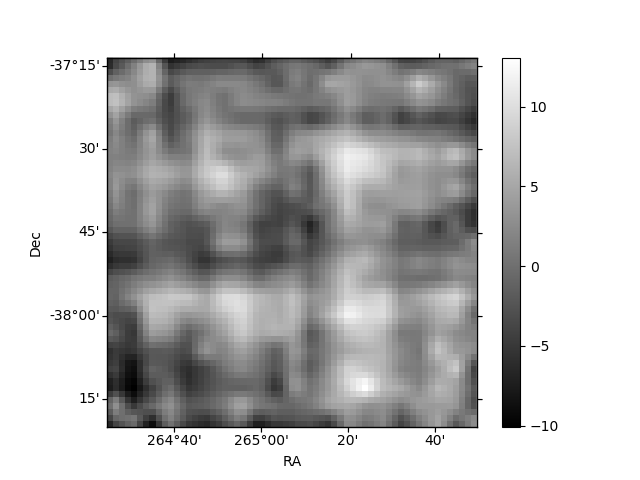
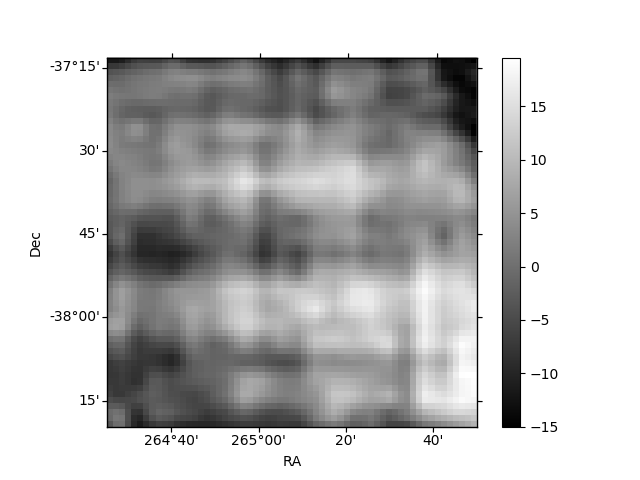
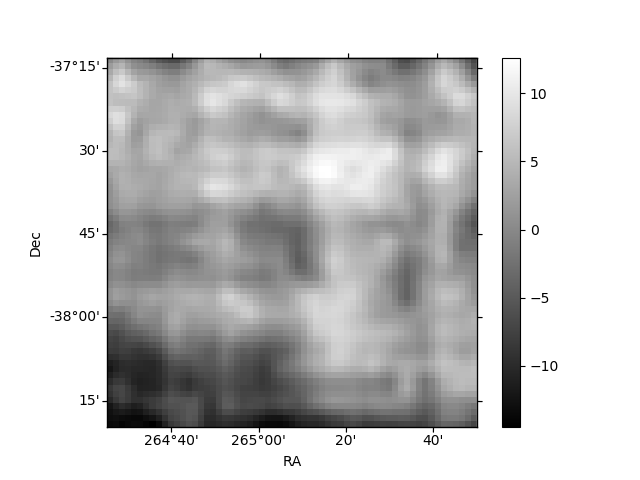
Histogram calculated using DETX and DETY for each event in the final _common_clean file
| Quadrant A | 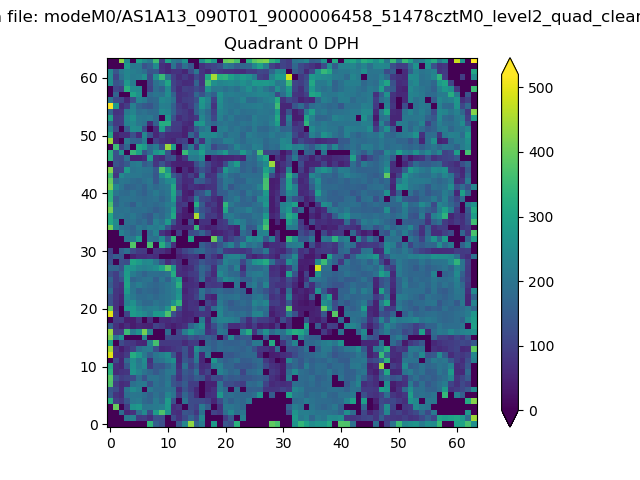 |
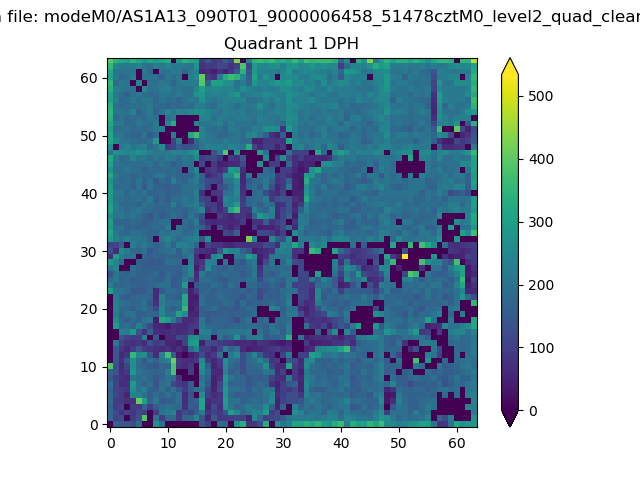 |
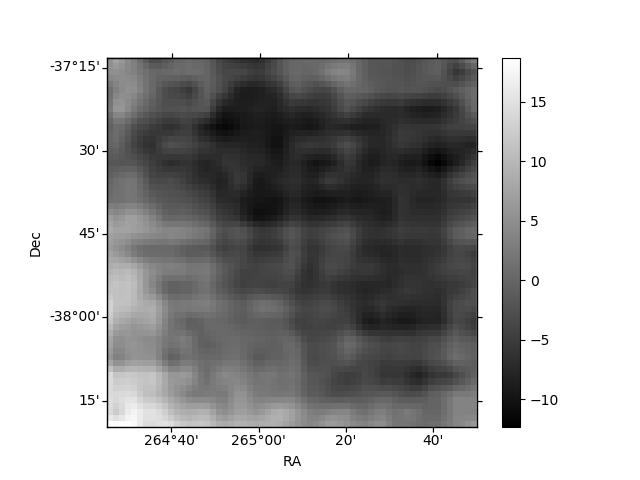
Quadrant B |
|---|---|---|---|
| Quadrant D | 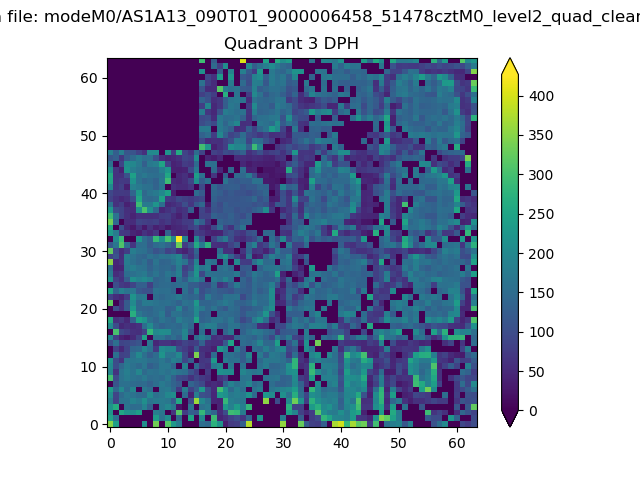 |
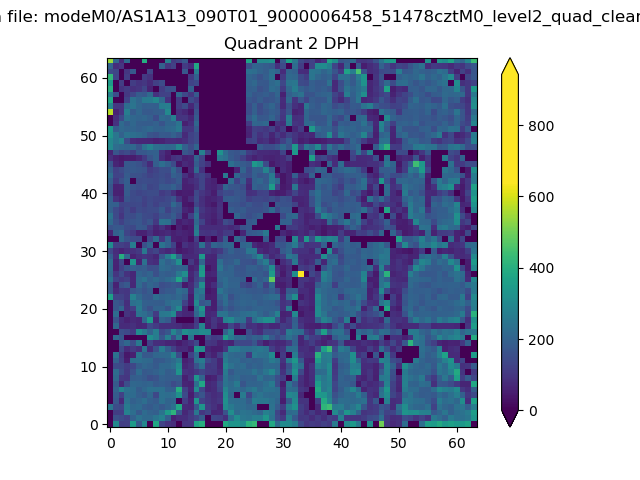 |
Quadrant C |
| Plot type | Count rate plots | Images |
|---|---|---|
| Comparison with Poisson distribution Blue bars denote a histogram of data divided into 1 sec bins. Red curve is a Poisson curve with rate = median count rate of data. |
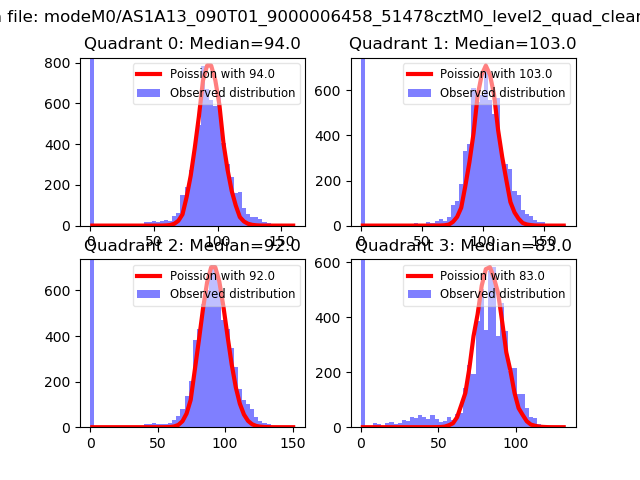 |
 |
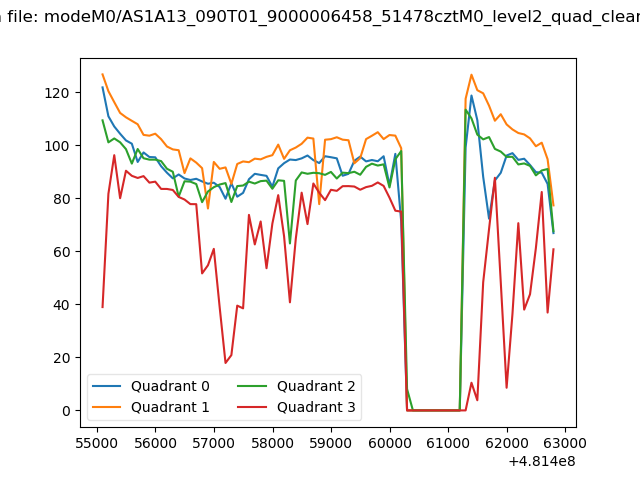
| Quadrant-wise count rates Data is divided into 100 sec bins |
 |
|
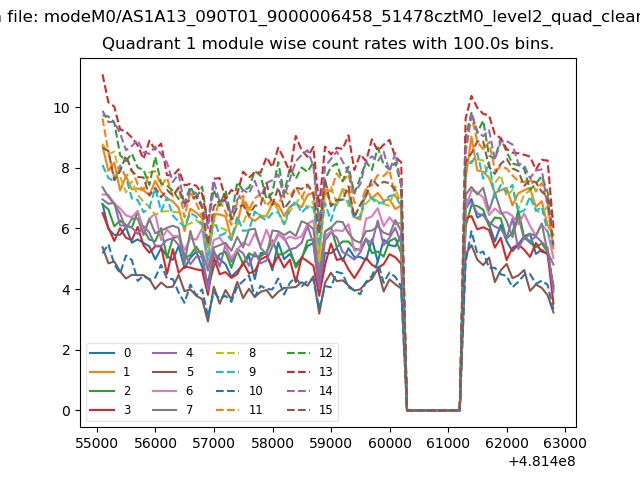
| Module-wise count rates for Quadrant A Data is divided into 100 sec bins |
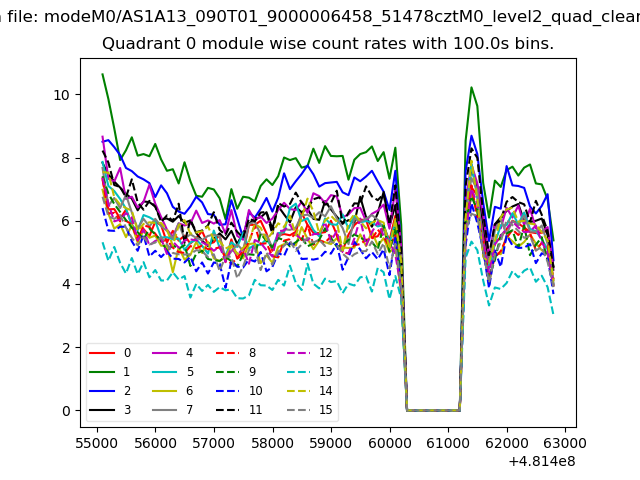 |
 |
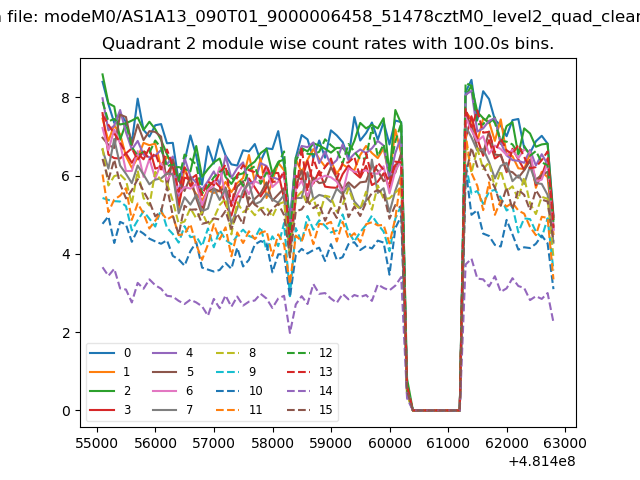
| Module-wise count rates for Quadrant B Data is divided into 100 sec bins |
 |
 |
| Module-wise count rates for Quadrant C Data is divided into 100 sec bins |
 |
 |
| Module-wise count rates for Quadrant D Data is divided into 100 sec bins |
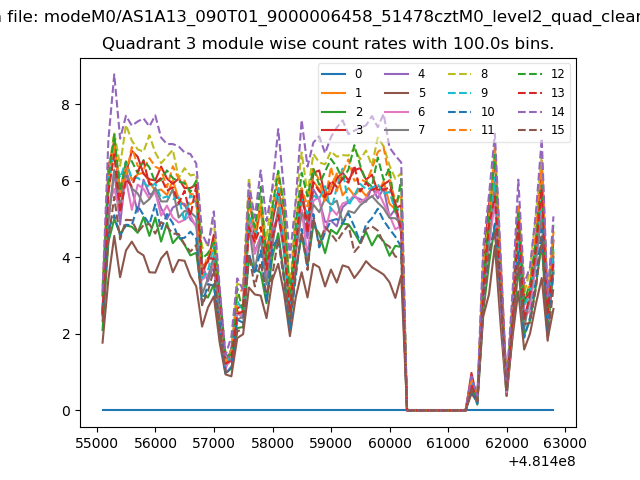 |
 |
| Parameter | Plot |
|---|---|
| CZT HV Monitor | 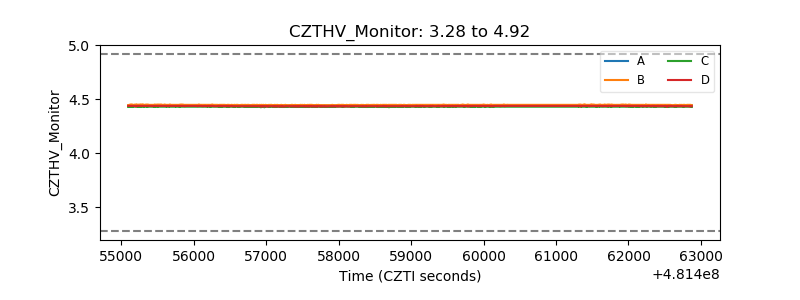 |
| D_VDD | 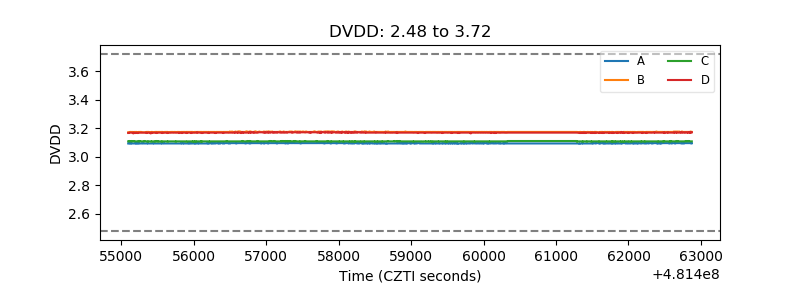 |
| Temperature 1 | 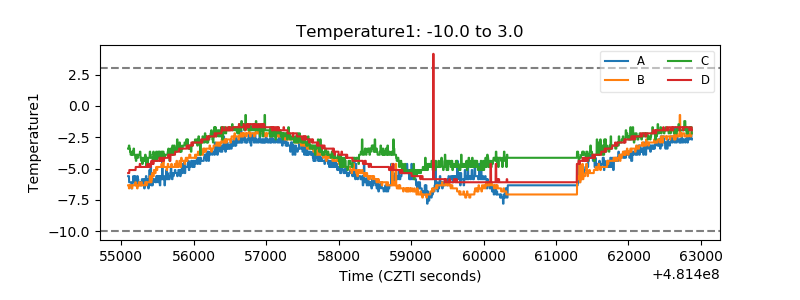 |
| Veto HV Monitor | 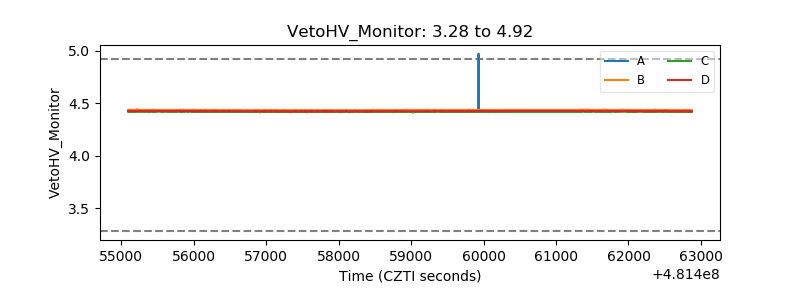 |
| Veto LLD | 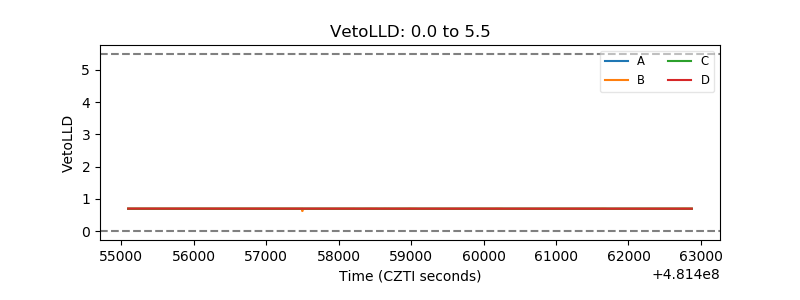 |
| Alpha Counter | 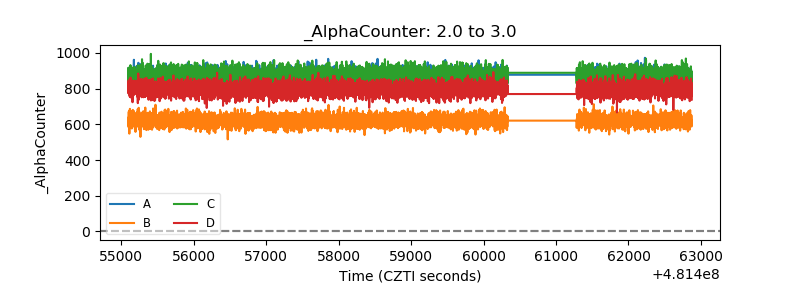 |
| _CPM_Rate | 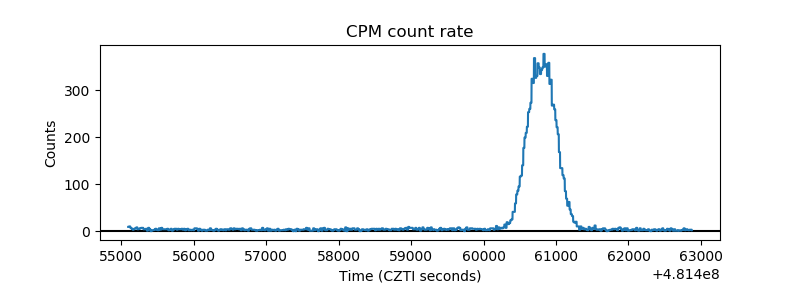 |
| CZT Counter | 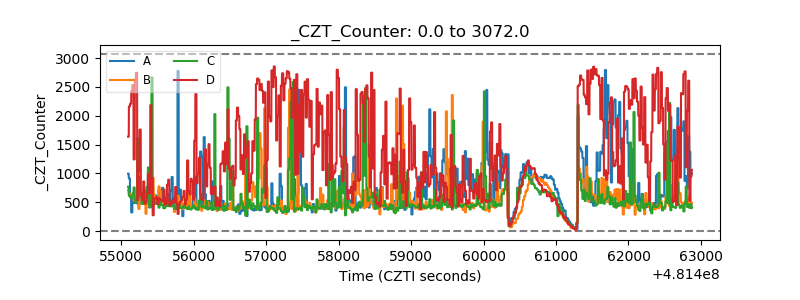 |
| +2.5 Volts monitor | 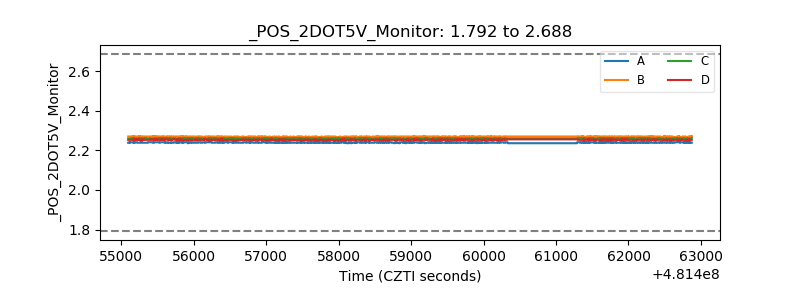 |
| +5 Volts monitor | 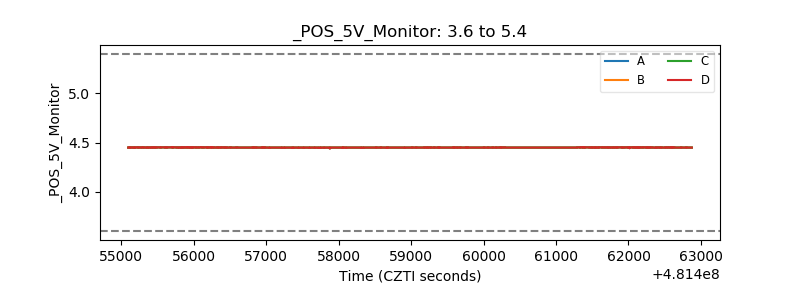 |
| _ROLL_ROT | 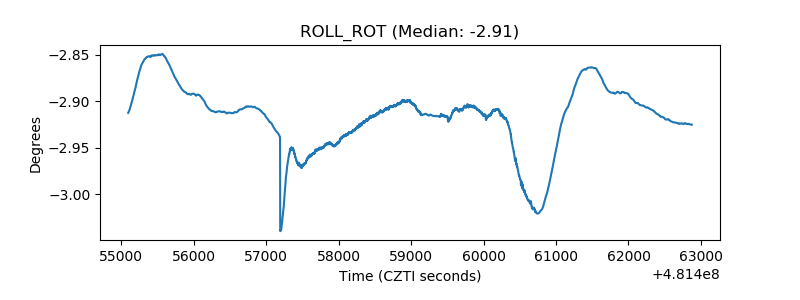 |
| _Roll_DEC | 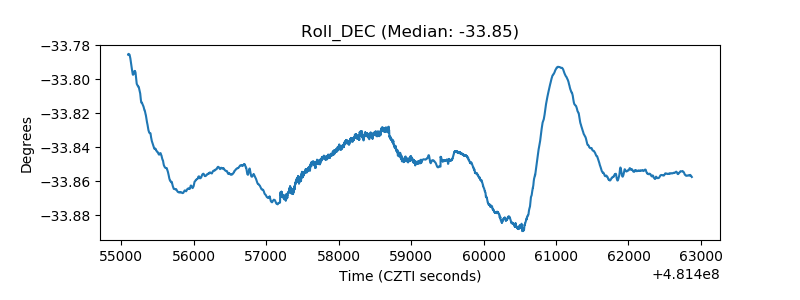 |
| _Roll_RA | 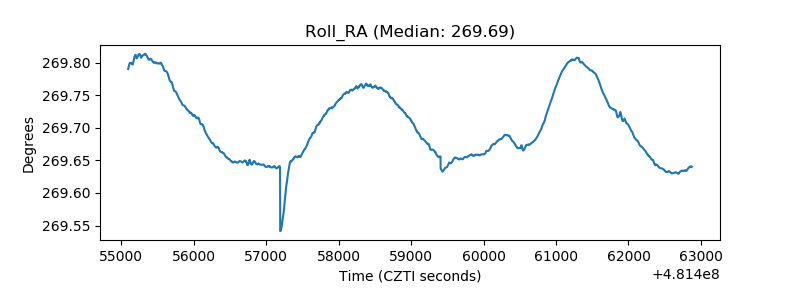 |
| Veto Counter | 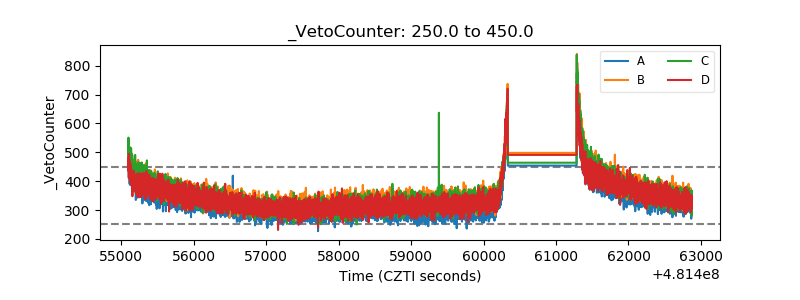 |